


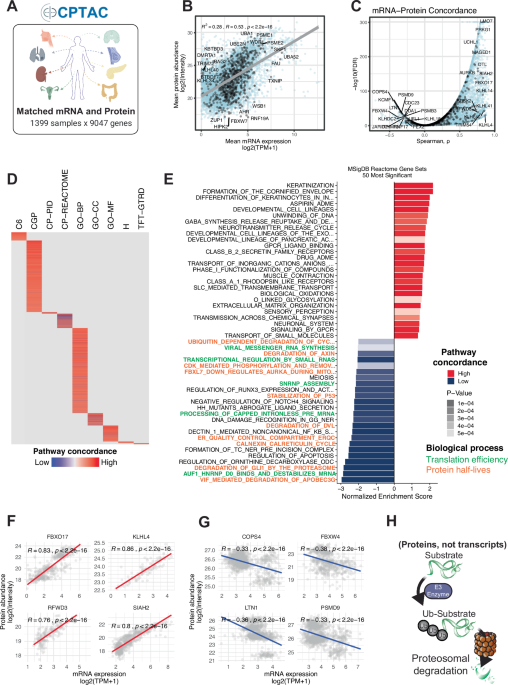
Divergence of RNA–protein establishes the need for proteome-centric UPS analysis
Although transcriptomic profiling remains widely used for functional inference, mRNA abundance is an imperfect surrogate of protein levels. To quantify the extent to which transcript levels reflect functional proteomic states in tumors, we analyzed the matched mRNA and protein abundance profiles across CPTAC cohorts (Fig. 1A, B). For each sample and gene, we computed pairwise correlations between data modalities, enabling both sample-wise and gene-wise assessment of mRNA-protein expression concordance (Fig. S1A, B; see “Methods”). We observed a general positive association with a significant number of negative mRNA-protein expression correlations (Fig. 1C, Table S1), consistent with previous studies [27,28,29]. Gene set enrichment of genes with the lowest concordance between mRNA and protein (ρ < −0.2; P < 0.01) was most discordant in regulatory pathways that operate downstream of transcription, including differential translation efficiency and protein half-lives, none of which could be inferred from mRNA alone (Fig. 1D, E, and S1E). Metabolic and housekeeping genes were overrepresented in those with the highest correlation (Fig. S1C), whereas transcription factors, signaling molecules, and UPS components frequently displayed weak or even inverse relationships (Fig. S1D). The high variability in mRNA-protein concordance among UPS components (Fig. 1F, G) is consistent with proteins, rather than transcripts, serving as the direct biochemical effectors of UPS-mediated degradation (Fig. 1H). This underscores the value of proteome-centered profiling to accurately characterize UPS biology and identify context-dependent vulnerabilities relevant to cancer progression and therapeutic targeting.
Fig. 1: mRNA–protein divergence motivates a proteome-centric UPS analysis.
A Overview of CPTAC cohorts and data modalities used for matched mRNA–protein correlation analysis across human tumors. B Scatter plot of mean mRNA expression versus mean protein abundance for genes quantified across CPTAC cohorts, highlighting UPS-associated genes in black. C Distribution of gene-wise mRNA–protein concordance measured by Spearman’s correlation; UPS-associated genes are highlighted in black. D Heatmap summarizing pathway-level mRNA–protein concordance based on gene-set Spearman’s correlations across multiple pathway databases (red, higher concordance; blue, lower concordance). E Bar plot showing the most significantly concordant (red) and discordant (blue) Reactome pathways (P < 0.05). F Representative UPS-associated genes with positive mRNA–protein Spearman’s correlations. G Representative UPS-associated genes with negative mRNA–protein Spearman’s correlations. H Schematic illustration of E3-mediated protein degradation, highlighting the central role of UPS proteins as direct effectors of proteome remodeling.
Differential protein expression reveals UPS dysregulation in cancer
To characterize UPS dysregulation in cancer, we performed differential protein expression analysis across nine CPTAC cohorts, including eight matched tumor-normal adjacent tissues and one unmatched glioblastoma (GBM) dataset (Fig. 2A). Among the 12,855 quantified proteins, 1287 UPS components (comprising 672 E3s) were evaluated.
Fig. 2: Tumor-specific dysregulation of UPS proteins across CPTAC cohorts.
A Schematic illustrating CPTAC cohorts, sample composition, and proteomic data used for tumor-vs-normal differential expression (left), with the distribution of matched and unmatched normal tissues across cohorts (right). B Volcano plot summarizing differential protein abundance between tumor and normal tissues across CPTAC cohorts; horizontal dashed line, adj P < 0.05; vertical dashed lines, |log2FC | > 0.5. C UpSet plot summarizing UPS proteins significantly downregulated (adj P < 0.05, |log2FC | > 0.5) in one or more cohorts. D UpSet plot summarizing UPS proteins significantly upregulated under the same thresholds. E Heatmap of selected UPS proteins (n = 90) showing significant up- (signed –log10(adj P) > 2.5; red) or downregulation (< –2.5; blue) across CPTAC cohorts.
Across cohorts, 797 UPS-associated proteins were consistently quantified in at least 50% of CPTAC samples, including 410 E3s (Fig. S2A, B). Using a threshold of |log2 fold change (LFC)| > 0.5 and adj P < 0.05, we identified 1025 (562 unique) significantly dysregulated UPS proteins in at least one cohort, of which 503 (295 unique) were E3s (Fig. S2C, D and Table S2). We evaluated the extent of UPS protein changes within individual cohorts and observed marked variation, ranging from 33 proteins in COAD (2.6%) to 357 in GBM (27.7%) (Fig. S2C). GBM, UCEC, and LSCC exhibited the greatest differential burden across the UPS and E3s, while COAD and HGSC showed minimal changes (Fig. 2B and S2C, D; Table S2). These differences were not due to missing values alone, as all cohorts were filtered to have similar protein coverage (797 UPS and 410 E3s quantified in at least 50% of samples) but reflect true variability in UPS protein changes across cancer types. Moreover, the elevated burden observed in GBM may be attributable to the absence of matched adjacent normal tissue, which can inflate differential expression estimates. This reflects an inherent limitation of sample availability, as the collection of normal adjacent brain tissue from living patients with GBM is not ethical.
Although UPS components were less frequently changed in abundance than the global proteome (Fisher’s exact test, odds ratio <1, adj P < 0.0001, Fig. S2G), consistent with the selective constraint on the core proteostasis machinery, a distinct subset showed significant and context-specific changes (Fig. 2B and S2A–D). These patterns suggest that UPS dysregulation is selective rather than random. Specifically, several E3s displayed consistent dysregulation across four or more cancer types (Fig. 2C–E and S2E, F, adj P < 0.05, |LFC | > 0.5). These included downregulation of the tumor suppressor PRKN and putative tumor suppressor RNF123 (Fig. 2C, E; Table S1) and upregulation of oncogenic or pro-proliferative E3s, such as SKP2 and CDT2 (DTL) (Fig. 2D, E; Table S1). Notably, protein levels of several canonical tumor suppressor E3s such as VHL and FBXW7 were frequently undetected, a pattern consistent with mutation-driven protein instability [30, 31], epigenetic silencing [32], lack of tryptic peptides needed for MS detection [33], or copy number loss [34] (Fig. S2H).
This analysis also identified context-dependent changes. KEAP1, a Cullin-RING Ligase 3 (CRL3) substrate receptor and tumor suppressor in lung adenocarcinoma (LUAD), was downregulated in LUAD (LFC = −0.2, adj P < 0.001), consistent with previous reports [35,36,37,38], but upregulated in LSCC (LFC = 0.4, adj P < 0.001) and GBM (LFC = 0.5, adj P < 0.001) (Table S2). In LSCC, increased KEAP1 protein abundance did not correlate with predicted tumor suppressive activity (protein loss compared to normal tissue). However, LSCC tumors harbor frequent KEAP1 mutations that cluster within the Kelch/DGR domain required for NRF2 substrate recruitment (Fig. S2H), likely rendering the elevated protein levels functionally inert [38]. To confirm KEAP1 loss of activity, we evaluated the anti-correlation between KEAP1 and its known target NRF2 (NFE2L2), as well as NRF2 downstream effectors (NQO1 and GCLC), but these proteins were not consistently quantified across CPTAC datasets. Differential expression also highlighted less-characterized UPS components with conserved suppression across tumors, such as KBTBD11 and CAND2, suggesting possible tumor suppressive roles. Conversely, NEDD4 and RNF144A showed heterogeneous tumor-type-specific patterns (Fig. 2E).
Overall, our differential UPS protein analysis revealed both pan-cancer and tissue-specific dysregulation. Given the catalytic nature of E3s, it is important to note that even modest shifts in their abundance can result in significant quantitative effects on substrate stability and downstream signaling, underscoring the need for protein-level profiling to accurately identify UPS vulnerabilities in cancer.
UPS protein expression levels stratify cancer prognosis in a tissue-specific manner
To assess the clinical consequences of UPS dysregulation, we stratified patients by UPS-associated protein abundance and examined their relationship with patient survival across 11 CPTAC tumor types (Fig. 3A). For each of the 922 UPS proteins (including 411 E3s), we classified patients within each tumor type into UPS-high or UPS-low groups, based on the upper and lower quartiles of normalized protein abundance (Fig. S3A, B). Stratification was performed using both pan-cancer and per-cancer approaches, followed by systematic survival analysis comparing overall survival between the UPS-high and UPS-low groups (Fig. 3B, C).
Fig. 3: Overall-survival profiling of UPS-associated proteins.
A Schematic of the survival analysis design (UPS-high vs UPS-low quartile stratification, Kaplan-Meier (KM) and Cox models). B Bubble plot of pan-cancer Cox log-hazard ratios for UPS-associated proteins; red, higher abundance associated with worse survival; blue, better; size, statistical significance. C Heatmap of per-cancer Cox log-hazard ratios across tumor types; asterisks, significant after multiple-testing correction. D KM curve for a representative UPS protein with poorer pan-cancer survival when high. E KM curve for a representative protein with better pan-cancer survival when high. KM curves of representative lineage-specific UPS-associated proteins linked to worse (F) or better (G) survival in selected tumor types.
Kaplan–Meier survival analysis identified 153 E3s whose protein expression was significantly associated with overall patient survival in at least one cohort (log-rank p < 0.05, Fig. S3C). Multivariate Cox regression models, adjusting for age, sex, and tumor purity (pan-cancer) or for tumor purity alone (per-cancer), confirmed independent prognostic association of multiple E3s (|logHR | > 0.5, p < 0.05, log-rank p < 0.05; Fig. 3B, C and S3D, E; Table S1). This dual-test framework, with effect-size filtering, prioritizes robust associations while mitigating false positives.
Pan-cancer analysis identified relatively few consistent E3 survival predictors. Notably, high expression of FBXL18 was significantly associated with worse patient survival, likely driven by effects in LSCC (Fig. 3D and S3D), whereas an increased abundance of FBXL3 predicted improved clinical outcomes (Fig. 3E). Both proteins are members of the F-box protein family and function as substrate receptor adaptors within the Cullin-RING Ligase 1 (CRL1) E3 complexes [19]. By contrast, a larger number of E3s displayed tumor-specific prognostic effects. High expression of FBXO33 and UBR5 predicted poor prognosis in LUAD and PDAC, whereas overexpression of KBTBD11 and FBXL3 was associated with improved survival in PDAC and ccRCC, respectively (log-rank p < 0.05, Fig. 3F, G). Interestingly, high TRIM28 levels predicted improved survival in LUAD (p = 0.031) and a trend (p = 0.059) toward a favorable outcome in GBM, yet showed poor survival in HNSCC (p = 0.0062) (Fig. 3F, G and S3E).
Together, these findings reveal that E3s can serve as both prognostic biomarkers and mechanistic indicators of tumor-specific UPS dependency.
Cancer-associated mutations reshape the UPS protein landscape
To determine whether cancer-associated mutations alter UPS protein abundance, we modeled each UPS protein (Y) as a function of mutation status (M) while controlling for tumor purity (P) and patient cohort (C) (Fig. S4A and “Methods”, Eq. 1). For this purpose, we analyzed 9,495 recurrent gene mutations that were detected in at least 11 tumor samples across 10 CPTAC cohorts to avoid unbalanced or underpowered comparisons (Fig. S4B).
Systematic UPS protein quantitative trait locus (pQTL) analysis revealed 17,925 significant UPS protein–gene mutation associations (false discovery rate or FDR < 10%; Fig. 4A and Table S1), demonstrating widespread mutation-associated proteomic restructuring across all UPS levels, including E2s (e.g., UBE2T), E3s (e.g., DDB2, CDC20, FBXO22, UBR5, CDT2 (DTL), TRIM3, and TRIM29), deubiquitylases (e.g., USP28 and MINDY1), and proteasome-associated proteins (e.g., AURKB and PLK1) (Fig. 4A, B and Table S1). These alterations have been observed across multiple cancer types and likely reflect heterogeneous regulatory mechanisms. For example, TRIM29 showed coordinated upregulation at both mRNA and protein levels (Figs. S4C–F, S5), whereas UBR5 exhibited a protein-specific expression phenotype consistent with post-transcriptional and/or post-translational regulation (Figs. S4C–F and S6) [39].
Fig. 4: Mutation-to-protein quantitative-trait-locus (pQTL) analysis of UPS remodeling.
A Manhattan plot of significant somatic-mutation–UPS-protein associations across CPTAC cohorts; y-axis, transformed FDR; horizontal dashed line, FDR = 0.005. B Volcano plot of TP53 mutation effects on UPS protein abundance; x-axis, β₁; horizontal dashed line, FDR = 0.05. C Bubble plot of median log2 fold changes of selected UPS proteins in TP53-mutant vs wild-type tumors across cohorts; bubble size, Wilcoxon P; black outline, FDR < 10%. D Oncoplot of the 15 most frequently mutated UPS-associated genes across CPTAC cohorts with tumor mutational burden (TMB).
TP53 mutations produced a striking proteomic signature (Fig. 4A, B and Table S1). Tumors with TP53 point mutations showed significant dysregulation in 111 proteins (FDR < 5%) with upregulation in CDT2 (DTL), CDC20, and PLK1 (components promoting S-phase progression and mitotic bypass) and downregulation of TP53 transcriptional targets, such as DDB2 and FBXO22, consistent with impaired DNA repair signaling (Fig. 4B, C). These observations align with known TP53 biology and reveal broader effects on UPS regulation.
Several E3s exhibited mutation-dependent and context-specific regulation. Both mRNA and protein expression of TRIM29 was consistently elevated in TP53-mutant BRCA and PDAC (Wilcoxon P < 0.05; Fig. 4C and S5), suggesting that observed changes are driven by transcriptional regulation associated with TP53 mutations. UBR5 protein, a HECT-type E3 involved in DNA damage response and chromatin maintenance [40,41,42,43], was consistently upregulated in TP53-mutant tumors across seven cohorts (BRCA, COAD, UCEC, HGSC, HNSCC, LSCC, and LUAD; Wilcoxon P < 0.05, Fig. 4C and S6B–D). Of these, UBR5 upregulation observed in 3 out of 7 cohorts (COAD, LSCC and LUAD) was likely driven by transcriptional activity (Fig. S6A), while 4 out of 7 tumors (BRCA, UCEC, HGSC and HNSCC) only showed post-translational changes (Fig. S6B). UBR5 is known to preferentially assemble K48-linked polyubiquitin chains, which directly signal proteasomal degradation [40], thus providing a mechanistic rationale linking UBR5 elevation to enhanced substrate turnover in TP53-deficient contexts. This finding is consistent with the proposed UBR5 oncogenic function in TP53-deficient cancers [44]. In contrast, FBXO22, an E3 protein transcriptionally induced by TP53 [45], was downregulated in TP53-mutant tumors (Fig. 4B, C), reflecting a loss of TP53-mediated transcription.
UPS genes also harbored frequent somatic mutations (Fig. 4A, D and Table S1). Canonical tumor suppressors, such as VHL (8%) and FBXW7 (4%), exhibited high mutation frequency, consistent with their well-established roles in substrate stabilization and tumorigenesis upon loss [30, 31, 46]. Less-characterized E3s, including RNF213 (5%), were also found to be recurrently mutated across cancer types, suggesting broader roles in proteostasis rewiring. RNF213 has been implicated in the regulation of hypoxia-induced inflammatory cell death in cancer [47] and is broadly amplified across tumors in cBioPortal [48, 49]. This was consistent with the elevated RNF213 protein abundance observed earlier in CPTAC samples (Fig. 2E). These results demonstrate that somatic mutations alter distinct UPS remodeling axes in cancer, revealing mutation-driven proteostatic states with potential therapeutic relevance.
Distinct UPS remodeling axes exemplified by UBR5 and TRIM28
To understand the functional consequences of UPS remodeling, we investigated two representative E3s (UBR5 and TRIM28) that exhibited strong but divergent cancer associations. We evaluated how variation in UPS protein abundance is related to mutational context and tumor lineage. Associated functional programs were also characterized using four complementary approaches: (1) UPS protein co-regulation analysis, (2) proteome-wide pathway enrichment, (3) lineage-specific dependency profiling [50, 51], and (4) drug sensitivity analysis [52] (Fig. 5A, S7 and Table S3).
Fig. 5: TRIM28 exemplifies lineage-associated UPS vulnerabilities.
A Schematic of the integrated analysis: protein co-regulation, pathway enrichment, co-dependency, and drug sensitivity for UBR5 and TRIM28. B TRIM28 protein co-regulation pan-cancer; color, between-cohort SD of correlation; red outline, BioGRID interactors; axes, signed transformed FDR and ρ. C GSEA of TRIM28 co-regulated proteins (preranked, MSigDB, 1000 permutations). D TRIM28 co-dependency network in CNS/brain cell lines (DepMap CRISPR Chronos); nodes, top positively co-dependent genes; red, BioGRID interactors. E TRIM28 co-dependency network in HNSCC cell lines, plotted as in (D). F TRIM28-protein–PRISM compound associations in glioblastoma cell lines; horizontal dashed line, FDR = 10%. G TRIM28-protein–PRISM compound associations in HNSCC cell lines.
UBR5 defines a mutation-associated UPS remodeling axis
UBR5 protein abundance was consistently elevated in TP53-mutant tumors across multiple cancer types (Fig. S6B) and high UBR5 expression was associated with poor survival in PDAC (Fig. 3F). Notably, UBR5 protein upregulation was not consistently accompanied by a proportional increase in mRNA expression, resulting in significantly increased protein-to-mRNA ratios across cancers (Wilcoxon P < 0.05, Fig. S8). Therefore, we interpreted this pattern as post-transcriptional regulation, consistent with increased UBR5 protein stability or reduced turnover, rather than transcriptional induction.
Pathway enrichment analysis of UBR5-high tumors revealed consistent upregulation of DNA replication and repair machinery, checkpoint regulation, chromatin remodeling factors, downregulation of TP53 target genes, and AKT-driven proliferative signaling pathways (Fig. S9B, C and Table S3). These programs align with the known biochemical roles of UBR5 in genome maintenance as well as cell cycle regulation and suggest that elevated UBR5 supports tolerance to replication stress in TP53-deficient contexts [42, 53, 54].
To assess the functional dependencies associated with this state, we performed DepMap co-dependency analysis (Figs. S7F, S9D, S10A and Table S3). The UBR5-high cell lines exhibited coordinated dependency patterns with genes involved in replication-coupled chromatin maintenance and DNA damage response (DDR) pathways, including TRIP12 and MED25, along with chromatin- and ubiquitin-linked stress regulators (Figs. S9D, S10A and Table S3).
Consistent with these dependencies, PRISM (profiling relative inhibition simultaneously in mixtures) drug sensitivity profiling showed that UBR5-high cell lines showed sensitivity to ATR and CHK1 inhibitors (which target DDR pathways) [55], and were most sensitive to compounds targeting RNA splicing, cell cycle regulation and PI3K/mTOR signaling (PRMT5 inhibitor JNJ-64619178), as well as innate immune signaling (STING agonist MIW-815) (Fig. S9E and Table S3). Together, these findings suggest that UBR5 is a mutation-associated regulator of proteostasis, whose elevation supports genome maintenance programs while simultaneously creating exploitable therapeutic vulnerabilities.
TRIM28 defines a lineage-specific UPS remodeling axis
In contrast to UBR5, TRIM28 abundance was not associated with recurrent somatic mutations but instead displayed lineage-specific phenotypes. Protein co-regulation analysis revealed that TRIM28 abundance was positively associated with chromatin- and transcription-associated factors (e.g., TOP2B and FUBP3) and negatively associated with cytoskeletal and metabolic proteins (Fig. 5B). This pattern suggests that TRIM28 participates in coordinated regulatory programs with its positively associated partners and may contribute to the selective suppression of negatively associated proteins. Pan-cancer analyses revealed that TRIM28-high tumors were enriched in MYC- and E2F-driven transcriptional programs, RNA processing factors, and chromatin regulatory complexes (Fig. 5C and Table S3). However, the clinical consequences of TRIM28 upregulation diverged sharply by tissue context, with high expression correlating with a trend to improved survival in GBM but poor survival in HNSCC (Fig. 3F, G).
To understand these opposing associations, we performed context-specific pathway enrichment analysis. In GBM, TRIM28-high tumors showed increased expression of DNA repair and chromatin organization pathways, consistent with a genome-stabilizing role (Fig. 5C and Table S3). By contrast, TRIM28-high HNSCC tumors were enriched in mitochondrial metabolism and immune mimicry programs, whereas cell adhesion and EMT programs appeared to be downregulated (Fig. 5C and Table S3), suggesting distinct functional roles across lineages.
The lineage-resolved dependency analyses reinforced these distinctions. In CNS-derived cell lines, including GBM cell models, TRIM28 dependency was correlated with growth and stress adaptation programs, including RTK-PI3K signaling (FLT3), mitochondrial stress regulation (PGAM5), transcriptional reprogramming (MZF1), and EGFR-MAPK pathway scaffolding (FAM83E) (Fig. 5D, S10B and Table S3). In contrast, head and neck cancer cell lines exhibited TRIM28-associated dependencies enriched for chromatin and RNA regulatory machinery, including KRAB-zinc finger transcription factors (ZNF460 and ZNF497) and the RNA-binding protein HNRNPR, consistent with lineage-specific transcriptional repression and RNA processing programs (Fig. 5E, S10B and Table S3).
Drug sensitivity profiling [52] further reinforced the lineage-specific nature of TRIM28 dependence. In the CNS, TRIM28-high cell lines were preferentially sensitive to compounds targeting chromatin-associated DNA damage regulation and stress adaptation, including the SIRT1 activator SRT2104 and DNA damage response signaling through the DNA-PK inhibitor VX-984 [56], while exhibiting relative resistance to redox and inflammatory agents, such as ebselen and phenylbutazone, respectively (Fig. 5F and Table S3). By contrast, TRIM28-high head and neck cell lines displayed increased sensitivity to drugs linked to metabolic and growth signaling, including ibutamoren and belizatinib, while showing resistance to compounds associated with proteostasis, cytoskeletal remodeling, and EMT-related programs, such as the VCP/p97 inhibitor NMS-873 and GPCR modulator alimemazine (Fig. 5G and Table S3). These results indicate that TRIM28 reshapes the local proteostatic and signaling environment in a strong lineage-dependent manner.
Together, UBR5 and TRIM28 define two orthogonal modes of UPS remodeling: (1) a mutation-driven axis, in which TP53 mutations allow for increased UBR5 abundance to support replication stress tolerance and chromatin maintenance, and (2) a lineage-driven axis, in which TRIM28 engages distinct regulatory networks to shape tumor behavior in a tissue-specific manner (Fig. 6). These mechanisms illustrate how selective modulation of UPS components can support cancer progression while simultaneously exposing context-specific therapeutic opportunities.
Fig. 6: Conceptual model of mutation- and lineage-driven UPS remodeling in cancer.
Schematic illustrating two orthogonal modes of UPS regulation in tumors: a mutation-driven axis, exemplified by TP53-driven UBR5 elevation supporting replication stress tolerance and chromatin maintenance (left), and a lineage-driven axis, exemplified by TRIM28 engaging tissue-restricted regulatory networks to reshape proteostasis and signaling (right), generating distinct therapeutic vulnerabilities (DDR/PI3K inhibitor sensitivity in UBR5-high TP53-mutant tumors; lineage-specific drug responses in TRIM28-high CNS vs HNSCC).
