


Cell culture
A172, LN229, U251, U87, HT1080, and 293T cells were cultured in DMEM (GIBCO, C11995500BT) supplemented with 10% Fetal Bovine Serum (FBS, GIBCO, 1009914), 1% Penicillin/Streptomycin (P/S, GIBCO, 10378016), and 1% non-essential amino acids (NEAA, GIBCO, 11140050). THP-1 cells were cultured in RPMI 1640 (GIBCO, C11875500BT) supplemented with 10% FBS, 1% P/S, 1% NEAA, and 55 mM 2-Mercaptoethanol (GIBCO, 21985023). Primary human bone marrow-derived macrophages were obtained from Shanghai Jinyuan Biotechnology and cultured under the manufacturer’s instructions. GBM322, GBM324, and GBM326 were obtained from WuXi XDC and cultured under the manufacturer’s instructions. GBM375 was obtained from Pharmaron and cultured under the manufacturer’s instructions. GL261 cells were cultured in DMEM supplemented with 10% FBS, 1% P/S, 1% L-GlutaMAX (GIBCO, 35050061), and 1% HEPES (1M, GIBCO, 15630080). 293T cells, transfected with plasmids for NanoBRET signal detection, were cultured in NanoBRET culture medium (OPTI-MEM basal medium (GIBCO, 31985-070) supplemented with 4% FBS and 1% P/S). All cells were maintained in a humidified incubator at 37 °C with 5% CO2.
Mouse strains
All animal experiments in this study were conducted in accordance with the guidelines and regulations of the Institutional Animal Care and Use Committee (IACUC) of Tsinghua University, Beijing, China or Pharmaron. All protocols were approved by the IACUC. Mice were housed in groups (with a maximum of six mice per cage) under specific-pathogen-free conditions at Tsinghua University. They were maintained on a 12/12-h light/dark cycle, at a temperature of 22–26 °C, with ad libitum access to sterile pellet food and water. 6–8-week-old female NCG (NOD/ShiLtJGpt-Prkdcem26Cd52Il2rgem26Cd22/Gpt) mice and 6–8-week-old female BALB/c Nude mice were purchased from GemPharmatech (Nanjing, China). 6–8-week-old female C57BL/6J mice were purchased from the Laboratory Animal Resources Center, Tsinghua University.
Plasmids
All shRNA plasmids were purchased from the shRNA library at the Center of Biomedical Analysis, Tsinghua University. The shRNA sequences used for UFL1 knockdown were: shRNA-A6: CCGGCCACTTTAGAAAGCGTTAGTACTCGAGTACTAACGCTTTCTAAAGTGGTTTTTTG; shRNA-A10: CCGGCCAGTAAGCATAAGTCATATTCTCGAGAATATGACTTATGCTTACTGGTTTTTTG. The shRNA sequence used for DDRGK1 knockdown was: shRNA-G10: CCGGGCCAGGCAGTTATAGATTAAACTCGAGTTTAATCTATAACTGCCTGGCTTTTTG.
Full-length cDNAs of UFL1, DDRGK1, and RAMP4 were amplified from a cDNA library prepared from HEF cells. UFL1 and DDRGK1 cDNAs were individually cloned into expression vectors, including pLenti CMV GFP Hygro Vector (Addgene, #17446), pFC14K HaloTag® CMV Vector (Promega, EU113047), pFN21A HaloTag® CMV Vector (Promega, EU621374), pFC32K Nluc CMV-neo Flexi® Vector (Promega, KF811456), pFN31K Nluc CMV-neo Flexi® Vector (Promega, KF793053), pCW57.1 plasmid backbone (Addgene, #41393), and pET28a plasmid backbone, using the In-Fusion cloning system (HiFi DNA Assembly Master Mix, NEB #E2621). The cDNAs of UFL1Δ1–212 and DDRGK1Δ216–314 were amplified from a cDNA library prepared from HEF cells and cloned into the pET28a plasmid backbone. The pH-sensitive-EGFP-mCherry fusion protein was cloned from pBABE-puro-mCherry-EGFP-LC3B (Addgene, #22418) and inserted into the pCW57.1 plasmid backbone, along with RAMP4 cDNA. The EGFRvIII cDNA was generated by fusing EGFR exon 1 directly to exon 8, recapitulating the canonical deletion of exons 2–7, and was cloned into pLenti CMV Hygro Vector (Addgene, #17446) with dTomato expression. The luciferase DNA sequence was cloned from pCW57.1-Luciferase plasmid (Addgene, #99283) and inserted into a lentivirus backbone with an EFS promoter.
Lentivirus production and transduction
For lentivirus production, 293T cells were transfected with the gene-of-interest expression plasmids, along with lentivirus packaging plasmids: psPAX2 (Addgene, #12260) and pMD2.G (Addgene, #12259), using VigoFect (Vigorous Biotechnology, T001) according to the manufacturer’s instruction. The culture medium containing lentivirus was harvested 48 h post-transfection, then filtered using a 0.45-μm membrane filter. For lentivirus transduction, the filtered lentivirus-containing medium was added to target cell lines. The medium was replaced 24 h post-infection, and the cells were further selected with 2 μg/mL puromycin (Solarbio, P8230) or 50 μg/mL hygromycin B (MCE, HY-B0490) 48 h post-infection.
High-throughput compound screening
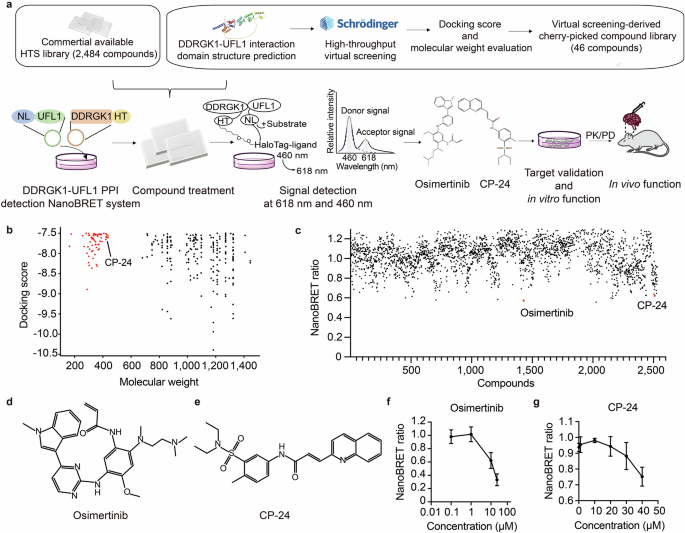
To define the cherry-picked library from the large-scale virtual compound library, we used the one provided by the Global Health Drug Discovery Institute (GHDDI). Starting with the SMILES notation for each compound, we generated SDF files using the PandasTools.WriteSDF function from the RDKit package (RDKit: Open-source cheminformatics. https://www.rdkit.org. 2022.09.5 version) in Python. Ligand preparation for virtual screening was then performed using the LigPrep function in Maestro software (Schrödinger Suites 2021-3). The full-length structures of DDRGK1, UFL1, UFL1Δ1–212, DDRGK1Δ216–314, and the UFL1Δ1–212-DDRGK1Δ216–314 interaction structures (with a (GGGGG)10 linker between UFL1Δ1–212 and DDRGK1Δ216–314) were predicted using AlphaFold2 v2.1.1 (based on the November 2021 version on GitHub: commit 91b43223422420d1783ed802c8b3a8382a9309fd). The DDRGK1 docking grid was generated using the Protein Preparation function, followed by the Receptor Grid Generator function in Maestro. Docking was performed using the Ligand Docking function in Maestro. The molecular weight of each compound was calculated by CalcExactMolWt function from the RDKit python package. Compounds with molecular weights below 600 Da and docking scores < −7.5 were selected for the cherry-picked library, which was then used for subsequent NanoBRET-based DDRGK1-UFL1 PPI inhibitor screening.
To determine the optimal NanoBRET pairs for screening, we transfected 8 pairs of DDRGK1-UFL1-based NanoBRET plasmid pairs (shown in Supplementary Fig. 1f) into 293T cells using Vigofect with a donor-plasmid to acceptor-plasmid of 100:1. 24 h after transfection, cells were seeded into 384-well plates (Corning, 3701) with NanoBRET culture medium, and HaloTag ligand (Promega, N1662) was added at different dilution ratios from 1:500 to 1:4000 (as shown in Supplementary Fig. 1g). 16 h after adding the HaloTag ligand, NanoLuciferase substrates (Promega, N1662) were added into each well, at dilution ratios ranging from 1:500 to 1:4000 (as shown in Supplementary Fig. 1g). NanoBRET signals at 418 nm and 618 nm were detected by PerkinElmer EnVision® Multilabel Reader 10 min after substrate incubation. For the NanoBRET dose saturation assay, 293T cells were transfected with NL-UFL1 and DDRGK1-HT plasmids in ratios ranging from 1:1 to 1:1000, and then detected as described above.
We conducted NanoBRET-based high-throughput screening to identify DDRGK1-UFL1 PPI inhibitors using a compound library from the Center of Pharmaceutical Technology at Tsinghua University, along with the previously defined cherry-pick library. We transfected 293T cells with NL-UFL1 and DDRGK1-HT plasmids, then replated the cells into 384-well plates (Corning, 3701). After 24 h, HaloTag Ligands were added to the culture medium. Compounds were introduced into each well using the Echo® 550 Liquid Handler, and after 16 h of incubation, the NanoBRET signal for each well was measured as described previously. The NanoBRET Ratio was calculated to identify compounds that inhibited DDRGK1-UFL1 interactions, as follows:
$${BU}=\frac{{Acceptor}\,618\,{nm}}{{Receptor}\,460\,{nm}}$$
$${mBU}=1000\times \frac{{Acceptor}\,618\,{nm}}{{Receptor}\,460\,{nm}}$$
$${Correct\; mBU}={{mBU}}_{{ligand}}-{{mBU}}_{{DMSO}},\mathrm{NanoBRET\; ratio}=\frac{{{Correct}\,{mBU}}_{{Compound}}}{{{Correct}\,{mBU}}_{{Solvent}}}$$
Chemical synthesis of CP-24
Synthesis of Compound 3 (Supplementary Fig. 9a): Triethylamine (Et3N, 3.22 g, 31.8 mmol) was added to a solution of compound 1 (5 g, 21.2 mmol) in Tetrahydrofuran (THF, 100 mL). Compound 2 (3.1 g, 4.24 mmol) was added slowly. The reaction was stirred at 25 °C for 2 h. Water (300 mL) was then added to the reaction, followed by extraction with Ethyl acetate (EtOAc, 100 mL ×3). The combined organic layer was washed with brine (200 mL). After drying and filtration, the solvent was removed. 5.2 g of product was obtained as a yellow oil. Yield: 90.0%.
Synthesis of Compound 4 (Supplementary Fig. 9a): Pd/C (1 g) was added to a solution of compound 3 (5.6 g, 20.6 mmol) in MeOH (50 mL) and EtOAc (50 mL). The reaction was stirred at 25 °C for 16 h in H2 atmosphere (1 atm). After filtration, the reaction was concentrated, and 4.8 g of product was obtained as a yellow solid. Yield: 96.3%.
Synthesis of Compound 7 and 7 A (Supplementary Fig. 9a): NaH (6.11 g, 152.8 mmol, 60%) was added slowly to a solution of compound 6 (32.1 g, 152.8 mmol) in THF (250 mL) at 25 °C. The reaction was stirred at 25 °C for 30 min, then cooled to 0 °C, compound 5 (20 g, 127.3 mmol) in THF (50 mL) was added, and the reaction was stirred at 25 °C for 2 h. NH4Cl was added to the reaction, followed by extraction with EtOAc (200 mL ×3). The combined organic layer was washed with brine (200 mL). After drying and filtration, the solvent was removed. The crude product was purified by flash chromatography, and 23 g of product (7/7 A ~ 15/2) was obtained as a yellow solid. Yield: 84.8%.
Synthesis of Compound INTA (Supplementary Fig. 9a): NaOH (3.75 g, 93.8 mmol) was added to a solution of compound 7 and 7 A (10 g, 46.9 mmol, 7/7 A ~ 15/2) in MeOH (100 mL) and H2O (100 mL). The reaction was stirred at 25 °C for 1 hour. EtOAc (200 mL) was added to the reaction, and the aqueous layer was separated. The organic layer was extracted with H2O (50 mL ×3), and the combined aqueous layer was adjusted to pH ~5 using HCl (1 M). After filtration and drying, 9 g of product was obtained as a white solid. Yield: 96.3%.
Synthesis of CP-24: Compound INTA (3.69 g, 17.3 mmol), Hexafluorophosphate Azabenzotriazole Tetramethyl Uronium (HATU, 9.87 g, 26 mmol), and N,N-Diisopropylethylamine (DIPEA, 4.47 g, 34.6 mmol) were added to a solution of compound 4 (4.2 g, 17.3 mmol) in DMF (80 mL). The reaction was stirred at 25 °C for 2 h. Water (300 mL) was then added to the reaction. After filtration and drying, the crude product was purified by flash chromatography, yielding 7.5 g of product. The product was further purified by slurry in EtOAc (100 mL) for 16 h. Then after filtration and drying, 5.1 g of product was obtained as a yellow solid. Yield: 69.5%. LCMS: Rt = 1.114 min, MS: 424.15 [M + H]+. 1H NMR (400 MHz, DMSO) δ 10.73 (s, 1H), 8.46 (d, J = 8.4 Hz, 1H), 8.31 (d, J = 2.0 Hz, 1H), 8.08 – 7.98 (m, 2H), 7.90 – 7.76 (m, 4H), 7.69 – 7.60 (m, 1H), 7.42 (dd, J = 14.0, 12.0 Hz, 2H), 3.29 (q, J = 7.2 Hz, 4H), 2.49 (s, 3H), 1.10 (t, J = 7.2 Hz, 6H). The NMR and HPLC report for CP-24 was in Supplementary Data 1.
Protein purification
Full-length DDRGK1, UFL1, DDRGK1Δ216–314, and UFL1Δ1–212 peptides with a 6× His tag and TEV protease cleavage site (ENLYFQG) were purified under the pET28a expression system in E. coli Transetta (DE3) Chemically Competent Cells (Transgen, CD801-02). The transfected E. coli cells were cultured at 37 °C shaking at 220 rpm in a MaxQ™ 6000 incubator (Thermo Fisher Scientific). Protein expression was induced by adding 0.5 mM Isopropyl β-D-1-thiogalactopyranoside (IPTG) to the culture medium when the optical density at 600 nm (OD600) reached 0.6–0.8. After 12 h of culture, cells were harvested by centrifugation at 4000 rpm for 10 min. The cell pellet was lysed at 800–1000 MPa in lysis buffer (50 mM NaH2PO4, 300 mM NaCl, 10 mM imidazole), followed by centrifugation at 13,000 rpm for 40 min at 4 °C. The pellet was resuspended in lysis buffer supplemented with 8 M urea. The solution was centrifuged again at 13,000 rpm for 40 min at 4 °C, and the supernatant was incubated with Ni-NTA agarose beads (QIAGEN®, 30210) at 4 °C for 6 h. The beads were washed with wash buffer (50 mM NaH2PO4, 300 mM NaCl, 20 mM imidazole, 8 M urea), and the protein was eluted using elution buffer (50 mM NaH2PO4, 300 mM NaCl, 500 mM imidazole, 8 M urea). The protein was then diluted in renaturation buffer (20 mM Tris-HCl (pH 7.6), 0.2 mM glutathione disulfide (GSSG, MedChemExpress, HY-D0844), 1 mM glutathione (GSH, MedChemExpress, HY-D0187)) and concentrated by centrifugation using Amicon® Ultra Centrifugal Filters (3 kDa MWCO, 10 kDa MWCO, 30 kDa MWCO, Millipore Sigma, UFC8003, UFC8010, UFC8030). The TEV protease cleavage site was cleaved by incubation of TEV protease with a 6×His tag. Then the TEV protease cleavage site-containing peptide was removed by incubation with Ni-NTA agarose beads. The target protein was collected in the flow-through fraction. The protein was further concentrated by centrifugation using Amicon® Ultra Centrifugal Filters.
Isothermal titration calorimetry (ITC)
ITC experiments were performed using MicroCal PEAQ-ITC equipment. Purified UFL1Δ1–212 and DDRGK1Δ216–314 peptides were pre-incubated with DMSO, Osimertinib, or CP-24 for 12 h at 37 °C prior to the ITC experiments. The titration was performed at 25 °C with a stir speed of 750 rpm. The initial delay was set to 60 s, and the first injection was 0.4 μL for 0.8 s. Subsequent injections were performed with 2 μL per injection for 4 s, spaced 150 s apart.
LC-MS analysis of covalent binding by Osimertinib and CP-24
Osimertinib, CP-24, or DMSO was incubated with purified DDRGK1Δ216–314 peptide or purified UFL1Δ1–212 peptide at 37 °C for 12 h. Following incubation, the molecular weight of the peptides was measured using LC-MS. The analytes were separated by a 1-h gradient elution at a flow rate of 0.5 µL/min using a nanoACQUITY UPLC system (Waters), interfaced with a SYNAPT-G2-Si mass spectrometer (WatersTM). The analytical column was a Protein BEH C4 silica capillary column (WatersTM, 150 µm ID, 100 mm length, packed with C-4 resin (300 Å, 1.7 µm)). Mobile phase A consisted of 0.1% formic acid aqueous solution, and mobile phase B was 100% acetonitrile with 0.1% formic acid. Aliquots (2 µL) of the analytes were injected into an autosampler for nano-electrospray ionization. The samples were analyzed on a Q-TOF mass spectrometer (SYNAPT G2-Si, WatersTM) optimized for high-mass protein analysis. The capillary voltage was set at 3000 V, and data were collected over the m/z range of 500–4000. The raw native electrospray mass spectra were deconvoluted using MaxEnt 1 (WatersTM) to generate a spectrum displaying relative intensity versus mass, where all charge-state peaks for a given species were collapsed into a single (zero-charge) peak.
LC-MS/MS for identification of peptide and residue with Osimertinib modification
Osimertinib was incubated with purified DDRGK1Δ216–314 peptide at 37 °C for 12 h prior to electrophoresis on a 15% SDS-PAGE gel. After electrophoresis, the gel was stained with Coomassie Blue Fast Staining Solution (Beyotime Biotechnology, P0017). Protein bands were excised from the gel and subjected to in-gel digestion for protein modification identification by mass spectrometry as described below. First, the proteins were reduced using 5 mM dithiothreitol (DTT) and alkylated with 11 mM iodoacetamide. Then, in-gel digestion was performed using sequencing-grade modified trypsin in 50 mM NH4HCO3 overnight at 37 °C. The resulting peptides were extracted twice with 1% trifluoroacetic acid (TFA) in 50% acetonitrile aqueous solution for 1 h, followed by centrifugation in a SpeedVac to reduce the volume. The peptides were resuspended in 20 μL of 0.1% TFA and centrifuged at 20,000 × g for 15 min at 4 °C to remove particulate matter. For LC-MS/MS analysis, peptides were separated using a 40-minute gradient elution at a flow rate of 0.300 μL/min with an UltiMate 3000 HPLC System (Thermo Fisher Scientific), interfaced with an Orbitrap Fusion Lumos mass spectrometer (Thermo Fisher Scientific). The analytical column used was a homemade fused silica capillary column (75 μm ID, 150 mm length; Upchurch, Oak Harbor, WA), packed with C-18 resin (300A, 5 μm; Varian, Lexington, MA). Mobile phase A consisted of 0.1% formic acid, and mobile phase B was 100% acetonitrile with 0.1% formic acid. The mass spectrometer (LTQ Orbitrap) operated in data-dependent acquisition mode using Xcalibur 4.0.27.10 software. A full-scan mass spectrum was recorded in the Orbitrap over the m/z range of 300–1500 at a resolution of 120,000, followed by 3 s data-dependent MS/MS scans in an Ion Routing Multipole using HCD with 40% normalized collision energy. MS/MS spectra were acquired for each LC-MS/MS run and searched against the human database using the Proteome Discoverer (Version 1.4) searching algorithm. The search criteria were as follows: full tryptic specificity with up to two missed cleavages, carbamidomethylation as a fixed modification, oxidation of methionine (M) as a variable modification, precursor ion mass tolerance of 10 ppm for all MS acquired in the Orbitrap mass analyzer, and fragment ion mass tolerance of 0.8 Da for all MS2 spectra from the LTQ. A high-confidence score filter (FDR < 1%) was applied to select peptides with Osimertinib modification, and their corresponding MS/MS spectra were manually inspected.
Molecular docking for Osimertinib and CP-24 binding with DDRGK1Δ216–314
The binding poses of Osimertinib with DDRGK1Δ216–314 were predicted using the CovDock function in Maestro software, after performing ligand preparation with the LigPrep, protein preparation with the Protein Preparation function, and receptor grid generation with the Receptor Grid Generator function, all within the Schrödinger Suite 2021-3. The binding poses of CP-24 with DDRGK1Δ216–314 were predicted using the Ligand Docking function, following the same preparation steps.
Co-immunoprecipitation (co-IP)
U87 cells were treated for 24 h with vehicle (0.1% DMSO; Sigma-Aldrich, D4540), 10 μM Osimertinib (MedChemExpress, HY-15772), or 40 μM CP-24 (synthesized in-house; see Supplementary Fig. 9). Cells were harvested and lysed on ice for 40 min in NP-40 Lysis Buffer (Beyotime Biotechnology, P0013F), supplemented with protease and phosphatase inhibitor cocktail for general use (Beyotime Biotechnology, P1045). Lysates were then centrifuged at 12,000 rpm for 10 min at 4 °C to remove insoluble precipitate. Cleared lysates were incubated overnight at 4 °C with UFL1 Polyclonal antibody (1:200, Proteintech, 26087-1-AP) with rotation. Protein A/G magnetic beads (Millipore, LSKMAGAG02) were added and incubated with the sample at 4 °C for 6 h with rotation. The beads were separated on the magnet rack and washed three times with NP-40 Lysis Buffer. The bound proteins were eluted by boiling for 10 min at 98 °C in NP-40 Lysis Buffer containing 1× SDS-PAGE Sample Loading Buffer (Beyotime Biotechnology, P0015). Eluted samples were resolved by SDS-PAGE and analyzed by immunoblotting.
Western blot
GBM cells were treated with DMSO, 1 μM, 5 μM, 10 μM Osimertinib, 5 μM Afatinib (MedChemExpress, HY-10261B), 5 μM Erlotinib (MedChemExpress, HY-50896), 5 μM Gefitinib (MedChemExpress, HY-50895), 5 μM Tinodasertib (MedChemExpress, HY-112424), 5 μM Tomiversotib (MedChemExpress, HY-100022), 5 μM WZ4002 (MedChemExpress, HY-12026), or 10 μM, 20 μM, 40 μM CP-24 for 24 h prior to sample collection. For protein sample preparation, treated GBM cells were harvested and lysed in Radioimmunoprecipitation assay buffer (RIPA, Beyotime Biotechnology, P0013B), supplemented with protease and phosphatase inhibitor cocktail for general use, on ice for 20 min. Lysates were then centrifuged at 12,000 rpm for 10 min at 4 °C to remove insoluble precipitate. Protein samples were boiled with SDS-PAGE Sample Loading Buffer at 98 °C for 10 min. Protein samples were separated by 10–15% SDS-PAGE using running buffer (25 mM tris-base, 0.25 M glycine, 0.1% (w/v) SDS) at 80 V for 30 min, followed by 120 V for 60 min. Proteins were transferred onto a 0.45 μm Immubilon®-P Transfer Membrane (Merck Millipore, 0000176876) using transfer buffer (25 mM tris-base (MERYER, M26450), 38.6 mM glycine (Solarbio, G8200-1kg), 20% (v/v) methanol) at 100 V for 2 h. The membrane was blocked with Blocking Buffer (Beyotime Biotechnology, P0023B-500mL) at room temperature for 1 h. Primary antibodies against β-actin (1:1000 dilution, Santa Cruz Biotechnology, sc-47778), DDRGK1 (1:1000 dilution, Proteintech, 21445-1-AP), UFM1 (1:1000 dilution, Abcam, ab109305), UFL1 (1:1000 dilution, Proteintech, 26087-1-AP), EGFR (1:1000 dilution, Proteintech, 66455-1-Ig), and phospho-EGFR Tyr1068 (1:1000 dilution, CST, 2234S) were diluted in Primary Antibody Dilution Buffer (Beyotime Biotechnology, P0023A-500mL) and incubated with the membrane overnight at 4 °C. After three times washed with TBS-T, the membrane was incubated with secondary antibodies (m-IgGκ BP-HRP (1:5000 dilution; Santa Cruz Biotechnology, sc-516102) or mouse anti-rabbit IgG-HRP (1:5000 dilution; Santa Cruz Biotechnology, sc-2357)) in TBS-T. Blots were visualized using Super ECL Detection Reagent (Yeasen, S0228021) and scanned with an Amersham Imager 600 Imaging System following the manufacturer’s instructions. Original western blot data are in Supplementary Data 2.
ER-phagy detection
HT1080 cells were transfected with lentivirus to express mCherry-EGFP-RAMP4 under doxycycline (Dox) induction. Expression of mCherry-EGFP-RAMP4 was induced by 2 μg/mL Dox for 48 h prior to starvation. Starvation-induced ER-phagy was triggered by a 16-h treatment with Earle’s Balanced Salt Solution (EBSS, Macgene, CC026). Cells in DMEM complete medium culture (as described above) were used as the fed condition. Under starvation conditions, DMSO, 5 μM Osimertinib, 5 μM Afatinib, 5 μM Erlotinib, 5 μM Gefitinib, 5 μM Tinodasertib, 5 μM Tomiversotib, 5 μM WZ4002, or 40 μM CP-24 were added. Cells were washed with DPBS and fixed with 4% paraformaldehyde (PFA) before confocal imaging. For FACS, cells were dissociated into single-cell suspensions using 0.25% Trypsin-EDTA (Gibco, 25200072) and resuspended in FACS buffer (DPBS supplemented with 10% FBS).
Cell viability assay
To quantify the effects of Osimertinib, CP-24, Afatinib, Erlotinib, Gefitinib, Tinodasertib, Tomiversotib, WZ4002, Temozolomide (MedChemExpress, HY-17364), and radiation (10 Gy) on GBM cell growth, untreated, TMZ-resistant, or radiation-treated GBM cells were seeded in opaque-walled 96-well plates at a density of 1000 cells per well. TMZ-resistant GBM cells were generated by gradually escalating TMZ concentrations from 0 μM to 320 μM. 24 h after plating, compounds were added to each well at various concentrations. Following a 24-h incubation, cell viability was measured using a Microplate Reader (PerkinElmer EnSpire) with the CellTiter-Lumi™ Cell Viability Assay kit (Beyotime Biotechnology, C0065L), according to the manufacturer’s instructions.
Quantitative real-time PCR (qRT-PCR)
Cells were harvested and lysed in 1 mL Trizol (Gibco, 15596018), followed by the addition of 0.2 mL CHCl3. The solution was vortexed for 15–30 s and incubated at room temperature for 2–3 min, followed by centrifugation at 12,000 × g for 15 min at 4 °C. After centrifugation, the aqueous phase was transferred into a new 1.5 mL tube, and 0.5 mL isopropanol (IPA) was added. The mixture was then incubated at −80 °C overnight to precipitate the RNA. The RNA pellet was collected by centrifugation at 12,000 × g for 10 min at 4 °C, and the supernatant was discarded. The RNA pellet was washed with cold 75% ethanol and centrifuged at 12,000 × g for 5 min at 4 °C. After removing the supernatant, the RNA pellet was resuspended in 20 μL DEPC-treated water for further experiments. For reverse transcription, 1 μg of total RNA from each sample was reverse transcribed into cDNA using the EasyScript® All-in-One First-Strand cDNA Synthesis SuperMix (TransGen biotech, AE341-02) according to the manufacturer’s instructions. Subsequent qRT-PCR was performed using PerfectStart® Green qPCR SuperMix (TransGen biotech, AQ601-01-V2) on a Bio-Rad CFX96TM or CFX384TM Real-Time system. The Cq values were normalized against ACTB to determine relative gene expression levels. The sequences of all qRT-PCR primers are listed in Supplementary Table 1. For small molecule treatments, 1 × 10⁶ A172 cells, U87 cells, or THP-1 cells pretreated with Phorbol 12-myristate 13-acetate (PMA, 1 ng/mL) were treated with DMSO, 5 μM Osimertinib, or 40 μM CP-24 24 h prior to RNA extraction.
Bulk RNA-seq library preparation
U87 cells were treated with DMSO, 5 μM Osimertinib, or 40 μM CP-24 24 h before RNA extraction. The total RNA from each sample was extracted using Trizol as described previously. RNA-seq libraries were prepared using the VAHTS Universal V6 RNA-seq Library Prep Kit for Illumina® according to the manufacturer’s instructions. In brief, eukaryotic mRNA was enriched using Oligo(dT) magnetic beads, followed by fragmentation, cDNA synthesis, and purification. The purified double-stranded cDNA was subjected to end repair, adaptor ligation, and PCR amplification to generate the cDNA libraries. Sequencing was performed on the Illumina Novaseq Xplus-25B platform.
Bulk RNA-seq data analysis
Raw bulk paired-end RNA-seq data were processed using TrimGalore software (with Cutadapt v1.18) to trim adaptors and the first 10 base pairs of both reads. Alignment to the hg38 reference genome was performed using STAR (version 2.7.10b), and gene expression count matrices were obtained using htseq-count (v2.0.3) with the hg38 RefSeq gene annotation downloaded from the UCSC table browser. The raw count matrix was normalized to 1 million counts per sample, generating a transcripts per million (TPM) data matrix.
Pharmacokinetic analysis of CP-24
The C57BL/6J mice were fasted overnight prior to oral administration of CP-24 at doses of 25 mg/kg or 50 mg/kg. Blood and brain samples were collected at 0 h (before oral administration, as untreated controls), 30 min, 1 hour, 2 h, 4 h, 6 h, 9 h, 12 h, and 24 h after CP-24 administration. For untreated mice, blood was collected from the heart post-euthanasia. For treated mice, blood was collected from the tails into 1.5 mL centrifuge tubes. Blood samples were centrifuged for 15 min at 3000 rpm at 4 °C. The serum was then transferred to a new 1.5 mL centrifuge tube and stored at −80 °C for further analysis. Brain samples from both untreated and treated mice were collected into 2 mL centrifuge tubes after anesthesia and cardiac perfusion with DPBS. The brain tissue was weighed, rapidly frozen in liquid nitrogen, and stored at −80 °C for further analysis.
For UPLC-MS/MS sample preparation, 20 μL of plasma sample was accurately measured and mixed with four volumes of a 0.1% formic acid acetonitrile solution (containing 5 ng/mL of internal standard Nimodipine) for precipitation extraction. The mixture was vortexed for 3 min, and then centrifuged at 13,000 rpm for 10 min at 4 °C. The supernatant was transferred into a clean sample vial for UPLC-MS/MS analysis. Simultaneously, a standard curve was prepared using blank plasma. For brain tissue preparation, 0.1 g of brain tissue was weighed and transferred into a new 2.0 mL centrifuge tube, which was then frozen in liquid nitrogen. Ceramic Beads were added to the tube, and the sample was ground for 5 min using a freezing grinder. After grinding, 1 mL 80% methanol (containing 0.5 ng/mL internal standard Nimodipine) was added for extraction. The mixture was sonicated for 20 min at 4 °C, followed by vortexing for 2 min and centrifugation at 13,000 rpm for 10 min at 4 °C. The supernatant (900 μL) was transferred to a clean 1.5 mL centrifuge tube and spun-dried. Subsequently, 100 μL of 50% methanol/water solution was added to dissolve the pellet. The mixture was vortexed for 3 min, sonicated for 10 min, and centrifuged at 13,000 rpm for 10 min at 4 °C. The supernatant was transferred to a clean sample vial for UPLC-MS/MS detection. A standard curve was prepared using blank brain tissue.
CP-24 concentration was detected using UPLC-MS/MS, equipped with an SCIEX ExionLCTM AD ultra-high performance liquid chromatography system and an SCIEX QTRAP 5500 triple quadrupole tandem linear ion trap mass spectrometer. The analytical column used was a Water ACQUITY UPLC BEH C18 Column (1.7 µm, 2.1 × 50 mm). Mobile phase A consisted of acetonitrile, and mobile phase B was an aqueous solution containing 0.05% formic acid. The flow rate was 0.3 mL/min, with a sample injection volume of 5 µL, and a column temperature maintained at 40 °C. Electrospray ionization (ESI) in positive ion mode was used for detection, employing multiple reaction monitoring (MRM) for the compound of interest. ESI parameters were set as follows: ESI temperature at 500 °C, curtain gas at 30 psi, collision gas at 9 psi, ion voltage at 5500 V, spray gas at 55 psi, and auxiliary heating gas at 55 psi. All data were collected using Analyst Software 1.7.1. The data were analyzed using SCIEX OS 1.6.1 software and the content of the compounds in the samples was quantified based on an internal standard curve.
Mouse tumor models and treatment
For the U87-luciferase xenograft model, U87 cells were transfected with lentivirus to stably express luciferase. 6–8-week-old female NCG mice were used to establish the xenograft model by injecting 1.5 × 10⁵ U87-luciferase cells in 7 μL of DPBS per mouse at a site 2 mm left and 2 mm anterior to the bregma, at a depth of 3 mm. 7 days after injection, in vivo imaging was performed to quantify tumor volume. Mice were injected intraperitoneally with 200 μL of 15 mg/mL D-luciferin sodium (MedChemExpress, HY-12591) in DPBS, followed by imaging using the IVIS Spectrum 3D System (PerkinElmer). The mice were then regrouped to normalize tumor volume across all groups. 10 days post-injection, mice were treated once daily by oral gavage with 10 mg/kg Osimertinib dissolved in 10% DMSO/90% corn oil (MedChemExpress, HY-Y1888), or with vehicle control consisting of 10% DMSO/90% corn oil. Tumor growth was monitored by whole-body bioluminescence using the IVIS Spectrum 3D System after intraperitoneal injection of D-luciferin sodium. Mice were monitored for survival and euthanized if they exhibited severe disease symptoms, including hemiparesis or a loss of more than 20% of body weight.
For the GBM375-luciferase xenograft model, GBM375 cells were transfected with lentivirus to stably express luciferase. 6–8-week-old female NCG mice were used to establish the xenograft model by injecting 5 × 10⁴ GBM375-luciferase cells in 2 μL of DPBS per mouse at a site 2 mm left and 2 mm anterior to the bregma, at a depth of 3 mm. 7 days after injection, in vivo imaging was performed to quantify tumor volume. Mice were injected intraperitoneally with 200 μL of 15 mg/mL D-luciferin sodium in DPBS, followed by imaging using the IVIS Spectrum 3D System. The mice were then regrouped to normalize tumor volume across all groups. Mice were treated with 10 mg/kg Osimertinib or vehicle solution by oral gavage once daily. Tumor growth was monitored by whole-body bioluminescence using the IVIS Spectrum 3D System after intraperitoneal injection of D-luciferin sodium. Mice were monitored for survival and euthanized if they exhibited severe disease symptoms, including hemiparesis or a loss of more than 20% of body weight.
For the GL261-luciferase syngeneic model, GL261 cells were transfected with lentivirus to stably express luciferase. 6–8-week-old female C57BL/6J mice were used to establish the GL261-luciferase xenograft model by injecting 5 × 10⁴ GL261-luciferase cells in 5 μL of DPBS per mouse at a site 2 mm left and 2 mm anterior to the bregma, at a depth of 3 mm. 6 days after injection, in vivo imaging was performed to quantify the tumor volume. Mice were injected intraperitoneally with 200 μL of 15 mg/mL D-luciferin sodium in DPBS, followed by imaging using the IVIS Spectrum 3D System. Mice were then regrouped to normalize tumor volume across groups. 7 days post-injection, mice were treated with 10 mg/kg Osimertinib or vehicle solution by oral gavage once daily. Tumor growth was monitored by whole-body bioluminescence using the IVIS Spectrum 3D System after intraperitoneal injection of D-luciferin sodium. Mice were monitored for survival and euthanized if they developed severe symptoms, such as hemiparesis or a loss of more than 20% of body weight. For the tumor rechallenge experiment, 5 × 10⁴ GL261-luciferase cells in 5 μL of DPBS were injected into the brain 28 weeks after achieving tumor-free status. The injection site was 2 mm right and 2 mm anterior to the bregma, at a depth of 3 mm. 4 h post-injection (as Day 0), and on days 6 and 14 post-injection, in vivo imaging was performed to quantify tumor volume.
Cell isolation and flow cytometry cell sorting (FACS)
After two weeks of 10 mg/kg Osimertinib or vehicle treatment in the GL261-luciferase syngeneic model (as described above), or after two days following tumor rechallenge in tumor-free mice (as described above), peripheral blood was collected into lithium heparin anticoagulant tubes (Solarbio, YA1481-1pk). Red blood cells were lysed using ACK Lysis Buffer (LEAGENE, CS0001) and then samples were centrifuged at 300 × g for 5 min. The resulting cell pellets were washed with cold DPBS and centrifuged at 300 × g for 5 min. The cells were resuspended in FACS buffer (DPBS supplemented with 10% FBS) for subsequent antibody incubation. For isolation of tumor-infiltrating immune cells, five mice per group were euthanized following two weeks of treatment with 10 mg/kg Osimertinib or vehicle. The brain tumors were dissected under a stereo microscope and homogenized using an enzymatic solution (Hanks’ Balanced Salt Solution (HBSS) with Ca2+ and Mg2+(Beyotime, C0219) supplemented with 1.5 mg/mL collagenase IV (Macklin, C909791-100mg) and 200 U/mL DNase I (Beyotime, D7076)) at 37 °C for 30 min with mechanical tissue disaggregation. The enzymatic digestion was stopped by adding HBSS, followed by centrifugation at 300 × g for 5 min. The cells were resuspended in Accutase (Thermo Fisher Scientific, 00-4555-56) for 10 min to further dissociate them into single cells. Digestion was neutralized with HBSS, followed by centrifugation at 300 × g for 5 min. The cell pellets were resuspended in FACS buffer for antibody incubation. For flow cytometry, the cell suspensions were incubated with fluorescent dye–conjugated antibodies against CD45 (BioLegend, 103106), CD4 (BioLegend, 100406, 100516), CD8a (BioLegend, 100712), CD3 (BioLegend, 100222), CD19 (BioLegend, 115506), NK1.1 (BioLegend, 108710), CD11b (BioLegend, 101216), CD80 (BioLegend, 104705), MHC II (BioLegend, 107614), CD279 (BioLegend, 109110), CD44 (BioLegend, 156008), CD62L (BioLegend, 161214), and DAPI for 30 min on ice, followed by centrifugation at 300 × g for 5 min. The cells were washed with cold DPBS and resuspended in FACS buffer for analysis. Flow cytometry was performed on a BD FACSAria™ III Cell Sorter (BD Biosciences), and the data were analyzed using FlowJo software (version 10.4). The isolated cells were used for quantitative assays or western blot analysis.
Statistical analysis
Experiments in this study were conducted with at least three biological replicates, unless otherwise specified. All statistical analyses were performed with GraphPad Prism 10 software or Python v3.9.13. General statistical analyses were carried out using a one-sided or two-sided t-test for data with normal distribution and equal variances. The Log-rank test was applied for survival analysis. All tests were applied to make inferences at a 95% confidence interval, unless otherwise specified. The statistical tests used and their corresponding P-values are indicated in the figure legends. The significance levels are indicated in the figures and are denoted as follows: *P < 0.05; **P < 0.01; ***P < 0.001; ****P < 0.0001; ns no significance.
