


Mice
C57BL/6J mice were purchased from Sankyo Laboratory Service Corporation (Tokyo, Japan). Mice were housed under specific pathogen-free conditions at 23 ± 2 °C and 50 ± 10% relative humidity with a 12 h light/dark cycle and free access to water and radiation-sterilized diet products CE-2 diet (CLEA Japan, Tokyo, Japan). Male mice aged 8 weeks were used unless otherwise stated. Mice were acclimatized for at least 7 days before experimental procedures. Mice were assigned to experimental groups randomly. All mouse experiments were approved by the Institutional Animal Care and Use Committee of the Institute of Science Tokyo and were performed in accordance with relevant institutional guidelines and regulations.
Plasmids and hydrodynamic tail vein injection (HTVi)
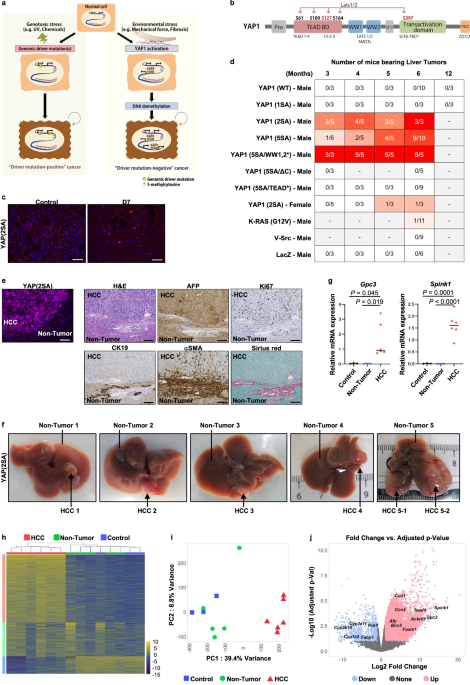
For hydrodynamic injection, plasmids (20 µg) were diluted in TransIT-EE Hydrodynamic Delivery Solution (Mirus Bio, Madison, WI, USA) to a volume equivalent to 10% of the mouse’s body weight and injected into the tail vein within 5–6 seconds (s) as previously described69. Plasmids utilized in this study were: pLIVE-Myc-YAP1 (WT), pLIVE-Myc-YAP1 (1SA: S127A), pLIVE-Myc-YAP1 (2SA: S127A, S397A), pLIVE-Myc-YAP1 (5SA: S61, 109, 127, 164, 397A), pLIVE-Myc-YAP1 (5SA/WW1, 2*), pLIVE-Myc-YAP1 (5SA/ΔC), pLIVE-Myc-YAP1 (5SA/TEAD*), pLIVE-Myc-KRAS(G12V), pLIVE-Myc-v-Src, and pLIVE-Empty. All plasmids used in this study were generated in-house using standard molecular cloning techniques. The series of YAP1 mutant plasmids, including the 5SA variant and its derivatives, has been described previously69.
TET1 knockdown using shRNA
To perform Tet1 knockdown in mouse liver, we utilized a vector based on recombinant adeno-associated virus serotype 8 (AAV8) (pAAV-CBH-tRFP-shTet1; VectorBuilder). This vector encodes four distinct miR30-based shRNAs targeting Tet1 (the specific targeting sequences are listed in Supplementary Data 20) plus a TurboRFP reporter under the control of the ubiquitously expressed chromatin opening element (CBh) promoter. C57BL/6J mice (8 weeks old) were injected intravenously via the tail vein with 1 × 10¹¹ genome copies (GC) of the viral particles. At 2 weeks post-infection, 40 µg pLIVE-Myc-YAP1(2SA) plasmid was delivered to the liver via HTVi. At 4M post-plasmid injection, livers were harvested and numbers of macroscopic tumors and tumor nodules were counted to assess tumor burden.
Paraffin histology and immunohistochemistry
Mouse livers were fixed in 4% paraformaldehyde (PFA) for 24 h, processed through an automated tissue processor (Excelsior ES, Thermo Fisher Scientific, Waltham, MA, USA), and embedded in paraffin. Sections (5 µm) were stained with hematoxylin and eosin (H&E) or Picro-Sirius Red using standard methods. For immunohistochemistry (IHC), deparaffinized sections underwent heat-induced antigen retrieval, and endogenous peroxidases were quenched with 0.3% H₂O₂. After blocking with 2.5% normal horse serum, sections were incubated with primary antibodies overnight at 4 °C. For chromogenic detection, sections were subsequently incubated with HRP-conjugated secondary antibodies, and signals were developed using an ABC-HRP kit (Vector Laboratories, Newark, CA, USA) and DAB reagent (Sigma-Aldrich, St. Louis, MO, USA). For fluorescent detection, sections were incubated with appropriate fluorophore-conjugated secondary antibodies and counterstained with DAPI. Antibodies used for IHC are listed in Supplementary Data 21.
Cryosectioning and immunofluorescence
For immunofluorescence (IF), livers were fixed in 4% PFA for 24 h and cryoprotected in 30% sucrose before embedding in O.C.T. compound (Sakura Finetek, Tokyo, Japan). Cryosections (10 µm) were permeabilized and blocked using 0.1% Triton X-100 and 5% BSA in TBS. Sections were incubated with primary antibodies overnight at 4 °C, followed by incubation with fluorophore-conjugated secondary antibodies and DAPI (nuclear counterstaining). All sections were imaged using a BZ-X710 fluorescence microscope (Keyence, Osaka, Japan). Antibodies used for IF are listed in Supplementary Data 21.
Quantitative real-time PCR (qPCR)
qPCR was performed as previously described70. Briefly, total RNA was extracted using Trizol Reagent (Invitrogen, Carlsbad, CA, USA) and the RNeasy Mini Kit (QIAGEN, Hilden, Germany). cDNA was synthesized with ReverTra Ace qPCR RT Master Mix (Toyobo, Osaka, Japan). qPCR was performed using THUNDERBIRD SYBR qPCR Mix (Toyobo, Osaka, Japan) on a CFX96 Real-Time System (Bio-Rad, Hercules, CA, USA). Thermal cycling conditions were 95 °C for 30 s, followed by 40 cycles of 95°C for 5 s and 60 °C for 30 s. All primer sequences are listed in Supplementary Data 22.
Western blotting
Western blotting was performed as previously described71. Briefly, total protein was extracted using a lysis buffer [50 mM Tris-HCl (pH 7.5), 150 mM NaCl, 1 mM EDTA, 1% Triton X-100, 0.5% sodium deoxycholate, 0.1% SDS, and protease/phosphatase inhibitors]. Tissue samples were homogenized with a POLYTRON homogenizer, and protein concentrations were determined using a BCA Protein Assay Kit (Thermo Fisher Scientific, Waltham, MA, USA). Equal amounts of protein (5 µg) were separated by 8% or 10% SDS-PAGE and transferred to polyvinylidene difluoride (PVDF) membranes (Merck Millipore, Burlington, MA, USA). Membranes were blocked with Blocking ONE (Nacalai Tesque, Kyoto, Japan) for 1 h and then incubated overnight at 4 °C with the following primary antibodies: anti-Tet1 (1:500; Abcam, Cambridge, UK, ab191698) and anti-GAPDH (1:5000; Millipore, Burlington, MA, USA, MAB374). After washing with TBS, membranes were incubated for 1 h with HRP-conjugated secondary antibodies (anti-rabbit, 1:1000, Amersham, Buckinghamshire, UK; anti-mouse, 1:3000, Millipore, Burlington, MA, USA) and developed using West Pico or West Femto chemiluminescent substrates (Thermo Fisher Scientific, Waltham, MA, USA). Signals were acquired with a ChemiDoc MP system (Bio-Rad, Hercules, CA, USA), and band intensities were quantified using ImageJ software (v1.54g, National Institutes of Health, Bethesda, MD, USA).
RNA-seq
Total RNA was extracted using RNeasy Mini Kits (QIAGEN, Hilden, Germany) according to the manufacturer’s instructions. RNA-sequencing analysis was entrusted to Takara Bio Inc. (Shiga, Japan). The SMART-Seq v4 Ultra Low Input RNA Kit for Sequencing (Clontech, Mountain View, CA, USA), Nextera XT DNA Library Prep Kit (Illumina), and Nextera XT Index Kit v2 (Illumina, San Diego, CA, USA) were used to amplify double-stranded cDNAs and prepare the sequencing library. RNA-seq was performed using a NovaSeq 6000 instrument plus NovaSeq Control Software v1.6.0, Real Time Analysis (RTA) v3.4.4, and Bcl2fastq2 v2.20. Sequence data were analyzed using the DRAGEN Bio-IT Platform v3.6.3 (Illumina) with GRCm38 Release m25 as the reference sequence. Analysis of differentially expressed genes was performed using scores of transcripts per million (TPM).
Differential gene expression and pathway analysis
Further analysis of RNA-seq data was performed using v1.1 of iDEP (integrated Differential Expression and Pathway), a web-based tool from South Dakota State University (Brookings, SD, USA), as previously described72. Expression data, quantified as TPM, were log₂-transformed and normalized. Differentially expressed genes (DEGs) were identified based on a threshold of P < 0.05 and a log₂ fold change (FC) ≥ 1, and were visualized using principal component analysis (PCA) and volcano plots. Following hierarchical clustering of DEGs, functional enrichment analysis was conducted using the KEGG, Reactome, and Gene Ontology (GO) databases. A heatmap of the identified DEGs was generated using R (v4.4.2).
Pathway and gene ontology enrichment analysis
Over-representation analysis was performed on the gene lists from each experimental group to identify functionally enriched pathways and GO terms. The analysis was conducted using the Python library gseapy (v1.1.8) against the KEGG (v2016), GO Biological Process (v2018), and Reactome (v2016) pathway databases. Pathways or terms with a Benjamini–Hochberg adjusted P value < 0.05 were considered significantly enriched. For visualization, the top 10 entries from each group, ranked by the ‘Combined Score’, were selected. These results were illustrated as bubble plots generated with seaborn (v0.13.2) and Matplotlib (v3.9.2).
Whole exome sequencing (WES)
Genomic DNA was extracted using the NucleoSpin Tissue Kit (Macherey-Nagel, Düren, Germany). WES library preparation was performed by Takara Bio Inc. (Shiga, Japan) using the Twist Mouse Exome Panel and associated library preparation kits (Twist Bioscience, South San Francisco, CA, USA). Sequencing was performed on a NovaSeq 6000 system (Illumina). For analysis, reads were mapped to the mouse reference genome (GRCm38/mm25) and processed using the DRAGEN Bio-IT Platform (Illumina, San Diego, CA, USA). Somatic mutations (SNVs and indels) were identified through a comparative analysis of tumor vs. normal liver tissues.
Gene list overlap analysis
Pairwise intersections among gene lists were quantified using a Python (v3.12.3, Python Software Foundation, Wilmington, DE, USA) script with the pandas library (v2.2.2), following a case-insensitive conversion of gene names. The resulting intersection matrix was visualized as a heatmap using seaborn (v0.13.2) and Matplotlib (v3.9.2). The color scale was logarithmically transformed to accommodate a wide range of values, and each cell was annotated with the overlap count. For single-gene overlaps, the gene name was also specified. Non-coding somatic variants with a tumor allele frequency (TAF) > 0.03 were extracted from WES data and compared with nine WES-assessable non-coding exonic driver candidate elements reported by Rheinbay et al.4. Overlap counts were summarized for each tumor sample and candidate element.
RRBS preparation and sequencing
RRBS analysis was entrusted to Takara Bio Inc. (Shiga, Japan) and Active Motif Inc. (Carlsbad, CA, USA). Briefly, genomic DNA (100 ng) was digested with TaqI (New England Biolabs, Ipswich, MA, USA, R0149) at 65 °C for 2 h followed by digestion with MspI (New England Biolabs, R0106) at 37 °C overnight. Following enzymatic digestion, samples were employed for library generation using the Ovation RRBS Methyl-Seq System (Tecan, Männedorf, Switzerland, 0353-32) following manufacturer’s instructions. Digested DNA was randomly ligated, and, following fragment end repair, bisulfite-converted using the EpiTect Fast DNA Bisulfite Kit (Qiagen, Hilden, Germany, 59824) following the manufacturer’s protocol. After conversion and clean-up, samples were amplified using the Ovation RRBS Methyl-Seq System protocol for library amplification and purification. Libraries were measured using the Agilent 2200 TapeStation System (Agilent, Santa Clara, CA, USA) and quantified using Nanodrop 2000c (Thermo Fisher Scientific, Waltham, MA, USA). Libraries were sequenced on a NovaSeq 6000 instrument (Illumina, San Diego, CA, USA) to generate 75-bp single-end reads.
DNA methylation analysis
The Illumina adapter sequence was trimmed from the single-end 75 bp reads generated above using Trim Galore (Babraham Institute, Cambridge, UK), followed by custom trimming of library-specific bases. Reads were mapped to the genome using Bismark (version 0.23.0, Babraham Institute, Cambridge, UK) with strict parameters (-N 0, -L 20). PCR duplicates were removed by retaining a single representative read among those with identical mapping coordinates and randomized 6-mer barcodes. Alignment information of the remaining reads was stored in BAM files. Methylation at CpG sites was extracted using Bismark (version 0.23.0) and saved in CpG report format.
Differential methylation analysis and annotation
CpG report files generated by Bismark as above were used to identify “Differentially Methylated Cytosines” (DMCs) between two sample groups (e.g., Non-Tumor vs. Tumor). First, all CpG sites with a minimum read coverage of 10x in at least two samples were consolidated into a union site list for subsequent statistical testing. Differential methylation at each CpG site was assessed using a Generalized Linear Model (GLM) with a binomial error structure. This model was applied to the counts of methylated and unmethylated reads, with the Non-Tumor or HCC status set as the explanatory variable. The resulting P-values were adjusted using the Benjamini–Hochberg method to control the False Discovery Rate (FDR). A CpG site was classified as a DMC if it met two strict criteria: (1) a q-value less than 0.01, and (2) an absolute methylation difference between the groups of ≧20%. The overall distribution of the q-values and methylation differences across the genome was visualized in a Manhattan-style plot. DMCs were mapped to corresponding gene symbols using org.Mm.eg.db.
Visium HD library preparation and sequencing
Visium HD sample preparation was performed on FFPE liver sections with a DV200 value > 90% (where DV200 is the percentage of RNA fragments >200 nucleotides) according to the manufacturer’s protocol (10x Genomics, Pleasanton, CA, USA, CG000684). Sections (5 µm) were stained with anti-ATP1A1 antibody (Abcam, Cambridge, UK, ab76020) and DAPI before immunofluorescence imaging on a BZ-X710 microscope (Keyence, Osaka, Japan). Following imaging, tissue sections were transferred to Visium HD slides using a CytAssist instrument (10x Genomics). Libraries were prepared and subsequently sequenced on an AVITI platform (Element Biosciences, San Diego, CA, USA).
Visium HD data processing and analysis
Raw sequencing data were processed using Space Ranger (10× Genomics, Pleasanton, CA, USA) with the mm10-2020-A reference genome, and the output was converted to Zarr format via spatialdata-io (v0.1.dev815+g70f5060). Individual cells were segmented as regions of interest (ROIs) using Cellpose (v3.1.1.1, Janelia Research Campus, Ashburn, VA, USA) with pretrained models, which defined cell boundaries based on ATP1a1 immunofluorescence and nuclei based on DAPI staining. To precisely define the cell boundaries within the regions encompassing both HCC lesions and surrounding tissue, 12,094 cell contours were subsequently manually annotated. These ROI geometries were integrated into a SpatialData object (v0.3.1.dev17+gc2136b3). Gene expression was subsequently aggregated within each ROI boundary to quantify total transcript abundance per cell, with processing accelerated through parallel computing (n_jobs = 20). Individual sample datasets were concatenated into a single AnnData object, preserving sample identity via library keys. Standard quality control was performed, filtering out cells with fewer than 50 genes and genes detected in fewer than 100 cells.
To mitigate technical artifacts from sample preparation and sequencing, batch effects were corrected using the scVI model (v1.3.0, University of California, Berkeley, CA, USA). The model was configured with a variational autoencoder architecture (2 hidden layers, 10 latent dimensions) and a negative binomial gene likelihood, enabling simultaneous batch correction and low-dimensional representation learning. A neighborhood graph (k = 5 neighbors) was constructed from the batch-corrected scVI latent representations. This graph was used for cell clustering via the Leiden algorithm (resolution=0.5) and for visualization with UMAP (minimum distance=0.1). Cell types were subsequently identified through manual curation based on canonical marker gene expression. This process identified the following primary cell populations: hepatocytes (6 subtypes), liver sinusoidal endothelial cells (LSECs), Kupffer cells, lymphocytes, cholangiocytes, stellate cells/fibroblasts, HCC areas, and border regions.
To investigate heterogeneity within the malignant regions, a focused sub-analysis was performed on annotated HCC areas. Iterative Leiden clustering (resolution=0.3) was applied to further subdivide these cell populations, identifying four distinct HCC subtypes that were designated Cluster 01 through Cluster 04.
Region-specific inference of cell-cell communication using CellChat
“Cell-Cell Communication Analysis” intercellular communication networks within the HCC TME were inferred using the R package CellChat (version 1.6.1)49 on R version 4.5.0. To define “Regions of Interest” and “Cell Groups”, we analyzed spatial transcriptomics data from a control mouse liver and an HCC-bearing liver. Four regions were defined: (1) Control; (2) Non-tumor area (normal region in HCC-bearing 4M liver); (3) Border area (tumor interface region); and (4) HCC area (tumor core). Separate CellChat objects were constructed for each region. To ensure robust analysis, raw gene expression data were normalized using library size normalization followed by logarithmic transformation (using the normalizeData function). Cells were grouped based on detailed annotations, with T cells and B cells merged into a single “Lymphocytes” group. The mouse database (CellChatDB.mouse) was utilized, targeting the “Secreted Signaling”, “ECM-Receptor”, and “Cell-Cell Contact” pathways. Overexpressed genes and interactions were identified using standard CellChat functions. To characterize region-specific signaling signatures, ligand-receptor pairs were ranked by their maximum communication probability within each functional category. The top 20 interactions for “Secreted Signaling,” “ECM-Receptor,” and “Cell-Cell Contact” were extracted and visualized as bar plots. The total interaction strength was computed using the aggregateNet function to aggregate probabilities across all ligand-receptor pairs. Visualizations were generated using the netVisual_circle function and ggplot2. To facilitate direct quantitative comparison across regions, visualization parameters—such as bar lengths and edge widths in aggregated circle plots—were unified based on the global maximum values observed across all four groups. For visualizations of individual ligand-receptor pairs, edge widths were scaled relative to the maximum communication probability specific to that pair across all samples.
FALD single-cell RNA-seq analysis
We re-analyzed a public single-cell RNA sequencing dataset (GSE223843) comprising two control liver samples (Control 1: GSM6997741; Control 3: GSM6997744) and four FALD samples (Fontan 1: GSM6997746; Fontan 2: GSM6997748; Fontan 3: GSM6997750; Fontan 4: GSM6997752). Raw data were processed using Seurat, filtering out low-quality cells (>5% mitochondrial reads, <300 detected genes, or UMIs outside 800–20,000). Unsupervised clustering classified all cells into 12 distinct clusters based on gene expression profiles. Hepatocytes were identified based on positive marker expression and the absence of non-parenchymal cell markers (e.g., those of immune cells, fibroblasts, or endothelial cells). Accordingly, nine clusters (Clusters 0, 1, 2, 3, 5, 7, 8, 9, and 11) were extracted for downstream analysis. To identify robust transcriptomic changes associated with FALD, extracted hepatocytes were split by experimental condition (Control vs. FALD) and integrated using Canonical Correlation Analysis (CCA) in Seurat v4. Module scores for TET1 and specific DNA demethylation target gene signatures were calculated using the AddModuleScore function.
TCGA data analysis
Analyses of TCGA RNA expression, correlation and overall survival data were performed with GEPIA2. Spearman’s correlation coefficient analysis was used to calculate gene expression relationships between target genes.
Statistical analyses
Analyses of statistical significance were performed using GraphPad Prism 8 (GraphPad Software, San Diego, CA, USA). Student’s t test was used for comparisons between 2 groups. One-way analysis of variance (ANOVA) was used for comparisons among 3 or more groups. Two-way ANOVA was used for 2-factor analysis. Data were considered statistically significant at P < 0.05.
Reporting summary
Further information on research design is available in the Nature Portfolio Reporting Summary linked to this article.
