


Patient samples
Fresh-frozen primary tumor tissues and paired formalin-fixed paraffin-embedded (FFPE) blocks from 180 patients diagnosed with EOC between 1993 and 2018 were obtained from the tumor biobank at the Sahlgrenska University Hospital, Department of Oncology (Gothenburg, Sweden). Inclusion criteria were primary tumor tissue samples originating from ovarian or fallopian tube epithelium and to be diagnosed with one of the EOC histotypes after reclassification. LGSC patients were excluded from this study as the total number of cases found was deemed insufficient for subsequent analysis. Clinicopathologic data were retrieved from the Swedish Quality Register for Gynecological Cancer National Quality Registry at the Regional Cancer Center West (Gothenburg, Sweden) and the Cancer Registry at the National Board of Health and Welfare (Stockholm, Sweden). Stage upon diagnosis was determined using the International Federation of Gynecology and Obstetrics (FIGO) guidelines, and the tumor specimens were reclassified according to the 2020 World Health Organization guidelines by a board-certified pathologist at Sahlgrenska University Hospital using the FFPE material from the same primary tumor as the fresh-frozen sample used for each patient to run on the LC-MS system. If FFPE material was not available for a patient, the frozen tissue was subjected to formalin fixation, paraffin embedding, and hematoxylin and eosin staining for reclassification. All procedures were performed in accordance with the Declaration of Helsinki and approved by the Regional Ethical Review Board (Gothenburg, Sweden; case numbers 767-14 and 201-15, and complementary case numbers T973-15 and T333-16). The Regional Ethical Review Board approved a waiver of written consent to use the tumor specimens due to the retrospective study design.
Sample preparation
Fresh-frozen tissue pieces (8 mm3) containing at least 60% neoplastic cells assessed with May-Grünwald Giemsa stainings by a board-certified pathologist were homogenized in 2% sodium dodecyl sulfate and 50 mM triethylammonium bicarbonate (TEAB) using a Covaris ML230 ultrasonicator, and protein content was determined with bicinchronic acid (BCA) using the Pierce BCA Protein Assay Kit (ThermoFisher Scientific). A total of 150 µg bulk protein per sample was transferred into a 96-well KingFisher plate. The volume was adjusted to 150 µL using lysis buffer (100 mM TEAB, 2% SDS) with an Opentrons OT-2 liquid handler. In total, 150 µL of 2× reduction/alkylation buffer was added to each sample, followed by incubation at 95 °C for 15 min to ensure complete disulfide reduction and alkylation. Protein binding was performed by adding 700 µL of acetonitrile and 300 µg of MagReSyn Hydroxyl beads (Resyn Biosciences) directly to the sample plate. Protein aggregation capture (PAC) and digestion were automated on a KingFisher™ Flex system using dedicated reagent plates containing digestion enzymes (Lys-C 1:500, w/w, Thermo Fisher; and trypsin 1:250, w/w, Promega) and wash buffers. Following digestion and acidification, the samples were prepared for desalting using Oasis HLB Prime 96-well plates (Waters). Plates were conditioned with 100% acetonitrile, equilibrated with 0.1% TFA, and the samples were loaded in three times to maximize peptide retention. After washing with 0.1% TFA, peptides were eluted using 60% acetonitrile, 5% TFA, and 0.1 M glycolic acid, and collected into a PCR plate for storage at −80 °C.
Phosphopeptide enrichment
Phosphopeptides were enriched using MagReSyn Zr-IMAC HP beads (Resyn Biosciences) on the KingFisher system. Beads were used at a mass ratio of at least 2:1 (beads:peptide). Peptides were mixed with binding solvent containing 100% acetonitrile, 5% TFA, and 0.1 M glycolic acid. Wash steps included two buffers: Wash 1 (80% acetonitrile, 1% TFA) and Wash 2 (10% acetonitrile, 0.2% TFA). Elution was performed with 1% aqueous ammonia (pH 10–11), and eluates were immediately frozen at −80 °C.
Liquid chromatography-mass spectrometry and identification
Phosphopeptides were analyzed on an Evosep One LC system (Whisper zoom mode 40SPD, 32-minute method) coupled to a Thermo Q Exactive HF-X Orbitrap mass spectrometer via electrospray ionization in a randomized order. Data were acquired in data-independent acquisition (DIA) mode using Xcalibur software. Full MS scans were acquired at a resolution of 120,000 over an m/z range of 350–1400, with an AGC target of 3 × 10⁶ and a maximum injection time of 25 ms. MS2 scans were recorded at 15,000 resolution using 50 staggered DIA windows of 13.7 m/z, with normalized collision energy (NCE) set to 27. Fragmentation spectra were acquired in centroid mode under positive ionization. Identification was done in DIA-NN (2.2.0). With randomized pooled samples, an in-silico spectral library was first generated using a reviewed UniProt database (Swissprot, February 2025, 20,504 entries) with deep learning-based spectra, RTs and Ims prediction and contaminants enabled and generic scoring, and set to include contaminants. Library searching was conducted with Trypsin/P as protease with maximum one missed cleavage, and N-terminal methionine excision was enabled and cysteine carbamidomethylation set as fixed modification. STY was set as variable modifications maximum number of variable modifications set to 2. Sample intensities were normalized with RT-dependent cross-run normalization and match between runs (MBR) was enabled to adjust for sample-to-sample variations and batch effects.
Data pre-processing
All subsequent analyses were conducted using R (v. 4.5.1) unless otherwise stated. Site-centric data were generated from the parquet files generated by DIA-NN. Phosphosites were filtered for ≥ 0.75 localization probability score. A filtering threshold of 0.01 was applied for global q-value, peptidoform q-value, and global peptidoform q-value. Filtered phosphosites were merged with intensities for each precursor mapping to the same site. To generate one intensity for each unique phosphosite, aggregation of precursors was done by averaging their normalized intensity scores for each site. Phopshosites were filtered for quantitative values in at least 30% of samples in at least one histotype-stage group. Remaining missing values were imputed by replacing them with the lowest detected intensity across all samples for respective phosphosite, and then log2(n + 1)-transformed.
Differential abundance analysis
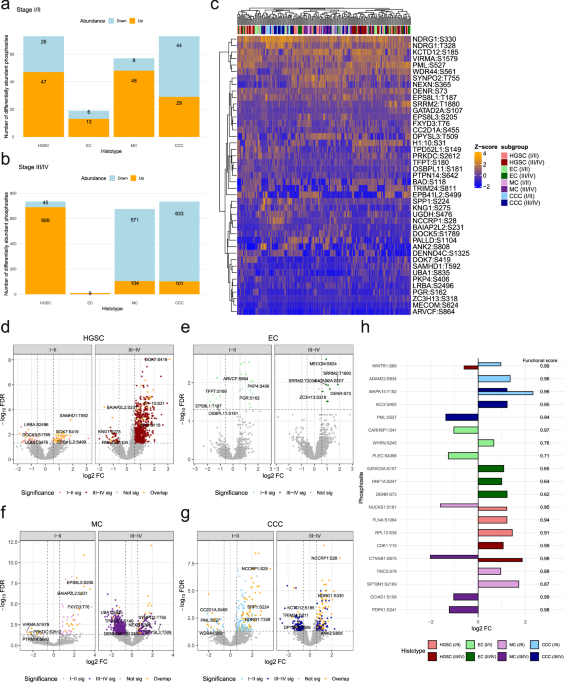
Differentially phosphorylated sites were generated using NormalyzerDE (v. 1.26.0) with the limma method with minimum number of replicates set to 3, and Benjamini-Hochberg to acquire FDR-adjusted p-values. Abundances between histotypes were examined by contrasting one histotype to the others combined for early- and advanced stage samples separately. A site was deemed significantly deregulated at thresholds FDR ≤ 0.05 and FC ≥ |1.5 | . The p-values were obtained from two-sided empirical Bayes moderated t-tests. This analysis was repeated using the proteomics data. An additional differential abundance analysis was performed where the phosphosite intensities were adjusted by protein levels using proteomics data from a previous experiment using lysates from the same patients. Here, the phosphosite intensity was divided by the intensity of the corresponding protein for each sample. The proteomics data were searched with DIA-NN (2.2.0) using the same FASTA library for in-silico library generation and normalization settings as for the phosphoproteomics data, except for setting no variable modifications for proteomics data.
Enrichment analysis
Gene set enrichment analysis (GSEA) was performed by taking the average intensities of all phosphosites mapping to the same gene for each sample. Using clusterProfiler (v. 4.16.0), enrichment of the gene ontology (GO) biological processes (BP) and Reactome databases from MsigDB were conducted on genes ranked from highest to lowest ratio of the following formula31:
$$-\log 10({\rm{FDR}})/{\rm{sign}}(\log 2{\rm{FC}})$$
where FDR and log2 FC were derived from the differential abundance analysis. The sign of log2 FC is defined as 1 if above 0, and -1 if below 0. Significance threshold for enrichment was Benjamini-Hochberg adjusted p-value < 0.20.
Post-translational modification signature enrichment analysis (PTM-SEA) was done with ssGSEA (v. 1.0.0) using the PTM signature database (ptm.sig.db.KINASE.flanking.human.v2.0.0.gmt) curated at Broad Institute, which incorporates PhosphoSitePlus (PSP) and in vitro kinase-to-phosphosite database (iKiP-DB)22. The enrichment was performed setting weight as 0.75, correlation type as rank, “area.under.RES” as statistic, number of permutations 500, and global FDR to false. Significance thresholds were set to FDR < 0.01 and a minimum signature set overlap of 10%.
Functional analysis
Predicting the functional scores of phosphosites was done by employing the machine learning pipeline established by Ochoa et al., where all identified phosphosites with a localization probability ≥ 0.75 from this study were used as reference and funscoR (v. 0.1.0) for model training and functional score prediction for S, T, and Y phosphosites30.
Validation with external data
Comparison of phosphosite in abundance in tumor and normal tissue was done by utilizing publicly available data on The Cancer Proteogenomic Data Analysis Site (cProSite), curated by National Cancer Institute’s Clinical Proteomic Tumor Analysis Consortium (CPTAC) and National Cancer Institute’s International Cancer Proteogenome Consortium (ICPC)45. Their web-based platform was used to search for comparisons of phosphosites between tumor and adjacent normal tissue in ovarian cancer by setting the chosen tumor type as ovarian cancer, dataset as phosphorylation site, analysis as tumor vs normal tissue, and gene as the given phosphorylated protein. Unpaired t-tests, fold changes, and boxplots were then extracted after choosing the phosphosite to be validated. This was performed for the three phosphosites of highest functional score in each histotype and stage group.
Survival analysis
Multivariate Cox regression for overall survival was performed for each histotype across both stage groups by generating Cox proportional hazard (PH) models adjusted for age at diagnosis and stage using the coxph-function in survival (v. 3.8-3). From the models, hazard ratio (HR), confidence interval (CI) for HR, FDR (Benjamini-Hochberg adjusted), and concordance index (C-index) were obtained. Overall survival was defined as the time between date of diagnosis and death by any cause. The p-values were acquired using Wald tests. This was performed for all phosphosites post-filtering, where Cox PH models were generated for all sites and covariates for those selected using least absolute shrinkage and selection operator (LASSO) using glmnet (v. 4.1-10) with alpha = 1. Robustness of survival models was assessed by bootstrapping the survival data for 1000 iterations, generating a bootstrap-adjusted p-value. This analysis was repeated using clinical data and proteomics data published by Qian et al. 32 for progression-free survival analysis, where the date of relapse was defined as the event. P-values from log-rank tests were estimated for all phosphosites significantly associated with survival based on the Cox PH models (FDR ≤ 0.05, bootstrap p-value ≤ 0.20, HR ≠ 1 and CI not spanning 1), where log2-tranformed intensities were dichotomized based on median abundance for the specific histotype stage-group. This methodology was used to construct Kaplan-Meier plots.
Visualizations
Principal component analysis (PCA) plots, volcano plots, barplots, dotplots, and Kaplan-Meier curves were custom designed using ggplot2 (v. 3.5.2). Heatmaps were constructed with ComplexHeatmap (v. 2.24.1) using Euclidean distance for unsupervised clustering.
