


Mice
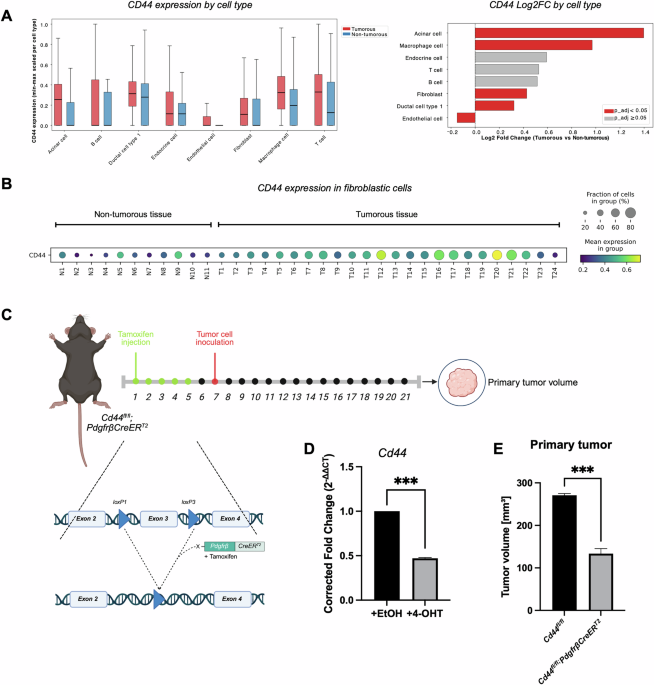
B6.Cg-Tg(Pdgfrb-cre/ERT2)6096Rha/J mice [26] were crossed with C57BL/6-TgCd44-[exon3]flox/flox mice to generate the Cd44flox/floxPdgfrb-CreERT2 (Cd44fl/fl;PdgfrβCreERT2) mouse line. The resulting line was used for PDGFRβ+ cell-specific Cd44 knockout experiments. For in vivo purposes, only male mice (6 to 10 weeks old) were subjected to experiments. No randomization and no blinding were conducted. All animals were housed and maintained in facilities approved by the Regierungspräsidium Karlsruhe (Germany) under specific pathogen-free conditions and were handled according to EU directives for animal experimentation. The experiments were authorized by the Regierungspräsidium (35-9185.81/G-10/19) and termination criteria were approved.
Cell lines
FC1245 cells were kindly gifted by Dr. Dave Tuveson (Cold Spring Harbor Laboratory, Cold Spring Harbor, NY, USA). HEK293T cells were obtained from ATCC (Wesel, Germany) and imPSCs were obtained from Associated Prof. Mathison and Prof. Urrutia (Medical College of Wisconsin, Milwaukee, WI, USA) [27]. These cell lines were cultured in DMEM containing GlutaMAX supplement (Gibco, Thermo Fisher Scientific, Waltham, MA, USA) and 10% fetal bovine serum (FBS, Gibco) as well as 1% Pen/Strep (P/S, Gibco). Human pancreatic CAFs were obtained from Vitro Biopharma (Denver, CO, USA) and were cultured in MSC-GRO™ Pancreatic CAF Maintenance Medium (Vitro Biopharma, Inc., Denver, CO, USA) with 1% P/S. DC2.4 cells were obtained from Merck (Darmstadt, Germany) and were cultured in RPMI-1640 (Gibco, 10% FBS, 1% GlutaMAX supplement, 10% 1 M HEPES, 0.1% β-mercaptoethanol, 1% non-essential amino acids, 1% P/S). Cell lines were tested regularly for mycoplasma contamination.
Orthotopic PDAC cell implantation
Six- to ten-week-old Cd44fl/fl;PdgfrβCreERT2 or control mice were injected intraperitoneally with 20 mg/ml of Tamoxifen (Sigma-Aldrich, Merck, Darmstadt, Germany) dissolved in peanut oil, once per day for 5 days. At day seven, 4.5 × 10⁴/ 30 µl FC1245 cells in sterile PBS (Gibco) were injected into the pancreas of the mice. Animals were sacrificed 14 days after tumor cell inoculation, and tumors were excised and measured using an electronic caliper. The volume was calculated using the following formula: volume = length x width x height x 0.5 (mm3).
Isolation of fibroblasts from the pancreas of Cd44
fl/fl
;PdgfrβCreER
T2 mice
Fibroblasts from the pancreas of Cd44fl/fl;PdgfrβCreERT2 mice were isolated using a protocol modified from Waise and colleagues [61]. Mice were sacrificed and the pancreas was excised. Single-cell suspensions were established using the Miltenyi MACS® mouse tumor dissociation kit (Miltenyi Biotec, Bergisch Gladbach, Germany) according to the manufacturer’s protocol. Single cells were collected by centrifugation and red blood cell lysis was performed using ammonium-chloride-potassium (ACK) buffer. After centrifugation, cells were resuspended in DMEM containing GlutaMAX supplement, 10% FBS and 1% P/S and seeded on culture plates. After attachment, the plates were washed three times with PBS before re-adding medium. After one week of culture, remaining adherent cells were identified as fibroblasts by testing for protein levels of ɑSMA and PDGFRβ via western blot analysis.
3D culture of CAFs
5 × 10³ CAFs or CAFΔCD44 were seeded in 50 µl Matrigel (Corning, Corning, NY, USA) domes into 24-well plates and cultured in 500 µl of MSC-GRO™ pancreatic CAF maintenance medium (Vitro Biopharma, Inc.) with 1% of P/S. Retrieval of cells from the Matrigel was achieved by incubation with 250 µl of pre-warmed dispase (1 U/ml, Stemcell Technologies, Vancouver, BC, Canada). Collected cell pellets were prepared for further analysis.
Cell culture
For immunofluorescence analyses, 1 × 10⁴ imPSCs/imPSCΔCd44 or CAFs/CAFΔCD44 per well were seeded on glass slides in 12-well plates. The cells were induced with 50 ng/ml recombinant TGFβ1 (PeproTech, Thermo Fisher Scientific, Waltham, MA, USA) in DMEM containing 1% FBS and 1% P/S for 24 h.
For induction experiments, cells were seeded in Matrigel, on flasks or plates. In 2D culture, CAFs/CAFΔCD44 (1 × 10⁵) or imPSCs/imPSCΔCd44 (9 × 10⁴) were seeded into 6-well plates. Cells were starved in DMEM containing 1% FBS and 1% Pen/Strep for 24 h, before cells were induced with 50 ng/ml of recombinant TGFβ1 (either 24 or 72 h) or 20 ng/ml of IL-1β or IL-6 (PeproTech). Cells were either prepared for protein or RNA analyses or removed from the Matrigel for RNA isolation.
Lentivirus production and cell transduction
The CRISPR/Cas9-mediated knockout of Cd44/CD44 in imPSCs and CAFs was performed using a third-generation lentiviral system. HEK293T packaging cells were transfected (PromoFectin, PromoCell, Heidelberg, Germany) with pMDL (5 µg, gag and pol genes), REV (2.5 µg, rev gene) and VSV-G (2.8 µg, vsv-g gene). The fourth plasmid (10 µg) either encoded a Cas9 endonuclease and a small guide RNA (sgRNA) to target the Cd44 gene sequence (mouse: VB180221-1067cyf human:VB180221-1056peh) or a scramble sequence tagged with mCherry (VB240604-1056nya).
After six hours of transfection, the medium was removed, and 5.5 ml of growth medium were added into the culture plate. After 24 h of particle production, the medium was removed and filtered (0.45 µm) on top of the target cells. This was repeated once. The cells were selected with puromycin (2 µg/ml, InvivoGen, San Diego, CA, USA) and analyzed/sorted for CD44-negative or mCherry-positive cells (scramble) via flow cytometry.
Flow cytometry
CRISPR/Cas9-transduced CAFs or imPSCs were collected, incubated with human (Clone FC1, BD PharmingenTM, Franklin Lakes, NJ, USA; RRID: AB_2728082) or mouse Fc BlockTM (Purified rat anti-mouse CD16/CD32; BD PharmingenTM; RRID: AB_394656) for 30 min and stained with a PE anti-mouse/human CD44 antibody (1:100, clone: IM7, BioLegend, San Diego, CA, USA; RRID: AB_312959) or isotype control (1:100, BioLegend; RRID: AB_326552) for 15 min. Cells were washed with FACS buffer (PBS + 2% FBS + 2 mM EDTA) and analyzed by flow cytometry using a FACSAria Fusion cytometer (BD Biosciences, Franklin Lakes, NJ, USA).
Indirect immunofluorescence
Cells on coverslips were fixed with 2% paraformaldehyde and permeabilized with 0.1% (v/v) Triton-X-100. After blocking (5% FBS in PBS, 45 min, RT), samples were incubated with primary antibodies against CD44 (IM7, 2.5 µg/ml, BD Biosciences, RRID: AB_393732), COL1A1 (1:200, Cell Signaling, Danvers, MA, USA; RRID: AB_2800169), Phalloidin (1:1 000, Alexa Fluor 488, Thermo-Fisher Scientific), GFAP (1:200, Cell Signaling, RRID: AB_2631098) or ɑSMA (1:200, Cell Signaling, RRID: AB_2857972) diluted in 5% FBS in PBS overnight at 4 °C. After washing with PBS-Tween, cells were incubated with the secondary antibodies goat anti-rat IgG secondary antibody, Alexa Fluor® 488 conjugate 1:1 000; Thermo Fisher, RRID: AB_2534074, goat anti-rabbit IgG secondary antibody, Alexa Fluor® 546 conjugate (1:1 000; Thermo Fisher, RRID: AB_2534115) and 4’,6-dia-midino-2-phenylindole (DAPI) (1:1 000, Dako, Santa Clara, CA, USA) diluted in 5% FBS in PBS at RT for 30 min. Coverslips were mounted using Mowiol 4-88 (Roth, Karlsruhe, Germany). The slides were analyzed with a Zeiss LSM 800 confocal microscope (Zeiss, Oberkochen, Germany). Second harmonic generation signal was acquired at 430 nm by using linear unmixing mode after excitation at 860 nm.
Bimolecular fluorescence complementation assay
TGFBRI-VN and CD44-VC were transfected using Fugene 4 K (Promega, Madison, WI, USA) into imPSCs. At 48 h after transfection, cells were fixed with 4% paraformaldehyde. Cells transfected with only TGFBRI-VN were used as negative controls. Cell nuclei were stained with DAPI for 15 min. Confocal images (Zeiss LSM 800) were processed using ImageJ software (National Institutes of Health, Bethesda, MD, USA). Sequences of the constructs can be provided on request.
Co-cultures
Incubation of DC2.4 cells with CAFs/CAFΔCD44-conditioned medium (CM)
2 × 10⁵ DC2.4 cells were seeded in a 6-well plate and incubated with full RPMI-1640 medium or with RPMI-1640 medium containing 50% of either CAF or CAFΔCD44 CM. 24 h after seeding, 1 µg/ml LPS was added and incubated for 24 h before RNA was extracted for downstream analysis.
Indirect co-culture of CAFs/CAFΔCD44 with DC2.4 cells
DC2.4 cells were seeded in a 12-well plate with 1 × 10⁵ cells per well. 5 × 10⁴ CAFs/CAFΔCD44 were seeded in ThinCert inserts (0.4 μm pore, Greiner Bio-One, Kremsmünster, Austria) on top of the DC2.4. After 24 h of co-culture, 1 µg/ml of LPS was added to the well and incubated for 24 h, before RNA was extracted from the DC2.4 for downstream analysis.
Protein detection
Human cytokine array
Secretome analyses of CAFs/CAFΔCD44 were conducted using the Human Cytokine Antibody Array (Abcam, Cambridge, UK) according to the manufacturer’s instructions. 2 × 10⁵ CAFs/CAFΔCD44 were seeded and incubated for 48 h. Media was collected, centrifuged (450 rcf, 6 min) and filtered (0.2 µm). Array membranes were incubated with CM and through a biotin-streptavidin-HRP antibody system, the factors present were visualized with the ChemiDoc™ Touch Imaging system (BioRad, Hercules, CA, USA) upon administration of the HRP substrate. Positive and negative control spots were used to quantify the relative signal intensity.
Cell-derived matrices production
The procedure was adapted from Kaukonen et al., Nat Protoc, 2017, with minor modifications [32]. Plates with sterile coverslips were coated with 1% gelatin and crosslinked with 1% glutaraldehyde (v/v) for 20 min at RT. Crosslinking was quenched with 1 M glycine for 20 min at RT, followed by PBS washes. Cells were seeded at 4 × 10⁵ per well in DMEM (10% FBS, 1% P/S). After 48 h, extracellular matrix deposition was stimulated by daily treatment with 1% ascorbic acid (50 μg/ml) with or without TGFβ1 (5 ng/ml) for 7 days. Fibroblasts were then removed using extraction buffer (100 mM NH4OH in PBS containing 0.5% (v/v) Triton X-100) for 3 min, followed by two PBS washes. Cell-derived matrices were stored at 4°C in PBS or fixed with 4% paraformaldehyde for 10 min prior to fluorescent staining and confocal microscopy.
Contraction assay
The contraction assay was adapted from Chitty et al., Cancer Reports, 2020, with minor modifications [62]. 96-well plates were coated with 2% BSA and 2.5 × 10⁴ cells were embedded in 100 µL of rat tail collagen I hydrogel (1.5 mg/mL, Corning, Corning, NY, USA). Hydrogels were polymerized for 1 h at 37 °C, after which 100 µL of complete growth medium was added to each well. Gels were allowed to contract for 48 h at 37 °C. Images of the collagen lattices were acquired using a MICA microscope (Leica, Wetzlar, Germany), and the diameter of the well and gel was measured using ImageJ.
T cell killing assay
CD3+ T cells were isolated from human PBMCs using the Pan T cell isolation kit (Miltenyi Biotec, 130-096-535) according to the manufacturer’s protocol. T cells were activated for three days using CD3/CD28 activation beads (DynabeadsTM Human T-activator CD3/CD28, Gibco) at a 1:1 bead-to-cell ratio and 30 U/mL recombinant IL-2 (R&D Systems, Minneapolis, MN, USA; BT-002-050) in serum-free X-VIVO 15 medium (Lonza, Basel, Switzerland). Tumor cells were seeded 20 h prior the experiment on fibronectin-coated 96-well imaging plates (Screenstar Microplate, Greiner Bio-One; fibronectin: R&D Systems, Minneapolis, MN, USA, 1030-FN-05M). On the day of co-culture, tumor cells were stained with CellTrackerTM Green CMFDA (InvitrogenTM, Thermo Fisher). T cells and target cells were suspended in the experimental (60% CAF conditioned media and 40% RPMI-1640 (HiGlutaXL RPMI-1640, HiMedia, AL028G) + 10% FBS (Bio & Sell, Feucht, Germany; FBS.S0615)) and control media containing Anti-CD45-AF647 (1:500, InvitrogenTM, Thermo Fisher, MA5-38730) for labeling T cells and NucSpot 568/580 (1:2 000, biotium, Fremont, CA, USA 41036) for identifying dead cells. The CD3xPSMA BiTEs (MedChemExpress, Monmouth Junction, NJ, USA; HY-P99802) were prepared in the respective experimental and control medium and added to the co-culture at 10 µg/ml. Imaging was conducted with the Cell Voyager CQ1 Confocal Quantitative Image Cytometer (Yokogawa, Tokyo, Japan) for 24 h at intervals of 30 min. Maximum intensity projection images were recorded from three Z planes covering a 3 µm using a 20x/0.8 NA objective (Olympus, Tokyo, Japan; UPLXAPO20X).
The tumor cell confluency was measured based on the green CellTracker fluorescence using CellPathfinder (version 3.06.01.08, Yokogawa). The confluency over time was baseline-corrected and depicted as percent difference [100*(Value-Baseline)/Baseline].
The resulting curves were fitted using the [Inhibitor] vs. response – Variable slope four parameter logistic models [Y=Bottom + (Top-Bottom)/(1 + (IC50/X)^HillSlope)]. To calculate the maximal killing rate, the first derivative at t=half-maximal effect (HME) was calculated using:
$${{\rm{Killing\; Rate}}}_{\max }={\left|\frac{{dY}}{{dX}}\right|}_{X={HME}}=\left|\frac{\left({\rm{Top}}-{\rm{Bottom}}\right)\,{\rm{HillSlope}}}{4\,{HME}}\right|$$
Opal multiplex immunohistochemistry (mIHC)
Staining and image acquisition
Multiplex immunofluorescence staining was performed on 3 µm FFPE tissue sections using the Opal™ workflow (Akoya Biosciences, Marlborough, MA, USA) on a Leica BOND RX automated platform (Leica Biosystems, Nussloch, Germany). Sections were baked at 40 °C for 15 min, followed by 58 °C for 1 h, then deparaffinized. Heat-induced epitope retrieval was performed in BOND Epitope Retrieval Solution 2 (ER2, pH 9; Leica Biosystems) for 40 min. Endogenous peroxidase activity was quenched with 3% H₂O₂ (Sigma-Aldrich) for 10 min, and non-specific binding was blocked with BOND Protein Block (Leica Biosystems) for 10 min at room temperature. Sequential staining involved incubation with primary antibodies (see Supplementary Table) for 30 min, followed by HRP-conjugated secondary antibodies (Akoya Biosciences) and Opal tyramide signal amplification (1:150–1:250 dilution, 10 min; Akoya Biosciences). High-stringency washes were applied between cycles, and heat-induced epitope retrieval (ER2, 20 min) was performed between markers to remove bound antibodies while preserving fluorophores. Two panels were designed: Panel 1 five markers and Panel 2 containing two markers (see Supplementary Table). Nuclei were counterstained with DAPI, slides were coverslipped with Aquapoly Mountant (Polysciences), and multispectral images were acquired on the Akoya PhenoImager HT system (Akoya Biosciences). Image unmixing was performed using inForm software (Akoya Biosciences), with fluorophore assignments optimized to minimize spectral overlap.
Image analysis
Image analysis was performed using QuPath (Version 0.6.0; Bankhead, P., Loughrey, M.B., Fernández, J.A. et al. 2017). Whole tissue annotation and segmentation were based on DAPI signal. Cell detection was performed using the built-in cell detection command in QuPath. The detection parameters were customized and optimized to achieve accurate segmentation of the whole tissue. For each marker, object classifiers were independently developed using a representative training image compiled from all samples to avoid bias. Classifiers were based on characteristic features such as signal intensity patterns, subcellular localization, and morphological criteria. Subsequently, the trained classifiers were applied sequentially to each segmented sample. The export of single-cell classification data from QuPath was conducted in Excel format for subsequent analysis. The resulting data were then plotted in GraphPad Prism 10, where the t test, Mann–Whitney-U test, and Outlier test were used to compare cell densities between genotypes.
Single cell data analysis
Raw read counts were obtained from the Genome Sequence Archive (GSA; CRA001160). Data processing and quality control were performed using Scanpy. Low-quality cells were filtered out according to the following criteria: only cells expressing between 100 and 6000 genes and with fewer than 100,000 total counts were retained. Genes detected in fewer than three cells were excluded. Doublet detection was performed using the scanpy.pp.scrublet function, identifying 0.26% of cells as potential doublets, which were excluded from downstream analyses. After filtering, 45,776 cells remained for further analysis.
Read counts were normalized per cell to a total count of 10,000. Principal component analysis (PCA) was performed on the 5000 most variable genes, followed by nearest-neighbor graph construction using the top 30 principal components. UMAP was applied for dimensionality reduction and visualization. Cell type annotations from the original publication were used as the reference labels. Marker gene analysis was conducted using the Wilcoxon rank-sum test, comparing each cell type against all others. Comparisons between pancreatic cancer and normal conditions were performed using the same approach. Genes with an adjusted p-value below 0.05 were considered as significantly regulated. Fibroblastic cells were defined by the expression of ɑSMA, PDGFRβ, lumican (LUM), decorin (DCN), adipogenesis regulatory factor (ADIRF), COL1A1.
Statistical analysis
Tests for Gaussian (normal) distribution were conducted for all data by Shapiro-Wilk normality test or Kolmogorov-Smirnov normality test. Upon passing the normality test, both samples were assumed to derive from populations with the same variances. Using a non-paired parametric test like the one-sided unpaired Student’s t test, mean values of quantitative variables between two independent groups were compared. In case of comparison between the mean of a single sample against a hypothetical mean a one-sample t test was used. If means of more than two samples were compared, a one-way analysis of variances (ANOVA) was performed and Holm-Šídák’s multiple comparison was used as a post hoc test. Data are shown as the average with ± standard error of mean (SEM). We accepted a significance level α < 0.05. For animal experiments the statistical power (1-β) was 0.8 while ɑ was 0.05. P values are indicated by asterisks and defined as *p = 0.05, **p = 0.01, ***p = 0.001, ****p < 0.0001. Statistical analysis was performed using GraphPad Prism 9.3.1 software (GraphPad, RRID:SCR_002798).
Supplementary information is available at Cell Death & Disease’s website.
