


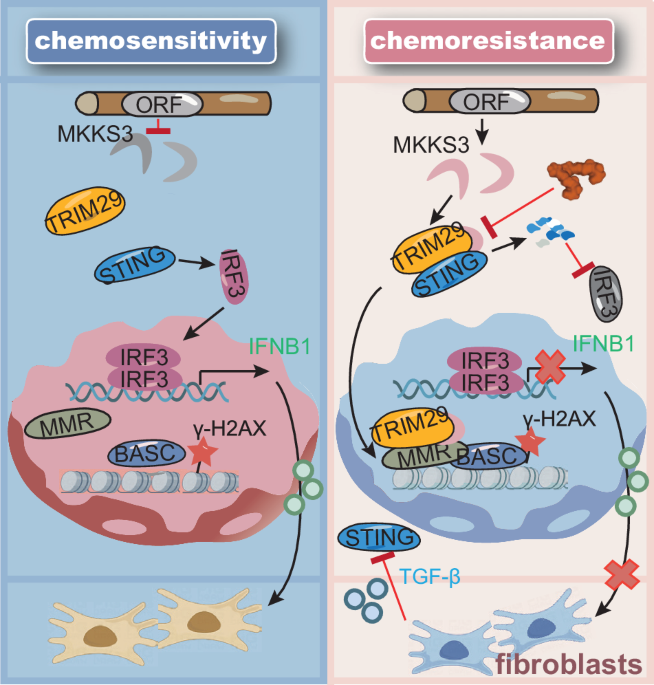
Cell culture and drugs
Human CRC cell lines (HT29, SW480, SW620, HCT116, RKO, DLD1) were obtained from ATCC (Rockville, MD, USA), whereas the normal colonic epithelial cell line NCM460 was sourced from INCELL Corporation (San Antonio, TX, USA). Fibroblasts were purchased from FUHENG Biology (Shanghai, China). Cells were cultured in RPMI 1640 or DMEM (Thermo Fisher Scientific, San Jose, CA, USA), supplemented with 10% fetal bovine serum (FBS) (ExCell Bio, Shanghai, China) in a 5% CO2 incubator at 37 °C. All cell lines used were cultured within 35 generations and tested negative for Mycoplasma throughout the study. The short tandem repeat profiling was used to verify the identity of cell lines. The TargetMol Natural Compound Library (30 mM), KU-55933, berzosertib and oxaliplatin were acquired from TargetMol (Boston, MA, USA) and dissolved in dimethyl sulfoxide (DMSO).
Identification of long non-coding RNA-encoded proteins
Raw pan-cancer data were obtained from Clinical Proteomic Tumor Analysis Consortium (CPTAC) studies with the following IDs: PDC000120 (breast), PDC000411 (kidney), PDC000116 (colon), PDC000221 (head and neck), PDC000198 (liver), PDC000234 (lung), PDC000110 (ovary), PDC000341 (pancreas) and PDC000125 (uterus). The data were analysed using a reference library from a previous study. TMT datasets (breast, colon, head and neck, liver, lung, ovarian and uterine cancers) were processed with Proteome Discoverer (Thermo Scientific), whereas DIA datasets (kidney and pancreatic cancers) were analysed using Spectronaut (Biognosys, Switzerland). All samples were analysed in the study; there was no attrition. Proteins with no missing values in more than 30% of tumour samples or more than 30% of non-tumour samples were included and classified as lncRNA-encoded proteins.
Western blotting analysis
Western blotting was conducted as previously described21,22. The primary antibodies used included GFP (Proteintech, Rosemont, IL, USA; 50430-2-AP; RRID:AB_11042881), Flag (Proteintech; 20543-1-AP; RRID:AB_11232216), TRIM29 (Proteintech; 17542-1-AP; RRID:AB_2272412), FAP (Cell Signaling Technology, Beverly, MA, USA; #52818; RRID:AB_3674735), α-SMA (Proteintech; 14395-1-AP; RRID:AB_2223009), λ-H2AX (Active Motif, Carlsbad, CA, USA; 39689; RRID:AB_2728764), HA (Cell Signaling Technology; #3724; RRID:AB_1549585), MSH2 (Proteintech; 15520-1-AP; RRID:AB_2144799), BRCA1 (Proteintech; 22362-1-AP; RRID:AB_2879090), ATM (Proteintech; 27156-1-AP; RRID:AB_2880780), H3K36me3 (Active Motif; 61021; RRID: AB_2614986), STING (Proteintech; 19851-1-AP; RRID:AB_10665370), Ki-67 (Proteintech; 27309-1-AP; RRID:AB_2756525), Ub (Proteintech; 10201-2-AP; RRID:AB_671515), TGFβ (Proteintech; 81746-2-RR; RRID:AB_3670503), Actin (Proteintech; 66009-1-Ig; RRID:AB_2687938), CD8 (Biolegend, San Diego, CA, USA; 100752; RRID:AB_2563057), CD4 (Biolegend; 100510; RRID:AB_312713), Granzyme B (Biolegend; 372208; RRID:AB_2687032) and CD69 (Biolegend; 164203; RRID:AB_2936560). Antibodies against MKKS3 were generated by immunizing rabbits with recombinant proteins (GL Biochem, Shanghai, China) and were purified via affinity chromatography using the corresponding recombinant proteins. Signals were visualized using Clarity Western ECL substrate (Bio-Rad, Hercules, CA, USA) and detected through autoradiographic film exposure.
Plasmids, transfection and infection
The 5’UTR-ORF sequences of NR_072977 were cloned into a mutant EGFP vector with the start codon ATG mutated to ATT. The mutant constructs (5’UTR-ORFmut-GFPmut, 5’UTR-ORFmut-Flag) were generated using the Mut Express II Fast Mutagenesis Kit v2 (Vazyme, Nanjing, China). Small interfering RNAs (siRNAs) targeting TGF-β, TRIM29 and DENR, as well as doxycycline (DOX)-inducible ORF-knockdown plasmids, 5’UTR-ORF-Flag plasmids, stable ORF and ORFmut-overexpression plasmids, and TRIM29-expressing plasmids, were purchased from TransheepBio (Shanghai, China). The plasmids pcDNA3.1 (RRID:Addgene_128034)-TRIM29-mut1-HA, pcDNA3.1-TRIM29-mut2-HA, pcDNA3.1-TRIM29-mut3-HA and pcDNA3.1-TRIM29-mut4-HA were obtained via PCR amplification. Protocols for establishing stable cell lines and transfection were described previously21. The siRNAs were transfected into CRC cells using Lipofectamine 3000 (Thermo Fisher Scientific). Wild type and mutant MKKS3 5’UTR regions were cloned into the pGL3 vector (Promega, Madison, WI, USA; RRID:Addgene_48743). Dual luciferase reporter assays were conducted with the Dual-Luciferase Reporter Assay System (Promega). Cells were co-transfected with a luciferase plasmid containing the 5’UTR region of MKKS3 and a pRL-TK Renilla luciferase plasmid (RRID:Addgene_27163), and luciferase activity was measured according to the manufacturer’s instructions. Primer sequences and siRNA target sequences are listed in Supplementary Table 10.
CRISPR/Cas9 screening
A CRISPR knockout pooled library targeting 314 lncRNAs was designed and constructed by Fubio Biological Technology Co., Ltd. (Shanghai, China). A library containing 10 single guide RNAs (sgRNAs) per lncRNA in addition to non-targeting sgRNAs was transduced into CRC cells. To conduct a CRISPR-Cas9 knockout screen, cells were transduced with the designed sgRNA library at a multiplicity of infection of approximately 0.3 to achieve coverage of at least 500-fold per guide RNA (gRNA). After transduction, cells were selected with puromycin (5 μg/ml) for 48 h and then subcutaneously injected into nude mice. To ensure adequate sgRNA representation, at least 6 × 10⁶ cells were maintained at any given time throughout the experiment. The experimental group received oxaliplatin (20 mg/kg) every 2 days. After 1 month, oxaliplatin-treated and control tumours were harvested, and genomic DNA was extracted using a DNA extraction and purification kit (Qiagen, Hilden, Germany) as previously described14. sgRNA inserts were amplified by PCR using NEBNext High Fidelity PCR Master Mix (NEB, Ipswich, MA, USA). For each sample, 10 μg of genomic DNA was used as input for PCR amplification. PCR products were then used to construct paired-end libraries with the Paired-End DNA Sample Prep Kit (Illumina Inc., San Diego, CA, USA). Deep sequencing was performed on a NovaSeq 6000 platform (Illumina Inc.) at Genedenovo Biotechnology Co., Ltd. (Guangzhou, China). Raw reads were filtered to obtain high-quality clean reads using the following criteria: 1) removing reads with ≥ 10% unidentified nucleotides (N); 2) removing reads with > 40% bases having Phred quality scores ≤ 20; 3) removing reads aligned to barcode adapters. Reads were mapped to the sgRNA library using Blastn (version 2.6.0 + ; parameter: -word_size 18). Resistance lncRNAs were identified from the sgRNA screen sequencing results using MAGeCK MLE analysis. MAGeCK MLE calculates a “beta score” for each targeted gene to measure the degree of selection upon gene perturbation, similar to the “log fold-change” measurement in differential expression analysis. A positive beta score indicates that the gene is a positively screened lncRNA, whereas a negative value indicates a negatively screened lncRNA. P value < 0.05 and negative beta scores were considered as significantly depleted sgRNAs.
Cell viability assay
The WST-1 Cell Proliferation and Cytotoxicity Assay Kit (Beyotime Biotechnology, Shanghai, China) was used to assess CRC cell viability23. Briefly, 1 × 10³ cells were plated in 96-well plates, followed by treatment with oxaliplatin (0 μM, 10 μM, 20 μM) or 1-Hydroxybaccatin I (0 μM, 10 μM, 20 μM). WST-1 reagent was added, cells were incubated at 37 °C for 2 h and absorbance at 450 nm was measured using an automated microplate spectrophotometer (BioTek Instruments, Winooski, VT, USA).
Colony formation assay
CRC cells transfected with MKKS3, MKKS3mut or TRIM29 siRNA were plated in 6-well or 12-well plates and treated with the indicated concentrations of oxaliplatin (0 μM, 10 μM, 20 μM) or 1-Hydroxybaccatin I (0 μM, 10 μM, 20 μM) for 2 weeks. Cells were then fixed with methanol, stained with 1% crystal violet and the colonies were quantified.
Immunofluorescence staining
5’UTR-ORF or 5’UTR-ORFmut-fused GFP vectors were transfected into CRC cells, and GFP fluorescence was visualized by fluorescence microscopy (Nikon, Tokyo, Japan). Cells expressing 5’UTR-ORF-Flag or 5’UTR-ORFmut-Flag, treated with DOX (1 mg/ml) and the indicated concentrations of oxaliplatin, were fixed with 4% paraformaldehyde. After fixation, cells were permeabilized with 0.1% Triton X-100 for 15 min, followed by incubation with anti-MKKS3, anti-Flag (RRID:AB_11232216) or anti-λ-H2AX (RRID:AB_2728764) antibodies, after washing and blocking with bovine serum albumin. Secondary antibodies were used for staining in the dark, followed by DAPI staining (Beyotime Biotechnology) for immunofluorescence analysis.
Generation of anti-MKKS3 antibody
The anti-MKKS3 antibody was generated by GL Biochem (Shanghai, China) through rabbit inoculation with a Keyhole limpet haemocyanin (KLH)-coupled specific peptide. The antibody was further purified by affinity chromatography using KLH-coupled peptide columns.
Tissue microarray and multiplex immunohistochemical staining
A tissue microarray (TMA, Shanghai Outdo Biotech, China, HCol-Ade180Sur-04) consisting of 100 chemotherapy-treated CRC tissues (72 non-recurrent and 28 relapsed) and 72 normal tissues was utilized to evaluate the expression of MKKS3 and α-SMA. The immunohistochemistry (IHC) protocol was described previously21. The PANO 6-plex Immunohistochemistry Kit (Panovue, Beijing, China) facilitated the assessment of MKKS3 and α-SMA expression and their association with clinicopathological parameters. In summary, tissue slides underwent deparaffinization in xylene, rehydration in ethanol and blocking with blocking buffer (Panovue). Subsequently, they were incubated with primary antibodies for 60 min, washed with TBST, and treated with horseradish peroxidase-conjugated secondary antibodies for 10 min. Following a second incubation with primary antibodies, signals were visualized using Opal 520 TSA (1:200) and counterstained with DAPI for 10 min. Imaging was performed using a Vectra Polaris platform (PerkinElmer, Waltham, MA, USA), and analysis was conducted using HALO software (Indica Labs, Corrales, NM, USA).
Immunohistochemistry
Tumour sample slides were blocked with normal serum and incubated overnight at 4 °C with anti-Ki-67 (RRID:AB_2756525), anti-STING (RRID:AB_10665370), anti-α-SMA (RRID:AB_2223009) or anti-MKKS3 antibodies. Biotinylated secondary antibodies and a peroxidase-conjugated avidin–biotin complex (Dako) were then applied. Visualization of staining was achieved using 3,3′-diaminobenzidine (Dako), followed by counterstaining with haematoxylin. Imaging was performed using the Vectra Polaris platform (PerkinElmer), with analysis conducted using HALO software.
Mass spectrometry and bioinformatics analyses
Protein digestion and mass spectrometry were performed as previously described24. In brief, HT29 cells expressing MKKS3 and control cells were lysed, and proteins were digested with trypsin, vacuum-freeze-dried, resuspended in anhydrous acetonitrile and desalted using MonoTIP C18 Pipette Tips (GL Sciences, Tokyo, Japan). The resulting peptides were analysed using an Orbitrap Fusion Lumos mass spectrometer (Thermo Fisher Scientific). Raw data were processed with Proteome Discoverer (Thermo Fisher Scientific, RRID:SCR_014477) and Spectronaut (Omicsolution Co., Ltd., Shanghai, China) software, with a protein/peptide false discovery rate set at 1%.
Gene set enrichment analysis
Differentially expressed proteins (DEPs) between the experimental and control groups were identified with a fold change ≥ 1.5 and P < 0.05. The DEPs were ranked by fold change values and subjected to gene set enrichment analysis (GSEA) to identify significantly enriched pathways. GSEA was performed using the GSEA function implemented in the R package “clusterProfiler” (v3.10.1). Enrichment plots were visualized using the gseaplot2 function from the “enrichplot package” (v1.2.0). The gene set c2.cp.kegg.v7.5.symbols.gmt was used as the reference gene set. Pathways with significant enrichment are shown based on the normalized enrichment score (NES) and P value. Datasets with |NES | > 1 and P < 0.05 were considered significantly enriched.
Generation of conditioned medium from cell lines
CRC cell lines (HT29, SW480) and fibroblasts were cultured in RPMI1640 (Thermo Fisher Scientific) supplemented with 10% fetal bovine serum (FBS; ExCell Bio). When cells treated with DMSO, oxaliplatin, IFNβ, or conditioned medium (CM) reached 70–80% confluency, they were washed with PBS, and fresh RPMI1640/10% FBS was added. CM was collected 48 h later, centrifuged at 300 g for 5 min, filtered through 0.45-μm filters, and used fresh. Target cells were then treated with equal volumes of CM at a final concentration of 50% in complete medium (ratio 1:1) for 48 h, followed by subsequent assay analysis.
Co-immunoprecipitation
Co-immunoprecipitation (Co-IP) was performed following established protocols25. Cell lysates were incubated with IgG (Santa Cruz Biotechnology) and protein A/G Sepharose beads (Invitrogen, Carlsbad, CA, USA) at 4 °C for 1 h. The supernatant was then mixed with a primary antibody and incubated overnight at 4 °C, followed by incubation with protein A/G Sepharose beads for an additional 4 h. After washing with PBS and lysis buffer, the beads were resuspended in 5 × SDS/PAGE loading buffer for subsequent western blotting analysis.
Single-cell gel electrophoresis
Comet assays were conducted according to the manufacturer’s protocol (Trevigen, MD, USA). Briefly, cells were mixed with molten agarose at a 1:10 ratio, spread onto pre-warmed glass slides, and subjected to lysis in lysis solution (Trevigen) for 1 h. The slides were then immersed in 1 × neutral electrophoresis buffer for 30 min before electrophoresis at 4 °C for 45 min. After fixation, the cells were stained with SYBR Gold (Invitrogen), and the tail length and DNA intensity within the tail were quantified.
Enzyme-linked immunosorbent assay
Enzyme-linked immunosorbent assay (ELISA) was employed to quantify the levels of IFNβ in the CM using the IFNβ ELISA kit (Abcam, Cambridge, MA, USA), following the manufacturer’s guidelines.
Molecular docking
For molecular docking, the TRIM29 protein model was generated utilizing the Protein Data Bank (PDB; http://www.rcsb.org). The optimal binding pose of 1-Hydroxybaccatin I to TRIM29, determined by binding score, was selected for interaction analysis using Dock version 6.9 (https://dock.compbio.ucsf.edu/).
In vivo experimental metastasis model
All animal experiments were approved by the Ethics Committee for Animal Experiments at Jinan University (20240703-01). Tumour xenograft experiments were performed according to established protocols. Six- to eight-week-old female BALB/c nude mice (RRID:IMSR_GPT:D000521) and C57BL/6 mice (RRID:IMSR_JAX:000664) were housed under standard conditions in compliance with institutional guidelines. A cell suspension (5 × 10⁶ for HT29, RRID:CVCL_0320; 2 × 10⁶ for MC38, RRID:CVCL_B288) was subcutaneously injected into the flanks of the mice. Tumour volume was calculated using the formula: V = (length × width2) / 2. Once tumours reached a diameter of approximately 5 mm, mice were randomly assigned to control and treatment groups. As shown in Fig. 2o, stably transfected MKKS3 cells were subcutaneously injected into nude mice, with xenograft measurements taken every 3 days to calculate tumour volumes. As shown in Fig. 7g, C57BL/6 mice were administered vehicle (0.5% CMC-Na), or 1-Hydroxybaccatin I (5 mg/kg), or oxaliplatin (5 mg/kg), or SB24011 (an inhibitor of the STING-TRIM29 interaction, 5 mg/kg), or a combination of 1-Hydroxybaccatin I and oxaliplatin, or a combination of SB24011 and oxaliplatin, once every 3 days. As shown in Fig. 8a: MC38 cells were subcutaneously injected into C57BL/6 mice, and the mice were intratumourally injected with AAV8-shMKKS3 (1010 or 1011) or control virus. Subsequently, mice received oral administration of either vehicle (0.5% CMC-Na) or oxaliplatin (5 mg/kg). To deplete CD8+ T cells, CD8a-depleting antibody (BioXcell, BE0061, RRID:AB_1125541, 200 μg) was injected twice a week, starting 2 weeks prior to treatment with drugs. Additionally, IFNAR1 (RRID:AB_2687723) neutralizing antibody was administered via intraperitoneal injection at a dose of 100 μg per mouse every 3 days. At the conclusion of the experiment, blood was collected for biochemical and haematological analysis, tumours were harvested for IHC, and liver, lung and kidney tissues were collected for histopathological analysis.
Single-cell RNA sequencing
HT29 and MC38 xenograft tissues were transported in sterile culture dishes containing 10 ml 1× Dulbecco’s phosphate-buffered saline (Thermo Fisher, Cat. no. 14190144) on ice to remove residual tissue storage solution, followed by mincing on ice. Tissues were digested using dissociation enzyme solution consisting of 0.25% (w/v) Trypsin (Thermo Fisher, Cat. no. 25200-072) and 10 μg/ml DNase I (Sigma, Cat. no. 11284932001) dissolved in PBS containing 5% FBS (Thermo Fisher, Cat. no. SV30087.02). HT29 and MC38 xenograft tissues were dissociated at 37 °C with shaking at 50 rpm for approximately 40 min. Dissociated cells were repeatedly collected at 20-min intervals to maximize cell yield and viability. Cell suspensions were filtered through a 40-μm nylon cell strainer, and red blood cells were removed using 1× Red Blood Cell Lysis Solution (Thermo Fisher, Cat. no. 00-4333-57). Dissociated cells were washed with 1× Dulbecco’s phosphate-buffered saline containing 2% FBS. Cell viability was assessed using acridine orange/propidium iodide (AO/PI) fluorescent dye on a Countstar Fluorescence Cell Analyzer (Aber Instruments) prior to loading onto the 10× Chromium platform.
For 10x library preparation and sequencing, single-cell RNA sequencing (scRNA-seq) libraries were generated using the 10× Chromium Single Cell 3′ v3.1 kit following the manufacturer’s standard protocol. Briefly, cells were loaded onto the Chromium platform to generate Gel Beads-in-emulsion, where beads with unique molecular identifiers and cell barcodes were hybridized to polyadenylated RNA. After cell lysis, beads were retrieved for reverse transcription, followed by second-strand complementary DNA synthesis, adaptor ligation and library construction. Sequencing libraries were generated and quantified using a High Sensitivity DNA Chip (Agilent) on a Bioanalyzer 2100 and the Qubit High Sensitivity DNA Assay (Thermo Fisher Scientific). Libraries were sequenced on an Illumina Xplus platform using 2×150 chemistry. Alternatively, sequencing was performed on a DNBSEQ-T7 platform (PE150) using the DNBSEQ-T7RS Reagent Kit (FCL PE150) version 3.0. Sequencing and bioinformatic analysis were conducted by Majorbio Co., Ltd. (Shanghai, China).
For scRNA-seq data processing, raw reads were processed using Cell Ranger V7.1.0 with default parameters and aligned to the reference genome using STAR. FASTQs generated from Illumina sequencing output were aligned to the Mus_musculus (GRCm39) or Homo_sapiens (GRCh38) genome using the STAR algorithm. Gene-barcode matrices were generated by counting unique molecular identifiers and filtering non-cell barcodes. Downstream analysis was performed in Seurat (v4.1.1). Low-quality cells were excluded based on three criteria: number of detected transcripts, unique molecular identifiers, detected genes and mitochondrial gene percentage (mean ± 2-fold standard deviation). The normalized data (NormalizeData function in the Seurat package) was performed for extracting a subset of variable genes. Next, we integrated data from different samples after identifying ‘anchors’ between datasets using FindIntegrationAnchors and IntegrateData in the Seurat package, and visualization was performed using uniform manifold approximation and projection.
For clustering analysis, scaling, dimensionality reduction and clustering were applied to the specific dataset (restricted to one cell type). Differential expression analysis between clusters was performed using the Wilcoxon rank-sum test. Cell types were identified using SCINA and known marker genes. Differential expression genes (DEGs) between two different samples or clusters were identified using the FindMarkers function in Seurat with a likelihood ratio test. Functional enrichment analysis of Kyoto Encyclopedia of Genes and Genomes (KEGG) pathways was performed to identify significantly enriched terms and metabolic pathways compared with the whole-transcriptome background, with P value < 0.05. KEGG functional enrichment analysis was carried out using Python SciPy software.
Measurement of CD8+ and CD4+ T cell subsets in tumour tissues
Tumour tissues were processed into single-cell suspensions to evaluate the proportion of central memory T cells within the tumour-infiltrating CD8+ and CD4+ T cell populations. CD4 (1:400, RRID:AB_312713) and CD8 (1:600, RRID:AB_2563057) expression was assessed by gating on the CD45+ cell population. For GZMB (1:100, RRID:AB_2687032) and CD69 (1:400, RRID:AB_2936560) detection, single-cell suspensions were stained with CD8 antibodies (RRID:AB_2563057), followed by washing with PBS, fixation and permeabilization using the BD kit (00-5523-00, eBioscience, Vienna, Austria) for intracellular staining. The expression of GZMB and CD69 was then analysed within the CD8+ population.
Quantitative real-time-PCR
Total RNA was extracted using TRIzol (Thermo Fisher Scientific), and complementary DNA was synthesized with the PrimeScript II First-Strand complementary DNA Synthesis Kit (Takara, Dalian, China). Quantitative real-time-PCR was performed as previously described21, utilizing SYBR Green qPCR SuperMix (TransGen, Beijing, China) on a CFX Opus Real-Time PCR System (Bio-Rad). The relative expression of RNA was quantified using the following primers: MKKS3 forward 5′-CCTTCGGAACTTGTGGAGAGAC-3′, reverse 5′-ATCTTGCTCAGGAATGTCGTCGT-3′; GAPDH forward 5′-TGACTTCAACAGCGACACCCA-3′, reverse 5′-CACCCTGTTGCTGTAGCCAAA-3′; ACTA2 forward 5′-AAAAGACAGCTACGTGGGTGA-3′, reverse 5′-GCCATGTTCTATCGGGTACTTC-3′; IL6 forward 5′-AGTGAGGAACAAGCCAGAGC-3′, reverse 5′-CATTTGTGGTTGGGTCAGG-3′; CXCL1 forward 5′-TTGCCTCAATCCTGCATCCC-3′, reverse 5′-GTTGGATTTGTCACTGTTCAGCAT-3′; CXCL2 forward 5′-CCAACCACCAGGCTACAGG-3′, reverse 5′-GCGTCACACTCAAGCTCTG-3′.
Statistics and reproducibility
All in vitro experiments were conducted in triplicate. Statistical analyses were performed using GraphPad Prism, which facilitated two-tailed Student’s t tests, one-way/two-way analysis of variance and log-rank tests, with results presented as mean ± standard deviation (SD). Survival analysis was conducted using the Kaplan–Meier method alongside the log-rank test. Datasets for MKKS3 receiver operating characteristic (ROC) curves were obtained from the CPTAC (PDC000166), while Gene Expression Omnibus databases (GSE72970 and GSE69657 datasets are based on the platform of GPL570[HG-U133_Plus_2] Affymetrix Human Genome U133 Plus 2.0 Array) were utilized to evaluate MKKS3 expression in CRC. Error bars represent SD; statistical significance is denoted as *P < 0.05, **P < 0.01, ***P < 0.001 and ns indicates no significance.
