


Patient cohort and baseline characteristics
Between 2007 and 2025, 61 patients with TP53-altered AML underwent first allo-HCT at our centre. Baseline characteristics are summarised in Table 1. Median age was 64.5 years (IQR 57.4–70.7); 57% had de novo AML, 36% sAML and 7% tAML. Overall, 287/697 patients (41%) were transplanted in CR. In the TP53-altered cohort, 12/61 patients (20%) were transplanted in CR, whereas 37/61 patients (61%) had primary induction failure. Median Karnofsky performance score was 80% (IQR 70–90). Remission depth was not systematically available because assessment methods evolved during the study period. Cytogenetic risk and rDRI distributions are shown in Table 1; adverse cytogenetic risk and high/very-high rDRI were more frequent in the TP53-altered cohort.
Table 1 Baseline patient, disease, and transplant characteristics.
Compared with 636 TP53-wild-type controls, TP53-altered patients were older (64.5 vs. 60.1 years; p = 0.004), had a shorter interval from diagnosis to transplantation (94 vs. 127 days; p < 0.001), and more frequently had primary induction failure (61% vs. 31%; p < 0.001). Positivity for FLT3 length mutations (LMs) or internal tandem duplications (ITDs) was less frequent (2% vs. 23%; p < 0.001), consistent with the infrequent co-occurrence of TP53 and FLT3 alterations [1, 7]. Peripheral blood was the graft source in 99% of both cohorts. GVHD prophylaxis differed, with more frequent ATG (66% vs. 45%) and less frequent alemtuzumab use (13% vs. 32%; p = 0.004) in TP53-altered patients, although calcineurin inhibitor-based prophylaxis predominated in both groups. Using relapse and death before chronic GVHD as competing events, the 5-year cumulative incidence of chronic GVHD was lower in TP53-altered patients than in TP53-wild-type patients (20.3% vs. 42.6%; Gray’s test p = 0.002; Supplementary Fig. 1). This difference should be interpreted cautiously, as the higher frequency of early relapse and death in the TP53-altered cohort reduces the opportunity to develop or observe chronic GVHD.
TP53 mutation landscape and genomic co-alterations
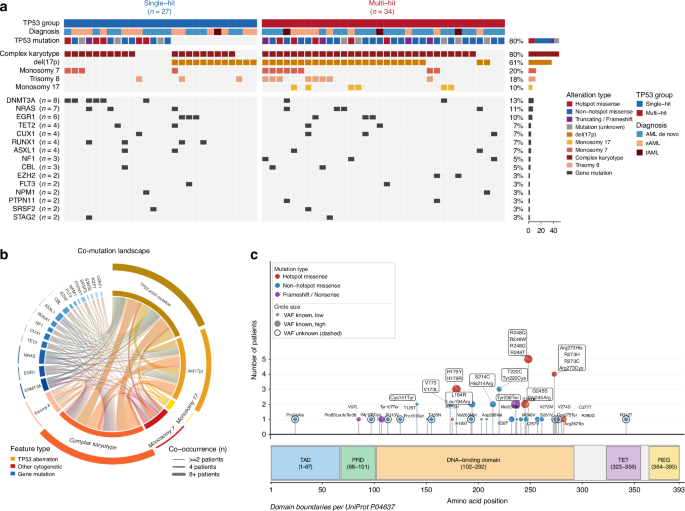
In the full cohort of 61 patients, TP53 aberrations were classified as single-hit or multi-hit according to the presence of a second hit, defined as a biallelic mutation, del(17p), monosomy 17, or VAF ≥ 50% (Fig. 1A). Overall, 27 patients had single-hit disease, including 15 with an isolated point mutation and 12 with deletion-only TP53 aberrations, while 34 had multi-hit disease. Complex karyotype was the most frequent cytogenetic feature (n = 49, 80%), followed by del(17p) (n = 37, 61%), monosomy 7 (n = 12, 20%), and trisomy 8 (n = 11, 18%). Co-mutations were identified in 37 of 61 patients (61%), most frequently involving DNMT3A (n = 8, 13%), NRAS (n = 7, 11%), and EGR1 (n = 6, 10%), followed by ASXL1, CUX1, RUNX1, and TET2 (each n = 4, 7%), NF1 and CBL (each n = 3, 5%), and EZH2, FLT3, NPM1, PTPN11, SRSF2, and STAG2 (each n = 2, 3%). TP53-specific aberrations formed the dominant hub of pairwise co-occurrences across the cohort (Fig. 1B). TP53 point mutations clustered predominantly within the DNA-binding domain (amino acids 102–292), consistent with the canonical biology of TP53 in AML (Fig. 1C) [7]. The most frequently mutated codon was R248 (n = 5), followed by R273 (n = 4), H179 (n = 3), and Y220 (n = 3); V173 was affected in two patients. Hotspot missense mutations at codons R175, H179, G245, R248, R273, and R282 were identified in 16 patients in total. Non-hotspot missense mutations were the most common class (n = 33 mutation entries), while truncating or frameshift mutations were rare (n = 4). Twelve patients harboured a TP53 deletion without a detectable point mutation.
Fig. 1: Genomic landscape of TP53-altered AML after allo-HCT.
a Oncoprint of TP53-altered AML patients undergoing first allo-HCT (n = 61). Columns represent individual patients ordered by TP53 aberration class (single-hit, n = 27; multi-hit, n = 34). Upper annotation tracks indicate TP53 aberration class and diagnosis. Rows display TP53 mutation type, cytogenetic features, and co-mutated genes ordered by frequency. Coloured tiles indicate presence of the respective alteration; grey indicates absence. b Chord diagram showing pairwise co-alteration co-occurrence across all 61 patients. Chord width is proportional to the number of patients sharing both alterations. Only feature pairs co-occurring in two or more patients are displayed. c Lollipop plot of somatic TP53 point mutations. Each lollipop represents a unique mutation; height indicates the number of patients harbouring that variant, and circle size is proportional to VAF where available. Protein domains and canonical hotspot codons are annotated. Patients harbouring del(17p) without a detectable TP53 point mutation are not represented in this panel.
Outcomes of TP53-altered AML compared to TP53-wild-type controls
To contextualise outcomes of TP53-altered AML after allo-HCT, we compared the 61 TP53-altered patients to the 636 TP53-wild-type controls with a 5-year follow-up horizon (Fig. 2, Table 2). TP53-altered patients had markedly inferior OS (log-rank p < 0.001; Fig. 2A). Median OS was 379 days (~12.5 months) in the TP53-altered group versus 1694 days (~4.6 years) in the TP53-wild-type group. Five-year OS was 18% versus 50%, respectively.
Fig. 2: Survival, relapse, and non-relapse mortality according to TP53 status.
a Kaplan–Meier overall survival curves for TP53-altered (n = 61) and TP53-wild-type (n = 636) AML patients after first allo-HCT, censored at 5 years. Groups were compared using the log-rank test. b Cumulative incidence of relapse, with non-relapse mortality treated as a competing risk. Groups were compared using Gray’s test. c Cumulative incidence of non-relapse mortality, with relapse treated as a competing risk. Groups were compared using Gray’s test. Shaded areas represent 95% confidence intervals. These curves depict the overall consecutive transplant cohorts and provide a contextual, descriptive comparison.
Table 2 Post-transplant outcomes and causes of death.
Because disease status at transplant differed markedly between groups (Table 1), we performed disease-status-stratified sensitivity analyses. Among patients transplanted in CR, TP53-altered AML remained associated with inferior OS compared with TP53-wild-type AML, although the TP53-altered CR subgroup was small (n = 12 vs. n = 274; 5-year OS 14.4% vs. 64.0%; log-rank p < 0.001; Supplementary Fig. 2). A consistent association was observed among patients not in CR at transplant (n = 49 vs. n = 362; median OS 11.8 vs. 27.5 months; 5-year OS 20.1% vs. 39.1%; log-rank p = 0.001). Competing-risk analyses showed a higher 5-year relapse incidence in TP53-altered patients irrespective of remission status at transplantation (CR: 61.7% vs. 25.7%, Gray’s test p = 0.012; not in CR: 55.8% vs. 38.7%, Gray’s test p = 0.010), whereas NRM did not differ significantly in either stratum (both p ≥ 0.524; Supplementary Fig. 2). NRM was numerically lowest in the most recent era (Supplementary Fig. 3). Overall, inferior survival was driven predominantly by higher relapse burden. Five-year CRI was 55% in TP53-altered patients versus 33% in TP53-wild-type controls (Gray’s test p < 0.001; Fig. 2B), with divergence apparent within the first six months after transplantation. In contrast, NRM did not differ significantly between groups (5-year NRM 28.5% vs. 23%; Gray’s test p = 0.426; Fig. 2C). Together with the higher relapse incidence, the absence of a significant NRM difference suggests that the survival disadvantage was predominantly relapse-associated.
Post-transplant relapse-directed and maintenance/pre-emptive therapies
Relapse-directed therapy was administered to 189/636 TP53-wild-type patients (29.7%) and 25/61 TP53-altered patients (41.0%; Fisher’s exact p = 0.081; Fig. 3A). TP53-altered patients more frequently received hypomethylating agents and venetoclax, whereas the other treatment classes did not differ significantly after multiplicity correction (Fig. 3B). Across transplant eras, use of DLI, classical chemotherapy, targeted therapy, and second allo-HCT decreased, while venetoclax use increased (Fig. 3C). Maintenance or pre-emptive interventions were recorded in both cohorts. In TP53-wild-type patients, the most frequent interventions were DLI (75/636, 11.8%) and targeted therapy (48/636, 7.5%), whereas immunotherapy, classical chemotherapy, HMA, and intrathecal therapy were uncommon. In the TP53-altered cohort, maintenance/pre-emptive treatment comprised DLI in 4/61 patients (6.6%), HMA in 1/61 (1.6%), and venetoclax in 1/61 (1.6%). Among patients with evaluable follow-up after relapse-directed therapy, median OS from treatment initiation was 52 days in TP53-altered versus 260 days in TP53-wild-type patients (log-rank p < 0.0001; Fig. 3D).
Fig. 3: Post-transplant relapse-directed therapies according to TP53 status and transplant era.
a Proportion of patients receiving at least one relapse-directed therapy in the TP53-wild-type and TP53-altered cohorts; groups were compared using Fisher’s exact test. b Frequencies of individual relapse-directed therapy classes by TP53 status. Patients could contribute to more than one class but were counted only once per class. P-values were calculated using Fisher’s exact test and adjusted for multiple comparisons using the Benjamini–Hochberg method. c Distribution of relapse-directed therapy classes by transplant era. d Kaplan–Meier estimates of overall survival from initiation of the first relapse-directed therapy. Shaded areas represent 95% confidence intervals, and groups were compared using the log-rank test.
Multivariable analysis of overall survival in the combined cohort
To assess the independent prognostic impact of TP53 alteration status on OS, we performed a multivariable Cox proportional hazards analysis in the combined cohort of 697 patients (Fig. 4). The model included 368 events (EPV = 28.3), satisfying conventional adequacy thresholds. TP53 alteration status was the strongest independent predictor of inferior OS (HR 2.54, 95% CI 1.77–3.64; p < 0.001). Transplant era was a significant prognostic factor, with patients transplanted in Era 2 (2013–2018) and Era 3 (2019–2025) having significantly better outcomes than those in Era 1 (2007–2012; HR 0.67, 95% CI 0.53–0.84 and HR 0.5, 95% CI 0.36–0.68, respectively), consistent with improvements in transplant practice over time. Mismatched donor (HR 1.6, 95% CI 1.27–2.01; p < 0.001), patient age ≥60 years (HR 1.55, 95% CI 1.19–2.01; p = 0.001) and Karnofsky performance score <80% (HR 1.44, 95% CI 1.09–1.89; p = 0.009) were each independently associated with inferior OS, whereas remission at transplant (HR 0.55, 95% CI 0.43–0.71; p < 0.001) was independently associated with superior OS. Male sex, sex mismatch, non-MAC conditioning, donor age ≥30 years and tAML/sAML were not independently prognostic. The model demonstrated adequate discrimination (C-index 0.68) and the proportional hazards assumption was satisfied for all covariates. The TP53 association also remained significant after adding inferred cytogenetic risk (HR 1.84, 95% CI 1.25–2.72; p = 0.002) or replacing disease status with inferred rDRI (HR 1.90, 95% CI 1.30–2.77; p < 0.001; Supplementary Fig. 4). Adverse cytogenetic risk and high/very-high rDRI were also associated with inferior OS. Within the TP53-altered cohort, no individual cytogenetic abnormality was significantly associated with OS; the exploratory genetic analyses are shown in Supplementary Fig. 5. Additionally, within the TP53-altered cohort, patients transplanted in remission showed a numerically improved OS compared to those transplanted with active disease; however, this difference did not reach statistical significance (log-rank p = 0.16; data not shown).
Fig. 4: Multivariable Cox model for overall survival after allo-HCT.
Forest plot of the multivariable Cox proportional hazards model for OS in the combined cohort (n = 697; events = 368). Points represent hazard-ratio estimates and horizontal lines represent 95% confidence intervals. The model included TP53 alteration status, diagnosis, disease status at transplantation, patient sex, Karnofsky performance score, patient age, donor age, conditioning intensity, donor matching, patient–donor sex mismatch, and transplant era. Reference categories were de novo AML, TP53-wild-type disease, active disease at transplantation, female sex, Karnofsky performance score ≥80%, patient age <60 years, donor age <30 years, MAC conditioning, no patient–donor sex mismatch, matched donor, and transplant era 1 (2007–2012). Harrell’s C-index was 0.68.
Unsupervised clustering: del(17p)-enriched vs. TP53 mutation-enriched subgroups
To explore heterogeneity within TP53-altered AML, we performed hierarchical clustering using 14 clinical and genomic variables in 61 Freiburg patients and incorporated seven unique Graz patients as a second-centre robustness assessment (combined n = 68; Fig. 5A and Supplementary Table 1). Silhouette analysis favoured k = 2 (score = 0.284). An outcome-blind principal component analysis (PCA) projection of the same input matrix, which was not used for cluster assignment, separated C1 and C2 along the first two principal components (Fig. 5B), providing internal support for the identified structure but not independent validation.
Fig. 5: Exploratory clustering of TP53-altered AML after allo-HCT.
a Clinical and genomic heatmap of the combined Freiburg/Graz TP53-altered cohort (n = 68), generated by unsupervised hierarchical clustering using Ward’s D2 linkage and Manhattan distance. Columns represent individual patients ordered by the clustering dendrogram; rows show the 14 variables entered into clustering. Binary features are displayed in grey scale and continuous variables as z-scores. Annotation tracks indicate cluster assignment, centre, long-term survivor status, and CR at transplantation. Biallelic/multi-hit TP53 status was not entered as an independent clustering variable. b Principal-component projection of the same 14-variable clustering matrix. Points represent individual patients, coloured by cluster and shaped by centre; transparent ellipses are visual aids only and were not used for cluster assignment. c Proportion of patients in each cluster harbouring selected binary features. P-values were calculated using Fisher’s exact test. d Distribution of co-mutation burden per cluster, categorised as none, one, or two or more co-mutated genes. P-value was calculated using the Kruskal–Wallis test. e Kaplan–Meier estimates of overall survival by cluster, administratively censored at 60 months. Groups were compared using the log-rank test; the permutation p-value is shown as an additional exploratory robustness statistic. The clustering analysis was performed without survival information and should be interpreted as exploratory.
The two clusters were principally distinguished by the relative contribution of del(17p) versus TP53 point mutation status. TP53 point mutation was present in all patients in Cluster 2 but in none in Cluster 1 (p < 0.001), whereas del(17p) was present in all patients in Cluster 1 and in 46% of Cluster 2 (p < 0.001) (Fig. 5C). Co-mutation burden did not differ significantly between clusters (Fig. 5D). Kaplan–Meier analysis censored at 60 months showed inferior OS in Cluster 1 compared to Cluster 2 (log-rank p = 0.021; Fig. 5E). One-year OS was 17% in Cluster 1 versus 65% in Cluster 2; 2-year OS was 8% versus 40%, respectively. Median OS was 5.7 months in Cluster 1 versus 15.1 months in Cluster 2. In the combined cohort (n = 68), competing-risk analysis administratively censored at 24 months showed numerically higher early relapse and NRM in C1 than in C2 (24-month relapse: 58.3% vs. 48.1%; 24-month NRM: 33.3% vs. 18.7%), although between-cluster differences were not statistically significant (Supplementary Fig. 6). To explore commonalities among long-term survivors, we compared evaluable patients with survival/follow-up ≥24 months (n = 13) with patients who died before 24 months (n = 38) in the combined Freiburg/Graz TP53-altered cohort; no baseline feature clearly defined long-term survival, although long-term survivors (LTS) were directionally enriched for C2/TP53 point-mutated disease and had significantly fewer relapses before 24 months (Supplementary Fig. 7). These findings remain exploratory because of the small size of C1 and require external validation.
