


Baseline characteristics and treatment
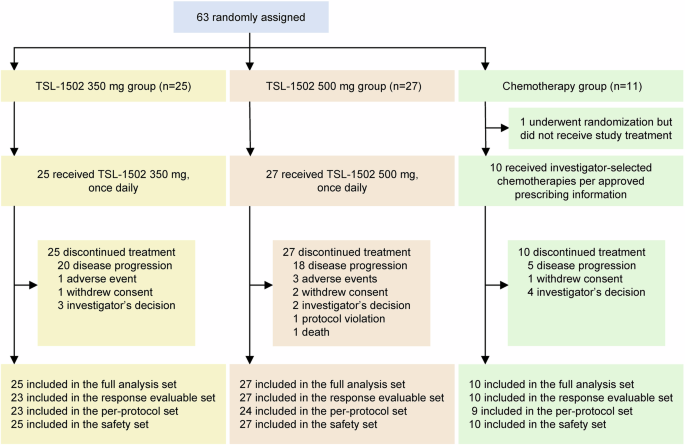
Between August 18, 2022, and March 5, 2024, 63 patients were enrolled and randomized: 25 were assigned to the TSL-1502 350 mg group, 27 to the TSL-1502 500 mg group, and 11 to the chemotherapy group. In the chemotherapy group, one patient did not receive the study treatment and was thus removed from all the datasets. The RES included 60 patients because two patients did not have baseline target lesions. The PPS included 56 patients, 6 of whom were excluded, and the detailed reasons are available in Supplementary Table 6. All patients had completed the study at the data cutoff date (March 31, 2025; Fig. 1). Twenty patients (80.0%) in the TSL-1502 350 mg group, 21 patients (77.8%) in the 500 mg group, and 6 patients (60.0%) in the chemotherapy group subsequently received anticancer therapy. Among these, 6 patients received subsequent treatment with other PARP inhibitors, including 1 patient (4.0%) in the 350 mg group, 2 patients (7.4%) in the 500 mg group, and 2 patients (20.0%) in the chemotherapy group (Supplementary Table 7).
Fig. 1
Trial profile in the phase 2 study
The median treatment cycle was 7.0 (range, 2.0–34.0) in the TSL-1502 350 mg group, 8.0 (range, 1.0–23.0) in the TSL-1502 500 mg group, and 8.0 (range, 1.0–24.0) in the chemotherapy group (Supplementary Table 8). The median dose intensity was 44,450.0 mg (range, 14350.0–248800.0) in the TSL-1502 350 mg group and 69,200.0 mg (range, 5200.0–231500.0) in the TSL-1502 500 mg group. In the chemotherapy group, 90% of patients received eribulin mesylate at a median dose intensity of 30.8 mg (range, 8.0–118.0), while the remaining 10% received capecitabine at a median dose intensity of 12,600.0 mg (range, 12600.0–12600.0). The median age of the 62 treated patients was 48.5 years (range, 29.0–68.0), and 31 (50.0%) patients had TNBC. As shown in Table 1, baseline characteristics were generally balanced across the three groups.
Efficacy
In the FAS, the ORR was numerically highest in the TSL-1502 500 mg group (55.6%; 95% CI, 35.3–74.5), compared with 36.0% (95% CI, 18.0–57.5) in the 350 mg group and 40.0% (95% CI, 12.2–73.8) in the chemotherapy group (Table 3, Fig. 2a). The DCR was 84.0% (95% CI, 63.9–95.5) in the TSL-1502 350 mg group, 88.9% (95% CI, 70.8–97.6) in the TSL-1502 500 mg group, and 60.0% (95% CI, 26.3–87.8) in the chemotherapy group. The median DoR was 5.6 months (95% CI, 2.7-not assessable [NA]), 9.9 months (95% CI, 2.9–14.2), and not reached (95% CI, 3.9-NA) in the respective groups (Fig. 2b and Supplementary Fig. 1). The results of the ORR and DCR in the RES (Table 3) and PPS (Table 9) were generally consistent with those in the FAS.
Fig. 2
Efficacy of TSL-1502 in the full analysis set in the phase 2 study. a Waterfall plot. Two patients in the TSL-1502 350 mg group were not included in the waterfall plot because of the absence of tumor assessment data at the time of best overall response. b Swimmer plot. c Kaplan‒Meier estimates for PFS. d Kaplan‒Meier estimates for OS. Data cutoff date: March 31, 2025. The log-rank test was used for between-group comparisons; p values were two-sided. PFS progression-free survival, OS overall survival, CI confidence interval. *The reduction in target lesions met the threshold for partial response, but because the response was not confirmed, these patients were classified as having stable disease according to RECIST v1.1
Table 3 Efficacy outcomes in the full analysis set and response evaluable set in the phase 2 study
Subgroup analysis revealed that the ORR in patients with TNBC was 33.3% (95% CI, 9.9–65.1), 42.9% (95% CI, 17.7–71.1), and 20.0% (95% CI, 0.5–71.6), respectively (Supplementary Table 10). Among the patients who had received ≤1 line of chemotherapy, the ORR was 53.3% (95% CI, 26.6–78.7) in the TSL-1502 350 mg group, 68.4% (95% CI, 43.5–87.4) in the TSL-1502 500 mg group, and 42.9% in the chemotherapy group (95% CI, 9.9–81.6). An exploratory analysis revealed that there was no apparent difference in HRD scores between patients who achieved an objective response and those who did not (Supplementary Fig. 2).
With a median follow-up of 14.8 months (range, 2.3–25.3), disease progression or death had occurred in 35 patients. Median PFS was 5.6 months (95% CI, 4.0–8.2) in the TSL-1502 350 mg group, 8.8 months (95% CI, 5.7–NA) in the TSL-1502 500 mg group, and 9.2 months (95% CI, 1.4–NA) in the chemotherapy group (Fig. 2c). The 12-month PFS rates were 20.4% (95% CI, 6.1–40.7), 47.3% (95% CI, 23.1–68.2), and 37.0% (95% CI, 6.8–69.3), respectively. With respect to OS, 21 patients died, and the median OS was 17.4 months (95% CI, 9.1–NA), not reached (95% CI, 16.9–NA), and 19.8 months (95% CI, 9.2–NA) in the respective groups (Fig. 2d). The results of PFS and OS observed in the RES (Supplementary Fig. 3) were similar to those in the primary analysis.
Safety
Safety data are summarized in Table 4 and Supplementary Tables 11–12. Treatment-related adverse events (TRAEs) occurred at 92.0%, 100.0%, and 100.0% of patients, with 60.0%, 59.3%, and 80.0%, respectively, at a severity of grade 3 or higher. Anemia was the most common grade 3 or higher hematological TRAE in the TSL-1502 treatment groups (350 mg, 32.0%; 500 mg, 37.0%), while a decreased neutrophil count was most common in the chemotherapy group (70.0%).
Table 4 Summary of treatment-related adverse events in the phase 2 study
In the TSL-1502 350 mg group and the TSL-1502 500 mg group, 4 (16.0%) and 5 (18.5%) patients experienced severe TRAEs, respectively. Treatment interruption due to TRAEs occurred in 14 patients (56.0%) in the TSL-1502 350 mg group, 18 patients (66.7%) in the TSL-1502 500 mg group, and 3 patients (27.3%) in the chemotherapy group. Dose reduction due to TRAEs occurred in 2 (8.0%) patients in the TSL-1502 350 mg group and 2 (11.1%) patients in the TSL-1502 500 mg group. Three (11.1%) patients in the TSL-1502 500 mg group discontinued treatment because of TRAEs, and no treatment-related deaths were reported in any treatment group. Two patients died because of treatment-emergent adverse events—one in the TSL-1502 350 mg group, in which respiratory failure resulted from tumor progression complicated by severe pulmonary infection and pleural and pericardial effusions, and one in the TSL-1502 500 mg group, in which preexisting comorbidities led to an acute cerebral infarction that subsequently resulted in respiratory failure. Both deaths were considered unrelated to TSL-1502.
In addition, limited PK analyses were conducted in a subset of patients during cycle 1. The observed exposure levels were generally consistent with previously reported data (Supplementary Figs. 4 and 5).
