


Synthesis and characterization
A novel organic ligand, (E)-6-(2-(1-(pyridin-4-yl)ethylidene)hydrazineyl)-1,3,5-triazine-2,4-diamine (L), was synthesized in three steps, using cyanuric chloride as the raw substance (Scheme 1). The first step involves substituting two chlorine atoms from the cyanuric chloride with two amine groups using ammonium hydroxide as a reagent, at a temperature ranging from 0 to 40 °C. In the second step, the third chlorine atom is replaced with hydrazine, which is achieved by refluxing overnight at 85 °C. The third step involves the preparation of the Schiff base by reacting the previous compound with 4-acetylpyridine, using methanol as the solvent with stirring overnight at room temperature. At the end, the target organic compound (L) was obtained with high purity and a yield of 75%. Following that, this synthesized organic compound was used to prepare two metal complexes (Scheme 1) via the self-assembly technique. The two complexes were prepared as crystals and then analyzed using single crystal XRD, NMR, FT-IR, and elemental analyses. In the two complexes, the ligand is found to be protonated at one of its N-atoms leading to the cationic formula (HL+). Notably, the protonation of the ligand occurred without the addition of any external acid, utilizing an aqueous ethanolic solution during synthesis. This finding correlates with literature29 indicating that the coordination of a d10 metal ion such as Zn²⁺ to water clusters enhances their acidity, leading to unimolecular proton release.
Scheme 1
Reactions pathways illustrating the synthesis of L and its two complexes; (a) NH4OH, acetone/ water, 0–40 °C, 1 h; (b) NH2-NH2.H2O, water, 85 °C, overnight; (c) 4-acetylpyridine, methanol, rt, overnight.
FT-IR spectra
Notable shifts are observed in the FT-IR spectrum of both the complexes when compared to the free ligand L (Figs. S1–S3). For L, the N-H stretching vibrations of NH2 is represented by two peaks at 3364 and 3196 cm−130. These relatively sharp peaks appeared at 3432 and 3346 cm−1 in case of 1, while are observed at 3318 and 3216 cm−1 in 2. In addition, the C=N stretching vibrations are observed at 1584 and 1540 cm−1 for L. These peaks appeared at 1586 and 1541 cm−1 in case of 1, indicating that the azomethine group does not participate in the coordination31. In contrast, the C=N stretching modes in 2 are shifted to higher wavenumbers of 1628 and 1593 cm−1, supporting the involvement of the azomethine group in the coordination32. These findings are in agreement with the proposed X-ray structures. The C=C stretching vibrations are present at 1478 cm−1 for L and at 1532 cm−1 for 2, whereas in 1, this peak splits into two bands at 1491 and 1463 cm−1. Furthermore, 2 shows a sharp peak at 1377 cm−1, indicating the presence of NO3− group33. Additionally, a new peak at 3517 cm−1 arises from the O-H stretching vibration of a half ethanol molecule in 1.
NMR spectra
The NMR analysis confirmed the structure of the synthesized ligand (L) and the two complexes (Figs. S4–S9). 1H NMR spectra of L, 1 and 2 were measured in DMSO-d6 and DMSO-d6/D2O. Chemical shift changes were observed when comparing the ligand’s spectrum with those of the two complexes, confirming the coordination with the metal ion34,35. L displays a signal at δ 9.57 ppm, which is attributed to the NH proton. Notably, this signal shifts to δ 9.97 and 10.74 ppm in complexes 1 and 2, respectively. Additionally, the signal found at δ 6.37 ppm for L is attributed to –NH2 protons. In the spectrum of 2, this signal shifts to δ 7.22 ppm, whereas in 1 it appears at δ 6.56 ppm. The peaks related to the NH and NH2 proton of the ligand and its two complexes are exchangeable with D2O as shown in Figs. S4–S6. For L, the signals between δ 8.54 and 7.66 ppm are assigned to the CH protons of the pyridine moiety. These signals shifted to δ 8.55–7.77 ppm in 1, while they appeared in the range of 8.18–7.60 ppm in 2. Moreover, the coordination of Zn(II) and Ag(I) ions with L was further evidenced by the observed shifts in their 13C NMR spectra compared to the free ligand L36,37 (Figs. S7–S9). The triazine carbons in L, observed at δ 167.9 and 165.9 ppm, exhibit slight shifts to δ 167.5 and 165.4 ppm in 1 and substantial shifts to δ 166.1 and 163.6 ppm in 2. These shifts are consistent with the involvement of the triazine moiety in coordination with the Ag(I) ion in 2. In L, the C=N (Schiff base residue) resonates at δ 150.2 ppm, remaining nearly unchanged at δ 150.3 ppm in 1, but shifting downfield to δ 151.5 ppm (Δδ = 1.3 ppm) in 2. This downfield displacement indicates coordination of the azomethine nitrogen38,39 to the Ag(I) center in 2. Additionally, the pyridine carbons at δ 146.4, 144.1, and 120.7 ppm in L are shifted to δ 147.4, 121.7, and 100.0 ppm in 1 and δ 148.2, 122.8, and 100.0 ppm in 2. The carbon of the methyl group at δ 13.3 ppm in L exhibits downfield at δ 13.5 and 16.5 ppm in 1 and 2, respectively.
The observed changes in the ¹H NMR and 13C NMR chemical shifts can be attributed to two possible factors: (i) metal-ligand coordination (ii) protonation of the organic ligand. Both factors affect the ligand’s electronic environment leading to some variations in the NMR chemical shifts. It is well established in the literature that Ag(I) complexes with N-heterocyclic ligands typically exhibit minimal changes in ¹H NMR chemical shift (≤ 0.06 ppm) upon coordination35,40, a behavior attributed to the relatively weak Ag-N and Ag-O contacts41. In contrast, significantly larger shifts were observed in the present study. Therefore, the presence of the protonated ligand in solution is likely a main contributing factor to these unexpectedly significant chemical shift variations. The detailed structural analysis of the two complexes, along with the existence of the ligand in a protonated cationic form (HL+), was confirmed through single crystal X- ray studies.
X-ray structure description
Structure of [Zn(HL)Cl3] complex (1)
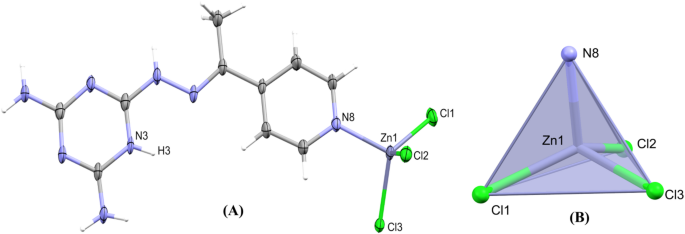
Single-crystal XRD technique revealed that 1 (CCDC 2518341) crystallizes in the monoclinic crystal system with the C2/c space group (Table S1). The asymmetric formula of this complex is represented as [Zn(HL)Cl3].0.5C2H5OH. Since the half ethanol molecule was heavily disordered, it was removed using the PLATON SQUEEZE procedure42. As a result, the formula [Zn(HL)Cl3] is used to describe the crystal data of complex 1 (Fig. 1). As illustrated in this figure, the ligand (L) is found protonated at N3 atom of the s-triazine moiety leading to the cationic formula (HL+). As a result, the pyridyl N-atom of HL+ is the donor atom which is found coordinated with Zn(II) center. In addition, three Cl− ions complete the coordination sphere resulting in a neutral tetra-coordinated [Zn(HL)Cl3] formula. Table 1 provides a list of the specific bond distances and angles.
Fig. 1
X-ray structure showing atom numbering (A) and the distorted tetrahedral configuration (B) of [Zn(HL)Cl3] complex (1). ORTEP diagram, illustrating thermal ellipsoids at 50% probability level, is shown in Fig. S10.
The Zn-N(pyridine) bond distance is 2.050(2) Å, while the Zn-Cl bond distances range from 2.2264(7) to 2.2759(6) Å. The Zn–N and Zn–Cl bond lengths are very close to those of the complexes previously reported by Yu et al.16, and Smolková et al.43. On the other hand, the four donor atoms form bond angles range from 102.91(6) to 115.43(3)º (Table 1), where the smallest and largest angles are N8-Zn1-Cl3 and Cl1-Zn1-Cl2, respectively, deviating from the ideal value of 109.5º, indicating a distortion from the conventional tetrahedral geometry. Additionally, the τ444 and τ4′45 geometric indices, which assess the degree of distortion in tetra-coordinated structures, are estimated to be 0.93 and 0.92, respectively, further confirming this slight distortion Fig. 1B. The τ4 value is comparable to that of the [Zn(HL)Cl3] complex (L = 1-(4-(1H-Imidazol-1-yl)benzyl)-1H-1,2,4-triazole), which has a τ4 value of 0.94 16. On the other hand, the crystal packing of 1 is stabilized by one N-H···N and a number of N-H···Cl intermolecular hydrogen bonds besides C-H···Cl interactions as illustrated in Fig. 2. All the hydrogen bond specifications are found in Table S2. For the N-H···N hydrogen bond, the interaction takes place between the N(s-triazine) and the hydrogen atom of one of the two amino groups, with an H···N distance of 2.10 Å for the N4-H4B···N1. The respective donor (D)···acceptor (A) distance is 2.953(3) Å. The C-H···Cl interactions occurs between the pyridyl C-atoms (C10) acting as the hydrogen bond donor and the coordinated Cl3 atom as the hydrogen acceptor, with a donor-acceptor distance of 3.534(3) Å. In contrast, the N-H···Cl interactions are in the range of 2.45 to 2.58 Å for N4-H4A···Cl2 and N5-H5B···Cl2, respectively.
Table 1 Chosen bond distances (Å) and angles (º) of 1.Fig. 2
Hydrogen bond contacts (upper) and crystal packing (lower) of 1. The purple and turquoise dotted lines refer to Cl···H and N···H interactions, respectively.
Moreover, π···π stacking connections between s-triazine and pyridine rings with distances equal to 3.322 and 3.324 Å for C1···C8 and C2···C6, respectively, further strengthen the crystal structure of complex 1 (Fig. 3A). The centroid-to-centroid separation is 3.635 Å.
It’s also important to point out that there are a significant number of anion···π contacts were observed in 1 as shown in Fig. 3. All details regarding these short contacts are depicted in Table S3. For the Cl···C interactions shown in Fig. 3B, the shortest distances are between the chloride anion and C(s-triazine), specifically Cl3···C3 (3.316 Å) and Cl3···C1 (3.409 Å). In addition, there are five Cl···N interactions (Fig. 3C), the shortest interactions are Cl2···N4(amino), Cl3···N3(s-triazine), and Cl3···N5(amino), with distances of 3.180, 3.240, and 3.254 Å, respectively.
Fig. 3
π···π stacking (A), anion···π contacts (B and C) of 1. Hydrogen atoms have been excluded for better visibility.
Structure of [Ag4(HL)2(NO3)6]n complex (2)
Complex 2 (CCDC 2518342) crystallizes in the triclinic crystal system with space group P-1 (Table S1) showing interesting 3D polymeric. Unlike complex 1, both the organic ligand units in 2 are protonated at the nitrogen atom of the pyridyl moiety leading to the cationic HL+ ligand formula. Hence, all the s-triazine N-atoms are involved in the coordination with the four crystallographically non-equivalent Ag(I) ions which allowed the polymer expansion in case of 2. As a result, the asymmetric unit of 2 is completed by six nitrate groups to balance the net charge, leading to the neutral tetranuclear [Ag4(HL)2(NO3)6] (Fig. 4A). As illustrated in this figure, the two organic ligands are parallel but oriented in opposite directions. Specifically, the s-triazine ring in one organic ligand unit is parallel to the pyridine ring in the other HL+ unit. Figs. 4B and 4C showed the complete coordination environments and different geometries, respectively, around the four crystallographically independent Ag(I) ions in 2.
In Ag(I) complexes, various geometries often coexist within a single structure, such as mixed coordination numbers of 2 and 446, 3 and 447, or 6 and 748. However, our Ag(I) complex features a combination of 3, 4, and 5 coordination numbers (Fig. 4B). Some bond distances and angles for 2 are provided in Table 2. The first silver ion (Ag1) is coordinated by two N-atoms from the s-triazine (N9) and azomethine (N15) moieties of one organic ligand with bond lengths of 2.340(3) and 2.565(3) Å, respectively, while the bite angle N9-Ag1-N15 is 67.56(9)º. In addition, there is a slightly short Ag1-N1 bond with the s-triazine moiety from another HL+ ligand (Ag1-N1; 2.324(3) Å). The penta-coordination environment around Ag1 is completed by two O-atoms (O3# and O14), #-1+x,y,z, from two nitrate ions. Thus, based on the trigonality index proposed by Addison49, the geometry around Ag1 metal center is described as distorted square pyramidal (τ5 = 0.23).
Fig. 4
X-ray structure illustrating asymmetric unit (A), the complete coordination environments around Ag(I) centers (B) and the distorted geometries of [Ag4(HL)2(NO3)6]n complex 2 (C). ORTEP diagram, illustrating thermal ellipsoids at 50% probability level, is shown in Fig. S11. Symm. codes # -1+x,y,z; ## -x,2-y,1-z; ### 1+x,y,z.
The Ag2 center is tetra-coordinated being bonded to one s-triazine N-atom from HL+ ligand, in addition to three oxygen atoms from three different nitrate groups. The angles around the metal center range from 73.98(8) to 142.94(9)º (Table 2). Additionally, the values of the τ4 and τ4ˊ geometric indices, are estimated to be 0.55 and 0.54, respectively. Hence, the coordination geometry around Ag2 could be described as an intermediate between square planar and tetrahedron (Fig. 4C). Regarding Ag3 and Ag4, both are tri-coordinated with one nitrogen atom from s-triazine in addition to two oxygen atoms from two nitrate groups. The Ag3 and Ag4 silver centers exhibit a distorted trigonal planar geometry with angles range from 75.46(8)º to 137.07(9)º and from 68.15(8)º to 143.19(9)º for Ag3 and Ag4, respectively (Table 2). It has been noted that, all Ag–N(s-triazine) bond lengths in 2 are shorter than that reported for [Ag(BPAT)(ACN)]ClO450 complex (2.368(3) Å), where, BPAT = 2-amino-4,6-bis(3,5-dimethyl-1H-pyrazol-1-yl)-1,3,5-triazine.
Table 2 Coordinate bond lengths (Å) and angles (º) of 2
The 3D polymeric structure configuration of 2 is constructed via the coordination interactions between Ag(I) with both ligand groups (NO3− and HL+). Specifically, the s-triazine ring in one HL+ ligand forms the three coordinate bonds Ag1-N1, Ag2-N2, and Ag3-N3 which participate in the formation of the polymeric chains. Additionally, Ag2 from one unit is linked to Ag1 and Ag3 from another adjacent unit via two nitrate groups. Ag2 is bonded to Ag1 of another adjacent unit through Ag2-O1-N17-O3-Ag1 bridge, while Ag2 is bonded to Ag3 via Ag2-O16-N22-O17-Ag3 bridge as shown in Fig. 5A leading to a twelve-membered ring. As a result, infinite polymeric chain along the a-axis is formed, as illustrated in Fig. 5A. Furthermore, each two of these 1D infinite polymeric chains are oriented anti-parallel to each other, which enhances further connection via the Ag1-O14-N21-O13-Ag2 bridge. These results in the formation of an array extended through the a-direction (Fig. 5B).
Fig. 5
The extension of the infinite coordination polymer [Ag4(HL)2(NO3)6]n along a-axis (A) and the extended array along the same axis (B). All H-atoms are omitted for clarity.
Then through relatively strong Ag3···O9 (2.772 Å) and argentophilic Ag4···Ag4 (3.242 Å) contacts, the infinite polymeric chains along b and c directions are formed as displayed in Fig. 6. Moreover, Ag4···C18 (3.391 Å) contact enhances the polymeric extension along b-axis (Fig. 6). As a result, 3D coordination polymer of 2 is formed.
Fig. 6
Infinite polymeric chains of 2 along b and c-directions. All H-atoms are removed to enhance clarity.
Moreover, the crystal packing of 2 was stabilized by a large number of intermolecular hydrogen bonds forming a 3D net structure (Fig. S12). This large number of hydrogen bonds is mainly a result of the significant number of NO3− and NH2 groups within the coordination sphere of 2. In these interactions, the O-atoms of the NO3− groups act as hydrogen bond acceptor, while the hydrogen bond donors can be either nitrogen or carbon, as shown in Figs. S12A and S12B, respectively, and detailed in Table S4. When the protonated pyridine N-atom acts as the H-bond donor, the D-A distances are shorter (2.774(4) and 2.714(4) Å for N8-H8···O10 and N16-H16···O17, respectively) than those observed when the amino group serves as H-bond donor (D···A lengths ranged from 2.875(4) to 3.072(4) Å) as depicted in Table S4. On the other hand, the C-H groups from the methyl or pyridyl rings are the H-bond donor for the C-H···O contacts, as detailed in Fig. S12B and Table S4.
It is observed that, effective π···π stacking contacts between the s-triazine and pyridine moieties of HL+ are important in the molecular packing of 2 (Fig. 7). These interactions involve carbon-to-carbon and carbon-to-nitrogen contacts. As illustrated in Fig. 7, these stacking interactions occur both within and between the arrays extending along the a-direction. All details of these contacts are depicted in Table S5. The C12···C20 (3.211Å), C12···C19 (3.300Å), and N10···C20 (3.403Å) interactions occur between the arrays, while the other interactions take place within them (Fig. 7).
Fig. 7
π···π stacking interactions showing the C···C (A) and C···N (B) contacts of 2. All H-atoms are removed to enhance clarity.
It is noteworthy that there are a significant number of anion···π stacking interactions between the oxygen atoms of the NO3− groups with the C- and N- atoms of the π-system from the s-triazine and pyridine moieties (Fig. 8). The O1···C20 (3.160 Å) and O17···N16 (2.714) contacts (Table S5). Further insights into the packing and intermolecular interactions in both complexes can be gained through Hirshfeld analysis.
Fig. 8
Anion···π stacking: O···C (A) and O···N (B) in 2. All H-atoms are excluded for better visibility.
Hirshfeld surfaces
Hirshfeld analysis is studied to enhance our understanding of the supramolecular structure. It provides both qualitative and quantitative insights into the types of intermolecular contacts involved in the crystal packing. The analysis was performed on the asymmetric unit of both complexes. In [Zn(HL)Cl3] complex (1), the full 3D dnorm map and overall 2D fingerprint plot of the all interactions are shown in Fig. 9. The analysis reveals several prominent dark red areas in the dnorm map of complex 1 (Fig. 9), indicating strong interactions, particularly between the coordinated Cl− anion and hydrogen atoms. This is supported by sharp spikes in the fingerprint plots (Fig. S13), highlighting the Cl···H interaction as the most significant for the crystal packing of complex 1. Additionally, the N···H interaction is also notable, appearing as intense red spots (Fig. 9) and sharp spikes (Fig. S13), emphasizing its role in the supramolecular structure. Other critical interactions include Cl···C and C···C, which enhance the crystal stability of 1. In terms of molecular packing contributions, Cl···H interactions account for 37.2%, followed by H···H at 25.1% and N···H at 12.3% (Fig. 9). Additional contacts are observed in the crystal structure of 1; however, they are less significant in the molecular packing due to their longer interaction distances and are represented in Fig. 9.
Fig. 9
Full dnorm map (upper) shows significant contacts: (A) Cl···H, (B) N···H, (C) Cl···C, and (D) C···C, while the contributions of various interactions and the overall fingerprint plot are illustrated (lower) for complex 1.
The Cl···H, N···H, and Cl···C short contacts are illustrated in Fig. 10, along with their respective distances. The Cl···C interactions are due to the anion···π stacking interactions between the coordinated chloride ion and the carbon atoms of the s-triazine moieties in the organic ligand (HL+) as shown in Fig. 10C.
Fig. 10
Presentation of the shortest intermolecular interactions for Cl···H (A), N···H (B), Cl···C (C), and π···π stacking (D). The π···π stacking interactions also appeared as red/blue triangles in the shape index, and a flat green area in the curvedness map (lower). All contact distances are in angstroms.
Moreover, C···C interaction arises from π···π stacking between the C(s−triazine) and C(pyridine) are observed as red zones in the dnorm map (Fig. 10D). The red/blue triangles seen in the shape index map, along with the green flat areas on the curvedness map, further confirm the existence of aromatic π···π stacking contacts in 1 (Fig. 10). This is in agreement with what was mentioned in the crystal structure analysis of [Zn(HL)Cl3] complex (1).
For [Ag4(HL)2(NO3)6]n complex (2), the full dnorm map and the overall 2D fingerprint plot are illustrated in Fig. 11. The polymeric Ag-O interactions (7.8%) displayed as deep red areas (B) in the dnorm map (Fig. 11) and also as two distinct sharp spikes in the fingerprint map (Fig. S14), indicating that the coordination interactions between the Ag(I) and the O-atoms of the coordinated NO3− anions shows an important role in the extension of the 3D polymeric backbone of 2.
Fig. 11
Full dnorm map (upper) shows the most significant contacts: (A) O···H, (B) O-Ag, (C) O···O, (D) N···O, (E) N···H, (F) N···C, (H) C···C, (I) C···Ag, and (J) Ag···Ag., while the contributions of various interactions and the overall fingerprint plot are illustrated (lower) for complex 2.
In addition, the argentophilic (Ag4···Ag4 = 3.242 Å) contact, which enhances the infinite polymeric chains along b and c directions, as discussed in X-ray description, appears as a red spot (J) in the dnorm map (Fig. 11). Moreover, O···H hydrogen bonding interactions significantly contribute to the crystal stability of 2, as it appears as red spots (A) in the dnorm map (Fig. 11). This is also supported by the presence of two sharp spikes in its corresponding fingerprint plot (Fig. S14). This interaction represents the majority of the total Hirshfeld surface area (50.4%) followed by H···H interaction (10.1%) as shown in Fig. 11.
Interestingly, the C···C (2.1%) and O···N (6.6%) contacts reveal the value of the π···π and anion···π stacking contacts, respectively. In the former, this interaction occurs between the C(s-triazine) and C(pyridine) of the organic ligand (HL+) and confirmed by green flat surface patches in the curvedness map (Fig. S15). This figure illustrates the representation of this interaction as red dotted lines, in addition to their lengths.
The hydrogen-based interactions played a predominant role in their molecular packing. Comparing the two complexes, the interactions involving hydrogen atoms are more prevalent in complex 1 (81.3%) than 2 (69.2%). This is attributed to the 3D polymeric structure of 2, characterized by the presence of a proportion of coordinated contacts of Ag-O, Ag···C, as well as the argentophilic Ag···Ag interaction, which are responsible for the infinite polymeric extension of 2. Additionally, the propensity of specific atom pairs to form contacts within the crystal could be predicted using the enrichment ratio (EXY) calculations.
Enrichment ratio (EXY) analysis
The surface contact percentages obtained from Hirshfeld analysis of complexes 1 and 2 are utilized to calculate enrichment ratio (EXY)51, which help assess the tendency of atom pairs to form contacts within a crystal. EXY values greater than one indicates that these pairs have a strong tendency to form interactions within the crystal structure, whereas pairs with EXY values less than unity display a low prospect to interact. The calculated EXY values for the two studied complexes are tabulated in Table S6. In complex 1, The EXY values greater than 1 are observed for the Zn···N, Zn···H, Cl···H, Cl···C, N···N, N···C, and C···C interactions. In 2, the EXY ˃1 for the N···N, N···C, C···C, C···Ag, O···H, and O···Ag contacts. These findings highlight the increased probability of interactions occurring between these atom pairs. Conversely, the rest of interactions showed lower ability to form intermolecular interactions as shown in Table S6. Notably, the high EXY value of 6 for the C···C contact in the polymeric silver complex 2 indicates an exceptionally strong preference for this interaction.
NBO study
Natural charge determination
The charges at the metal center and its surrounding ligands were analyzed using natural charge calculations52 at the X-ray geometry. The ωB97XD method was employed to quantify the charge transfer from the organic ligand and anions as Lewis bases to the metal ion as a Lewis acid resulting from complexation. The resulting net natural charges at the metal ions and different ligands for both complexes are depicted in Table 3. In the [Zn(HL)Cl3] (1), there is a significant decrease in the charge of the Zn(II) to 0.9916 e. In this complex, the Zn(II) is coordinated by one protonated ligand (HL+) and three chloride anions. As a result, there are 1.0084 e transferred from these ligands to Zn(II). Furthermore, HL+ and the three chloride anions reduce the +ve charge on the Zn(II) ion by 0.0874 and 0.921 e, respectively. In the 3D polymeric [Ag4(HL)2(NO3)6]n complex (2), each crystallographically non-equivalent Ag(I) ion is analyzed individually, considering its full coordination environment. The calculated natural charges of the Ag(I) center in these units are 0.5657, 0.5518, 0.6223, and 0.6047 e for Ag1, Ag2, Ag3, and Ag4 unit, respectively, instead of + 1.0000 for the free silver ion. The natural charge on the silver atom in Ag1 and Ag2 units is lower than that in Ag3 and Ag4 units. This is attributed to a higher coordination number and the larger number of coordination anions in the former compared to the latter.
Table 3 The net natural charges at the metal ions, the coordinated anions and HL+ ligands for complexes 1 and 2 using ωB97XD methods.
Table 3 summarizes the effects of HL+ and nitrate groups on the positive charge reduction across different Ag units. In the first Ag unit, the two HL+ and the two nitrate groups reduce the Ag(I) charge by 0.1417 and 0.2926 e, respectively. In the Ag2 unit, these values are 0.0214 and 0.4268 e from one HL+ and three nitrate groups respectively. In the Ag3 and Ag4 units, the organic ligand transported 0.0680 e and 0.0688 e to the Ag(I) ion, respectively, while the two coordinated nitrate groups transferred 0.3097 e and 0.3265 e, respectively. In addition, the orbital–orbital interactions for the coordinated bonds around central metal ions were conducted using NBO interactions.
NBO interactions
The strength of contacts between the metal ion and various ligand molecules is evaluated by calculating the interaction energy (E(2)) based on second-order perturbation theory. All interactions between different orbitals involved in the coordinate bonds around Zn(II) and Ag(I) in complexes 1 and 2, respectively, are depicted in detail in Table S7. In complex 1, the Zn-Cl coordination interactions have very high interaction energy which indicates strong interaction with the coordinated chloride anions. The E(2) values are 100.02 kcal/mol (LP(4)Cl2→LP*(7)Zn1), 88.43 kcal/mol (LP(4)Cl3→LP*(6)Zn1), and 77.64 kcal/mol (LP(4)Cl4→ LP*(6)Zn1). Also, the Zn1-N8 interaction has a relatively high E(2) value (49.75 kcal/mol).
Additionally, it is crucial to note that the LP*(6) orbital of Zn(II) serves as the most significant anti-bonding natural orbital, contributing to all Zn-N and Zn-Cl interactions as tabulated in Table S7 and shown in Fig. 12. Furthermore, the LP*(6) anti-bonding NBO is the most occupied anti-bonding orbital with 0.3871 e, compared to the other acceptor NBOs (Table S8). It is found that, LP*(6)Zn primarily has s-orbital characters, while LP*(7)Zn and LP*(8)Zn have mainly p-orbitals character while LP*(9)Zn displays mainly a p-orbital character with a very little contribution from d-orbitals. As a result of these donor-acceptor interactions, the electronic configuration of Zn1 in 1 is [core]4 S(0.38)3d(9.98)4p(0.63)5p(0.01).
Fig. 12
The coordination between the donor and acceptor NBOs in 1.
In complex 2, it is clear that the interaction energies for the Ag-N (s-triazine) and Ag-O (nitrate anion) bonds are highest in the Ag4 unit, calculated to be 32.4 and 29.41 kcal/mol, respectively. The Ag3 unit follows closely with values of 32.39 and 28.08 kcal/mol. In contrast, the respective interaction energies are low in the Ag2 unit at 21.31 and 20.11 kcal/mol, and Ag1 unit has the lowest values of 16.62 and 13.88 kcal/mol. According to the literature, lower coordination numbers usually lead to stronger bonds for each ligand, since metal orbitals are concentrated in fewer M–L interactions, which minimizes mutual repulsion among ligands53,54. Important orbital-orbital interactions in the four Ag units are graphically presented in Figs. S16 and S17. Also, the LP*(6)Ag is the most occupied anti-bonding orbital compared to the other acceptor NBOs. Its occupancy values are 0.1916 e, 0.2075 e, 0.2217 e, and 0.2358 e for Ag1, Ag2, Ag3, and Ag4 unit, respectively (Table S8, Supplementary Data). Within the four units, LP*(6)Ag anti-bonding NBO has mainly s-orbital contributions while the LP*(7)Ag, LP*(8) and LP*(9) have p-orbitals contributions with some d-orbitals character. It is observed that Ag3 and Ag4 units have almost similar E(2) values and orbital-orbital interactions (Fig. S17). This could be due to the similar coordination environment around silver atom in the two units.
Cytotoxicity assay
The cytotoxicity of L and its complexes is evaluated in vitro against hepatocellular (HepG-2) and breast (MCF-7) carcinoma cell lines in addition to human lung fibroblast (WI-38) normal cell line. Their activities were investigated using the MTT colorimetric assay method. The IC50 value, defined as the concentration needed to reduce cancer cell growth by 50%55, indicates the level of cytotoxicity of the compound under investigation. The IC50 results are summarized in Table 4 (µM) and Table S9 (µg/mL), while further details are provided in Tables S10-S12. Complex 2 has demonstrated promising efficiency against both selected cancer cell lines. The IC50 value against the HepG-2 cell line is 9.96 ± 0.35 µM, while for the MCF-7 cell line, it is 15.84 ± 0.46 µM. These values are significantly lower than those of cis-platin, a standard cancer medications, which has IC50 values of 62.44 ± 1.99 µM for HepG-2 and 63.43 ± 2.32 µM for MCF-756. This aligns with the literature indicating that many of silver metal complexes are more effective as anticancer agents for treating different types of cancer compared to cis-platin22,23. The enhanced potency of 2 can be attributed to the presence of four silver centers21. In comparison to the free ligand, complex 2 also demonstrates markedly lower IC50 values. The free ligand has IC50 values of 1243.92 ± 42.91 µM and 1719.44 ± 59.61 µM against HepG-2 and MCF-7 cells, respectively. Moreover, 1 demonstrates very high anticancer activity compared to the free ligand (L) against both cancer cell lines. Its IC50 values are 239.64 ± 12.77 µM for HepG-2 and 281.82 ± 8.52 µM for MCF-7. In conclusion, complex 2 displays superior potency against both cancer cell lines, being around 125, 24, and 6 times more effective than L, 1, and cis-platin against HepG-2 cell, respectively, as well as, 108, 18, and 4 times more effective against MCF-7 cell, respectively.
Based on the comparison of 1 with previously reported Zn(II)-s-triazine complexes, it is evident that 1 exhibits greater activity than [Zn(BPTMorph)(H2O)3](ClO4)257 complex, where, BPTMorph = 4-(4,6-bis(3,5-dimethyl-1H-pyrazol-1-yl)-1,3,5-triazin-2-yl) morpholine, against the same two cancer cell lines. The latter has IC50 of 273.58 ± 10.24 and 310.74 ± 8.34 µM against HepG-2 and MCF-7 cancer cell lines, respectively. Additionally, 1 demonstrates superior activity compared to [Zn(BPTMorph)(NO3)2]57 complex, which has an IC50 of 418.35 ± 10.59 µM against the MCF cancer cell line. Furthermore, 2 outperformed the previously reported polymeric [Ag(HL2)(OClO3)]n·nH2O complex58, where, HL2 = 3-aminopyrazine-2-carboxylic acid, against MCF-7 cells, which showed an IC50 value of 130.48 ± 2.66 µM, indicating eightfold greater cytotoxicity. Against HepG-2 cells, 2 showed slightly lower cytotoxicity compared to the [Ag(MTZ)2NO3] complex59(MTZ = 2-methyl-5-nitroimidazole-1-ethanol) which exhibited an IC50 of 8.03 ± 0.5 µM after 72 h of incubation.
Additionally, the ligand and its two complexes demonstrated great antiproliferative activity on cancer cells as indicated by a selectivity index (SI) greater than 1 for all compounds, as shown in Table 4. As the SI values increase, the effect on cancerous cells becomes more pronounced while inflicting minimal damage to normal cells. The highest SI values are observed for complex 2, with values of 4.1 against HepG-2 and 2.6 towards MCF-7 carcinoma cells. These results are slightly lower than those of cis-platin, which are 5.0 and 4.9, respectively (Table 4). The ability of zinc compounds to promote Lewis activation, nucleophile formation, and rapid ligand exchange underlies their catalytic activity in hydrolytic reactions, including DNA cleavage, which is relevant to antitumor effects60,61. However, the cytotoxicity mechanism of Ag(I) complexes primarily involves the release of intracellular Ag(I) ions in biological fluids, facilitated by weak Ag-N and Ag-O bonds41, which subsequently promote DNA and /or protein interaction62,63,64, apoptosis induction65, and enzyme inhibition66. Additionally, the biological study regarding the antimicrobial activity L and its complexes 1 and 2 has been evaluated.
Table 4 Cytotoxicity (IC50, µM) of the three compounds studied and cis-platin56
Antimicrobial assay
For in vitro antimicrobial activity, the synthesized ligand and its two complexes were tested against various pathogenic bacteria and fungi. The test was performed using the agar diffusion technique. The inhibition zone diameters and minimum inhibitory concentration (MIC) values of the investigated compounds are tabulated in Table 5. The results show that complex 2 exhibited a broad spectrum of antimicrobial activity against all tested microbial cell lines. L exhibited no activity against the Gram-positive bacteria; however, both complexes were effective against B. subtilis. Complex 2 has a promising inhibition zone diameter and MIC value of 27 mm and 3.71 µM, respectively, exceeding that of gentamicin (positive control), while 1 recorded a respective value of 20 mm and 354.97 µM. Additionally, complex 2 was the only one active against S. aureus exhibiting an inhibition zone diameter of 16 mm compared to 25 mm for gentamicin. The three compounds demonstrate activity against the two studied Gram-negative bacterial cell lines, with the exception of ligand L, which showed no effect on E. coli. Complex 2 exhibited superior efficiency compared to L and complex 1 against both studied Gram-negative bacteria. 2 inhibited E. coli and P. vulgaris at 22 and 13 mm, respectively. These results are very comparable to gentamicin, as indicated in Table 5. On the other hand, the L and complex 2 have moderate and similar activity against fungi, while 1 is found inactive. The inhibition zone diameters for L and complex 2 are 8 and 9 mm, respectively, against A. fumigates, while the diameter is 10 mm against C. albicans for both of them. The research revealed that the antibacterial efficacy of the metal complexes was primarily influenced by the metal ion, with zinc(II)27 and silver(I)35 complexes showing a stronger effect compared to their free ligands. In comparison, 1 exhibited higher antibacterial activity against (B) subtilis than ZnCl267 (12 mm) and the other complexes such as [ZnL(ONO2)2]27; 3 and [ZnL(NCS)2]27; 4, where L is 2,4-bis(morpholin-4-yl)-6-[(E)-2-[1-(pyridin-2-yl)ethylidene]hydrazin-1-yl] 1,3,5-triazine, which exhibited inhibition zones of 15 and 16 mm, respectively. Additionally, 3 and 4 were inactive against E. coli, while 1 showed an observable activity.
Comparing the antimicrobial activity of 2 with AgNO3, it is evident that 2 exhibited greater effectiveness against all microbial cells, except P. vulgaris. In this case, AgNO3 has an inhibition zone with a diameter of 20 mm (see Table 5). In contrast, both 2 and AgNO3 display a value of 10 mm against C. albicans. Further comparisons were made between 2 and the previously reported [Ag₂(2ClDAT)₂(NO₃)₂(H₂O)]35; 5 (2ClDAT = 2-chloro-4,6-diamino-1,3,5-triazine), and [Ag(BPAT)(ACN)]ClO450; 6 complexes (Table 5). Complex 2 demonstrated superior activity against B. subtilis and E. coli when compared to 5 and 6. Moreover, 2 was found to be more potent against S. aureus than 5, and against P. vulgaris than 6. Additionally, 2 was found to be more potent against C. albicans than 4, whereas 3 was inactive. Additionally, 5 showed no antifungal activity towards the tested fungi, whereas 2 was active.
Table 5 Antimicrobial activities for L, 1 and 2
Obviously, the antimicrobial activity of the complexes is strongly influenced by ligand design68, metal ion identity68,69,70 and coordination geometry68,71. s-Triazine based ligands are regarded as an important structural scaffold due to the presence of three nitrogen donor atoms, which result in electron delocalization and contribute to superior antimicrobial activity by increasing lipophilicity and cellular uptake72. Additionally, the enhanced antimicrobial activity of complex 2 compared to 1 can be rationalized based on chelation theory73. In 1, the ligand coordinates in a monodentate manner, whereas in 2, it acts as a multidentate chelator around the Ag(I), leading to the formation of a stable chelate ring. This chelation further increases the lipophilicity of 2 more than 1, which facilitates Ag(I) complex penetration through biological membranes and inhibits various cellular enzymes that are crucial for the diverse metabolic pathways of microbes74,75. These observations highlight the critical role of ligand chelating capability as it reflects on the biological efficacy of the complexes as bacteriostatic agents compared to their free ligands76.
