


Characteristics of patients with TAM based on platelet count
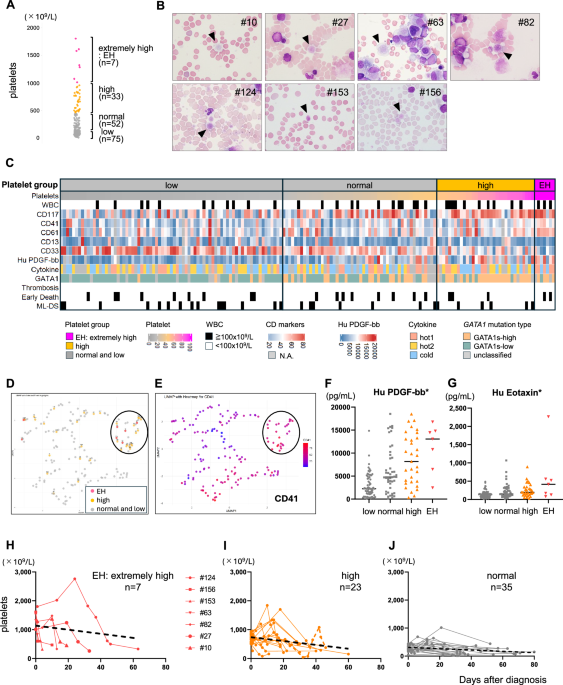
At diagnosis, platelet counts were available for all 167 patients in the TAM-10 cohort (Supplementary Table 1) [9]. Patients were stratified into four groups: ≥1000 × 10⁹/L (extremely high [EH]), 450–999 × 10⁹/L (high), 150–449 × 10⁹/L (normal), and <150 × 10⁹/L (low). Seven (4%) patients were classified as EH, 33 (20%) as high, 52 (31%) as normal, and 75 (45%) as low (Fig. 1A).
Fig. 1: Clinical and molecular features of patients with TAM with thrombocytosis.The alternative text for this image may have been generated using AI.
A Distribution of platelet counts at diagnosis in the TAM cohort. B Peripheral blood smears from seven representative cases with EH platelet counts, demonstrating prominent giant platelets. C Heatmap of clinical and molecular parameters stratified by platelet count group. Rows are ordered by platelet count. Annotations include surface marker expression, cytokine profiles, GATA1 mutation type, and clinical outcomes. The heatmap was generated using the ComplexHeatmap and circlize packages in RStudio. D Surface marker expression profiles in blast cells. UMAP plot of 164 patients with TAM based on expression percentages of six surface antigens (CD7, CD117, CD13, CD33, CD41, and CD61). Pink, orange, and gray dots indicate patients in the EH, high, and normal-to-low platelet count groups, respectively. UMAP was generated using the umap package in RStudio. The circle highlights a loosely defined cluster of patients with EH platelet counts, suggesting similarity in their immunophenotypic profiles. E CD41 expression overlaid on UMAP coordinates; red denotes high and blue low expression. F, G Bar plots of representative cytokines that were significantly elevated in patients with high or EH platelet counts. Serum cytokine levels are compared across four platelet count groups (EH, high, normal, and low) at diagnosis. Of the 27 cytokines analyzed, 15 showed statistically significant differences (p < 0.05); the full list is provided in the main text, Supplementary Fig. 4, and Supplementary Table 4. Statistical analyses were performed using the Kruskal–Wallis test or one-way ANOVA, as appropriate. Asterisks indicate statistically significant differences. Sequential changes in platelet counts in patients with TAM. Temporal changes in platelet counts in patients with EH (H), high (I), and normal (J) platelet levels at diagnosis. The black dashed line represents the linear regression line.
Baseline characteristics, including sex, gestational age, and birth weight, did not differ among groups (Supplementary Table 2). In contrast, white blood cell (WBC) counts and peripheral blast percentages increased progressively with higher platelet counts (p = 0.0006 and p = 0.042, respectively). Alanine aminotransferase (ALT) levels and the frequency of hepatomegaly were also significantly higher in the elevated platelet groups (p < 0.0001 and p = 0.0027, respectively).
Therapeutic interventions, including low-dose cytarabine, exchange transfusion, and systemic corticosteroids, were similarly distributed across groups. No thrombotic events occured, including among patients in the EH platelet group. Only one EH patient received low-dose aspirin. Rates of early death, late death, and ML-DS development did not differ significantly across groups.
Morphological and molecular features in patients with TAM with thrombocytosis
Peripheral blood smears from all seven EH patients showed marked thrombocytosis with prominent giant platelets, consistent with increased megakaryocytic activation (Fig. 1B). These features were less evident or absent in the other groups.
An integrated heatmap incorporating clinical parameters, immunophenotype, cytokine levels, and GATA1 mutation patterns (Supplementary Fig. 1 and Supplementary Table 3) revealed clustering of EH and high platelet cases (Fig. 1C). Patients in the EH and high platelet groups more frequently exhibited elevated WBC counts ( ≥ 100 × 10⁹/L). Notably, short-form GATA1 (GATA1s)-high mutations were more prevalent in patients with higher platelet counts (chi-square and Fisher’s exact tests, both p < 0.0001).
Surface marker expression and cytokine profiles by platelet group
Flow cytometric analysis revealed progressive increases in megakaryocytic and progenitor markers (CD41, CD61, CD117) with rising platelet counts, accompanied by relatively reduced expression of myeloid markers such as CD33 (Supplementary Fig. 2). In the UMAP analysis, patients in the EH group tended to form a loosely defined cluster, suggesting partial similarity in their immunophenotypic profiles (Fig. 1D). The UMAP-based distribution of surface marker expression further supported increased expression of megakaryocytic markers in the EH and high groups (Fig. 1E and Supplementary Fig. 3).
Serum cytokine profiling detected 15 of 27 cytokines (shown in Supplementary Table 4) [10], demonstrating significant differences across platelet count groups (Fig. 1F, G and Supplementary Fig. 4). Patients with EH and high platelet counts exhibited elevated levels of pro-inflammatory and hematopoietic cytokines, including IL-4, IL-7, IL-9, IL-10, PDGF-bb, basic FGF, Eotaxin, G-CSF, IFN-γ, IP-10, MCP-1, RANTES, and TNF-α. Despite this broad cytokine upregulation, the previously established hot1/hot2/cold cytokine categories were not significantly different by platelet group (Fig. 1C and Supplementary Table 2) [10].
Time-course of platelet counts in patients with TAM
Subsequently, we examined longitudinal changes in platelet counts following diagnosis. In most EH and high-platelet cases, platelet counts peaked approximately 1 month after diagnosis and then declined spontaneously without specific intervention (Fig. 1H–J). Longitudinal platelet trends were generally similar between cytarabine-treated and untreated patients, although early low-dose cytarabine treatment was associated with a modest attenuation of platelet decline (Supplementary Fig. 5). Additionally, several patients later developed transient thrombocytopenia about 1 month after diagnosis, followed by spontaneous recovery within approximately 3 months. However, persistent thrombocytopenia was observed only in cases with leukemic transformation or fatal outcomes (Supplementary Fig. 6).
Association between GATA1 mutation pattern and hematological and biological parameters
Based on our previously established classification, patients were stratified into GATA1s-low and GATA1s-high type mutation groups, reflecting the expected level of short-form GATA1 (GATA1s) expression (Supplementary Fig. 1) [11]. As shown in Fig. 2A, platelet counts were significantly higher in patients in the GATA1s-high mutation group compared to those in the GATA1s-low mutation group (p < 0.0001). Conversely, there were no significant differences in WBC counts (p = 0.99) or blast percentages (p = 0.85) between the two groups (Fig. 2B, C). Serum ALT levels were also significantly higher in the GATA1s-high group (Fig. 2D, p = 0.0022). Immunophenotypically, the GATA1s-high group exhibited increased CD41 expression (p = 0.024) and reduced CD33 expression (p < 0.0001), consistent with megakaryocytic skewing (Fig. 2E, F). Furthermore, GATA1s-high patients exhibited markedly higher serum levels of the hematopoietic cytokine PDGF (Fig. 2G, p < 0.0001), the inflammatory cytokine Eotaxin (Fig. 2H, p = 0.0004), as well as IL-4 (p = 0.0008) and IL-7 (p = 0.041), supporting a distinct cytokine milieu associated with GATA1 mutation type.
Fig. 2: Association between GATA1 mutation patterns and clinical and biological parameters in patients with TAM.The alternative text for this image may have been generated using AI.
Peripheral blood counts (A–C), serum alanine aminotransferase (ALT) levels (D), surface marker expression on blast cells by flow cytometry (E, F), and serum cytokine concentrations (G, H) at diagnosis, stratified by GATA1 mutation type (GATA1s-low [green] vs GATA1s-high [purple]). Each dot represents an individual patient, and horizontal bars indicate median values. Statistical analyses were performed with the Mann–Whitney U test. Asterisks denote statistical significance (*p < 0.05, **p < 0.01, ***p < 0.001, ****p < 0.0001). I Schematic of two types of megakaryocyte progenitors in heterozygous Gata1.05/X females carrying a transgene. The Gata1.05 allele is a targeted knockdown resulting in only ~5% of wild-type Gata1 expression. The green mouse represents a ΔNT-M female (Gata1s-low), the purple mouse represents a ΔNT-H female (Gata1s-high), and the gray mouse represents a wild-type control. Megakaryocyte progenitors with an activated mutant X chromosome are shown in light green, whereas those with an activated wild-type allele are shown in yellow. The inactivated Gata1 allele resulting from X-chromosome inactivation is indicated in light gray. J Comparison of platelet counts among Gata1s-low (ΔNT-M: green), Gata1s-high (ΔNT-H: purple), and wild-type (WT: gray) mice at various time points. Data are presented as mean ± standard deviation. Asterisks denote statistical significance (*p < 0.05, **p < 0.01, ***p < 0.001, ****p < 0.0001).
Higher Gata1s expression correlates with elevated platelet counts in transgenic mice
To validate the role of GATA1s dosage, we analyzed transgenic mouse models expressing high (ΔNT-H) or low (ΔNT-M) levels of Gata1s (Fig. 2I) [12]. In the context of reduced endogenous Gata1 expression, mice with high Gata1s (ΔNT-H) exhibited significantly elevated platelet counts at embryonic day 18.5 and postnatal days 3–5 compared to wild-type and ΔNT-M mice (Fig. 2J). These findings provide experimental support for a causal relationship between GATA1s dosage and thrombopoiesis.
