


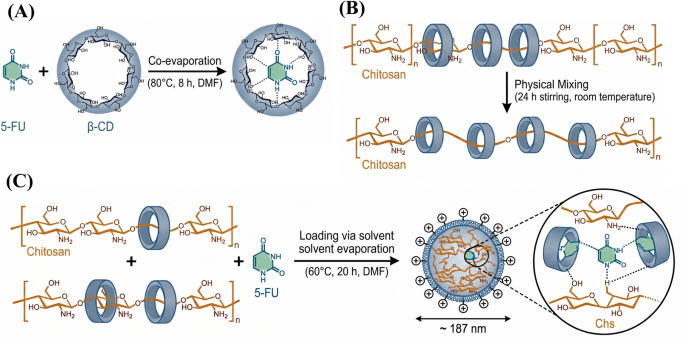
Physicochemical characterization
XRD
XRD patterns of pure 5-FU, the binary 5-FU/β-CD inclusion complex, and the ternary 5-FU/Chs/β-CD system are shown in Fig. 2. Pure 5-FU displayed several intense and sharp reflections across the 2θ range. These peaks indicate a crystalline lattice. The diffraction pattern matches literature reports for 5-FU35,36. High crystallinity in pure 5-FU is associated with slow dissolution rates and low aqueous solubility37.
In the binary 5-FU/β-CD complex, the intensity of the characteristic 5-FU peaks decreased. Peak definition also diminished. This attenuation suggests encapsulation of 5-FU within the β-CD cavity38. No new crystalline peaks appeared. Existing peaks broadened. These observations indicate inclusion complex formation rather than physical mixing39.
The ternary 5-FU/Chs/β-CD system showed additional changes. Pure chitosan typically exhibits two diffraction peaks at 2θ ≈ 10.8° and 20°40. In the ternary system, these peaks shifted to approximately 12.5° and 20.2°. The shift indicates intermolecular interactions among β-CD, 5-FU, and chitosan19. The crystalline peaks of 5-FU were suppressed in the ternary system. This suppression suggests molecular distribution of the drug within the polymeric matrix19. Peak intensity decreased progressively across the series 5-FU → 5-FU/β-CD → 5-FU/Chs/β-CD. Peak positions also shifted. These observations indicate a stepwise encapsulation process41.
Fig. 2
XRD patterns of pure 5-FU, 5-FU/β-CD inclusion complex, and 5-FU/Chs/β-CD pseudopolyrotaxane.
Particle size and surface charge analysis
Dynamic light scattering (DLS) was used to assess particle size, size distribution, and surface charge. Figure 3 shows the intensity‑based size distribution profiles and zeta potential distributions for free 5‑FU, binary 5‑FU/β‑CD complex, and ternary 5‑FU/Chs/β‑CD formulation. Figure 3A shows the size distributions. Free 5‑FU displayed a bimodal distribution with a major peak at approximately 1500 nm and a minor aggregation peak at approximately 3000 nm. The mean hydrodynamic diameter (Z‑average) was 4888.7 ± 218.5 nm, with a polydispersity index (PDI) of 0.416 ± 0.020. This broad distribution points to extensive particle aggregation, which is consistent with the poor aqueous solubility of 5‑FU (1.12 mg/mL) and its tendency to form large crystalline aggregates in aqueous media42.
Encapsulation of 5‑FU within β‑CD reduced the particle size. The binary complex had a mean diameter of 450.7 ± 21.5 nm and a PDI of 0.285 ± 0.019. The size distribution remained bimodal, with a primary peak at approximately 350 nm and a minor aggregation peak at approximately 2000 nm. The aggregation peak intensity dropped from 9.8% (free 5‑FU) to 3.2%. This residual aggregation reflects the weak complexation affinity of 5‑FU with β‑CD (Ks = 136.2 M⁻¹), which limits complete molecular encapsulation.
Fig. 3
Dynamic light scattering (DLS) characterization of free 5-FU, binary 5-FU/β-CD inclusion complex, and ternary 5-FU/Chs/β-CD formulation. (A) Intensity-based particle size distribution profiles of free 5-FU, binary 5-FU/β-CD complex and ternary 5-FU/Chs/β-CD formulation. (B) Zeta potential distributions of free 5-FU, binary 5-FU/β-CD complex and ternary 5-FU/Chs/β-CD formulation. All measurements were performed in triplicate at 25 °C. Data represent mean ± SD (n = 3).
The ternary formulation displayed a narrow, monomodal size distribution with a single peak at approximately 175 nm. The mean diameter was 187.3 ± 12.6 nm, and the PDI was 0.214 ± 0.031. No secondary aggregation peak was observed. This uniform size distribution indicates effective stabilization by the combined action of β‑CD inclusion complexation and the chitosan polymer matrix. The ternary formulation’s size (187 nm) falls within the 100–200 nm range often cited for passive tumor targeting through the increased permeability and retention (EPR) effect7,43. Particles of this size can extravasate through leaky tumor vasculature while avoiding rapid renal clearance (< 10 nm) and extensive hepatic uptake (> 200 nm). This size also favors cellular uptake, as NPs in the 100–200 nm range are effectively internalized by cancer cells through clathrin‑mediated endocytosis44.
Zeta potential measurements (Fig. 3B) showed differences among the three formulations. Free 5‑FU had a negative zeta potential of − 8.3 ± 0.8 mV, which is attributed to partial ionization of carbonyl groups in the pyrimidine ring. The low absolute value (< 10 mV) reflects poor electrostatic stabilization, contributing to the aggregation seen in the size distribution. The binary complex showed a more negative value of − 12.5 ± 0.7 mV due to hydroxyl groups on the β‑CD exterior. However, this value remains below the ± 30 mV threshold typically associated with good electrostatic stabilization, which explains the residual aggregation44. The ternary formulation exhibited a positive zeta potential of + 32.5 ± 4.2 mV. This positive charge comes from protonated amine groups (−NH3+) of chitosan at the particle surface. At the measurement pH (7.4) and given chitosan’s pKa of approximately 6.5, about 50–60% of the amine groups remain protonated45. A zeta potential above + 30 mV provides sufficient electrostatic stabilization, consistent with the monodisperse size distribution and the absence of aggregation peaks46.
The colloidal stability of the ternary formulation was assessed over 14 days of storage at 4 °C (Table 2). Particle size increased by less than 8% (from 187.3 nm to 201.8 nm), and zeta potential decreased by less than 13% (from + 32.5 mV to + 28.4 mV). The PDI stayed below 0.3 throughout. These data indicate that the ternary formulation maintains practical colloidal stability for handling and storage47,48.
Table 2 Stability of ternary formulation at 4 °C.
The progressive size reduction from 4888 nm (free 5‑FU) to 450 nm (binary complex) to 187 nm (ternary formulation) shows the combined effect of β‑CD and chitosan. The binary complex achieves partial size reduction through inclusion complexation, but its weak affinity for 5‑FU (Ks = 136.2 M⁻¹) leaves residual aggregation and moderate polydispersity.
The ternary formulation overcomes this through a dual mechanism. β‑CD provides molecular encapsulation that disrupts the crystalline structure of 5‑FU and improves solubility. Chitosan acts as a hydrophilic polymer matrix that physically separates drug molecules, prevents recrystallisation, offers steric stabilization, and imparts a positive surface charge for electrostatic stabilization49,50. Together, these properties support the use of this formulation for colorectal cancer therapy.
SEM
Surface morphology and microstructural characteristics were assessed using Scanning electron microscopy (SEM). Figure 4 shows the micrographs of pure 5-FU, binary 5-FU/β-CD inclusion complex, and ternary 5-FU/β-CD/chitosan nanocarrier. Pure 5-FU (Fig. 4A) displayed a crystalline morphology with large, irregularly shaped particles. These compact and angular structures represent the native solid-state form of the drug51.
The binary 5-FU/β-CD inclusion complex (Fig. 4B) exhibited plate-like and elongated particles with smoother surfaces compared to free 5-FU. This morphological change indicates successful encapsulation of 5-FU within the β-CD cavity. Such changes are typical for drug–cyclodextrin inclusion complexes, where host–guest interactions alter the crystalline arrangement52.
The ternary 5-FU/β-CD/chitosan nanocarrier (Fig. 4C) showed a different morphology with rough, aggregated, nanoscale particles. This transformation from crystalline plates to irregular porous aggregates reflects the influence of chitosan incorporation, which provides a polymeric framework for further encapsulation and stabilization53. The rough surface and reduced particle size are favorable features for drug delivery, as they increase surface area and may improve solubility and dissolution rates54.
Fig. 4
Scanning electron micrographs of (A) pure 5-fluorouracil (5-FU), (B) binary 5-FU/β-cyclodextrin (β-CD) inclusion complex, and (C) ternary 5-FU/β-CD/chitosan (Chs) nanocarrier complex. The images taken at the same scale (1 μm) and magnification (10,000×).
FTIR
FTIR spectra of free 5-FU and its inclusion complexes with β-CD and chitosan are presented in Fig. 5. Free 5-FU showed characteristic vibrational bands at 3567.66 cm− 1 (symmetric N–H stretching), 2935.12 cm− 1 (aliphatic C–H stretching), and 1715.37 cm− 1 (C = O stretching of the carbonyl group)55. Upon encapsulation within β-CD, these bands shifted to 3559.95 cm− 1, 2947.66 cm−−−1, and 1722.12 cm−−1, respectively. These shifts indicate non-covalent interactions like hydrogen bonding and hydrophobic inclusion between the drug and the β-CD cavity56. After further modification with chitosan, more pronounced shifts appeared at 3581.16 cm− 1, 2920.66 cm− 1, and 1725.01 cm− 1. These shifts suggest enhanced molecular interactions in the ternary system, likely involving hydrogen bonding between protonated amine groups of chitosan and the carbonyl or amine groups of 5-FU57.
Fig. 5
FTIR spectra of pure 5-FU, 5-FU/β-CD inclusion complex, and 5-FU/Chs/β-CD pseudopolyrotaxane.
The observed peak shifts (Δδ) are summarized in Table 3. The N–H stretching frequency shifted down by − 7.71 cm− 1 in the binary complex but up by + 13.5 cm− 1 in the ternary complex, indicating distinct binding environments in each system. The carbonyl stretching frequency increased in both complexes (6.75 cm− 1 and 9.64 cm− 1), suggesting that the C = O group participates in strong hydrogen bonding with hydroxyl moieties of β-CD and chitosan58. These spectral changes confirm the formation of inclusion complexes and the establishment of intermolecular forces (predominantly van der Waals and hydrogen bonds) between 5-FU and the host polymers.
Table 3 FTIR spectral data of 5-FU and its inclusion complexes with β-CD and Chs/β-CD.
Phase solubility study
The phase solubility study evaluated the solubilizing capacity of β-CD alone and the Chs/β-CD pseudopolyrotaxane complex toward 5-FU. This addresses a key limitation of 5-FU therapy—its poor aqueous solubility (1.12 mg/mL)—and provides a quantitative assessment of inclusion complexation efficiency59. Figure 6A shows the phase solubility diagram of 5-FU with increasing β-CD concentrations. 5-FU solubility increased linearly, following an A1‑type profile according to the Higuchi classification59. This linear relationship indicates formation of a 1:1 stoichiometric inclusion complex between 5-FU and β-CD. The apparent stability constant (Ks) for the 1:1 complex was calculated as 136.2 M− 1 using the equation60:
Ks = Slope / [S0 × (1 – Slope)] = 0.1315 / [1.1124 × (1–0.1315)] = 136.2 M− 1.
This Ks value falls within the 100–200 M− 1 range reported for 5-FU/β-CD complexes and confirms that 5-FU has weak complexation affinity with β-CD. This reflects the hydrophilic nature of 5-FU, which limits its tendency to partition into the hydrophobic β-CD cavity61.
Fig. 6
Phase solubility study of 5-FU at 25 °C after 72 h equilibration. (A) Phase solubility diagram of 5-FU in β-CD solutions. (B) Phase solubility diagram of 5-FU in Chs/β-CD pseudopolyrotaxane solutions.
Figure 6B shows the phase solubility diagram with Chs/β-CD. The Chs/β-CD system exhibited superior solubilizing capacity compared to β-CD alone, with a non-linear, super-linear increase in 5-FU solubility. At the highest concentration tested (20 mg/mL Chs/β-CD), 5-FU solubility reached 6.84 ± 0.20 mg/mL, representing a 5.86‑fold enhancement compared to water. β-CD alone at an equivalent β-CD content (approximately 4.4 mM) achieved only a 2.26‑fold enhancement. Thus, the Chs/β-CD system provided an additional 2.6‑fold increase in solubility beyond that achieved by β-CD alone.
Table 4 provides a direct comparison at equivalent β-CD concentrations. The enhancement factor increased progressively with concentration, reaching 1.75 at the highest concentration tested. This concentration‑dependent enhancement suggests that chitosan contributes increasingly to solubilization at higher concentrations62.
Table 4 Comparison of 5-FU solubility at equivalent β-CD concentrations.
Drug loading content and encapsulation efficiency
The 5-FU/Chs/β-CD ternary formulation’s drug loading content (DLC) and encapsulation efficiency (EE) were assessed using UV–Vis spectrophotometry at 266 nm using the calibration equation (y = 0.05238x + 0.00012, R2 = 0.99998)63. Table 5 summarizes the results. The ternary formulation showed a mean DLC of 18.6 ± 1.2% and a mean EE of 74.3 ± 3.5%. The relative standard deviation values were 6.5% for DLC and 4.7% for EE, indicating good reproducibility of the preparation method.
Table 5 The content of drug loading and encapsulation efficiency of 5-FU/Chs/β-CD ternary formulation (n = 3).
For comparison, chitosan NPs typically show DLC values of 8.5–12.4% and EE of 42.8–58.6%64,65. β-Cyclodextrin inclusion complexes alone show lower EE values ranging from 35.2% to 48.5%38,52. Chemically grafted chitosan–cyclodextrin systems report DLC of 15.2–17.8% and EE of 68.5–72.3% despite requiring covalent modification66. The present formulation, prepared via simpler physical assembly, achieves comparable or better values.
The combination of chitosan-based polymer entrapment and β cyclodextrin inclusion complexation is leading to the high EE. The initial formation of the 5-FU/β-CD inclusion complex enables molecular-level encapsulation of the drug within the hydrophobic cavity, reducing crystallization38,52. The chitosan matrix then provides a hydrophilic network that enhances drug retention through physical entrapment and hydrogen bonding, as confirmed by FTIR analysis.
In vitro drug release study
The in vitro release behavior of 5-FU from the ternary 5-FU/Chs/β-CD formulation was evaluated at pH 7.4 (physiological conditions) and pH 5.5 (acidic tumor microenvironment). Figure 7 presents cumulative release profiles over 72 h. At pH 7.4, the formulation released 18.95% of loaded 5-FU within the first 2 h, 53.17% at 24 h, and 67.37% at 72 h. At pH 5.5, release was faster: 29.45% at 2 h, 74.55% at 24 h, and 87.35% at 72 h. The differences between pH conditions were statistically significant at all time points (p < 0.001). Enhancement ratios ranged from 1.55 at early time points to 1.30 at 72 h. The accelerated release at acidic pH is explained by the pH‑responsive behavior of chitosan, which has a pKa of approximately 6.5. At pH 5.5, amine groups of chitosan become protonated to NH3+, increasing positive charge density within the polymer matrix67. This leads to electrostatic repulsion between adjacent polymer chains, causing matrix swelling and expansion. The swollen matrix allows faster diffusion of 5-FU molecules68. At pH 7.4, fewer amine groups are protonated (approximately 50–60%), resulting in reduced swelling and slower diffusion‑controlled release7. Importantly, the pH 5.5 condition does not represent the colonic lumen (pH ~ 6–7) but rather the acidic tumor microenvironment and the endosomal/lysosomal compartment (pH 4.5–5.5) following cellular uptake. Thus, faster release at acidic pH enhances intracellular drug delivery rather than diminishing colonic effect.
Fig. 7
In vitro Cumulative release profiles of 5-FU from the 5-FU/Chs/β-CD ternary formulation at 37 °C in PBS (pH 7.4) and acetate buffer (pH 5.5).
Compared with other 5-FU delivery systems, the ternary formulation provides a balanced release profile. Conventional chitosan NPs typically release 45–60% of drug over 72 h64. Chitosan‑alginate NPs show 50–65% release over the same period69. β‑Cyclodextrin inclusion complexes alone release 85–95% within 24 h, indicating minimal sustained release capability52,70. PLGA NPs achieve only 40–55% total release over 72 h69. The ternary formulation releases 67.37% at pH 7.4 and 87.35% at pH 5.5 over 72 h, providing both sustained delivery and pH‑triggered acceleration.
In vitro cytotoxicity
Cytotoxicity of free 5-FU, binary 5-FU/β-CD complex, and ternary 5-FU/Chs/β-CD formulation against HCT-116 colorectal cancer cells was evaluated using the SRB assay. Figure 8 shows the dose–response curves. Free 5-FU showed an IC₅₀ of 42.5 µM. The binary 5-FU/β-CD complex showed an improved IC50 of 27.75 µM. The ternary 5-FU/Chs/β-CD system showed the lowest IC50 at 16.5 µM. Thus, the cytotoxic potency increased approximately 2.6‑fold after nanoformulation, with the greatest enhancement when both chitosan and β-CD were used. Figure 9 shows microscopic images of HCT-116 cells after treatment. The images visually confirm the dose‑dependent reduction in cell density across treatment groups.
Fig. 8
Dose–response cytotoxicity curves of free 5-FU, 5-FU/β-CD inclusion complex, and 5-FU/Chs/β-CD pseudopolyrotaxane against HCT-116 colorectal cancer cells after 72 h of treatment.
The 2.6-fold reduction in IC50 from free 5-FU (42.5 µM) to the ternary formulation (16.5 µM) likely reflects converging improvements at multiple delivery steps rather than a single dominant mechanism. Encapsulation within β-CD disrupts the crystalline packing of 5-FU and increases its aqueous solubility, raising the concentration available at the cell membrane. The chitosan shell then promotes adsorptive endocytosis through electrostatic attraction to negatively charged membrane phospholipids, accelerating intracellular uptake. Once internalized, the pH-responsive swelling of chitosan at endosomal pH (~ 5–6) supports sustained intracellular release, prolonging the S-phase exposure that underpins 5-FU’s thymidylate synthase inhibition71,72,73.
Fig. 9
Microscopic images of HCT-116 colorectal cancer cells after 72 h of treatment with 5-FU, 5-FU/β-CD inclusion complex, and 5-FU/Chs/β-CD pseudopolyrotaxane with two concentrations (0.05 and 500 µM).
In vitro gene expression analysis (RT-qPCR)
RT‑qPCR analysis evaluated the expression of pro‑apoptotic genes (Caspase‑3, P53), an anti‑apoptotic gene (BCL2), and an angiogenic gene (VEGF) in HCT‑116 cells after 72 h of treatment. Figure 10 shows the fold‑change expression values. In the 5-FU/Chs/β-CD group, Caspase‑3 expression increased 3.72‑fold compared to untreated control. This was higher than in the free 5‑FU group (1.85‑fold) and the binary complex group (2.48‑fold). The differences were statistically significant (p < 0.05). P53 expression increased 3.63‑fold in the ternary group, compared to 1.92‑fold (free 5‑FU) and 2.51‑fold (binary complex). Again, the ternary group showed a statistically significant elevation (p < 0.05). BCL2 expression showed different patterns across groups. Free 5‑FU paradoxically increased BCL2 expression (1.35‑fold). The binary complex reduced BCL2 expression (0.71‑fold), and the ternary formulation showed the strongest suppression (0.48‑fold). Both nanocarrier groups differed significantly from free 5‑FU (p < 0.05). VEGF expression decreased across all treatment groups. The suppression was most pronounced in the ternary group (0.32‑fold), followed by the binary complex (0.48‑fold) and free 5‑FU (0.67‑fold). All groups differed from control (p < 0.05).
Fig. 10
Fold‑change expression of Caspase‑3 (A), P53 (B), BCL2 (C), and VEGF (D) in HCT‑116 colorectal cancer cells treated with 5‑FU, 5‑FU/β‑CD, or 5‑FU/Chs/β‑CD compared to untreated control. Different superscript letters indicate significant differences between groups (p < 0.05).
The upregulation of Caspase‑3 and P53 indicates activation of the intrinsic apoptotic pathway. P53 is a master regulator of apoptosis, transcriptionally activating pro‑apoptotic genes while repressing anti‑apoptotic genes like BCL274. The paradoxical upregulation of BCL2 observed in the free 5-FU group (1.35-fold) is consistent with reports that acute drug exposure can activate pro-survival NF-κB signaling as a cytoprotective response75. The sustained, lower-concentration release profile of the ternary formulation appears to avoid this threshold effect, resulting in progressive BCL2 suppression (0.48-fold) without triggering the adaptive survival response seen with bolus drug delivery. The downregulation of VEGF indicates that the nanocarrier systems may also limit angiogenic signaling. Compared with other 5‑FU delivery systems, the present ternary formulation offers several advantages. Conventional chitosan NPs18 typically achieve DLC of 8.5–12.4% and EE of 42.8–58.6%, with IC50 values against HCT‑116 cells ranging from 25 to 35 µM. β‑Cyclodextrin inclusion complexes alone show lower EE (35–48%) and release 85–95% of drug within 24 h, indicating minimal sustained release52. Chemically grafted chitosan‑cyclodextrin systems report DLC of 15.2–17.8% and EE of 68.5–72.3% but require covalent modification66. Our physically assembled ternary system achieves comparable or better DLC (18.6%), EE (74.3%), and IC50 (16.5 µM) without chemical crosslinking, simplifying manufacturing and reducing potential toxicity from residual crosslinkers. The pH‑responsive release (87% at pH 5.5 vs. 67% at pH 7.4 over 72 h) provides a balance between sustained circulation and accelerated release in the acidic tumor microenvironment, an advantage over non‑responsive systems.
In silico network pharmacology and functional enrichment analysis
The in silico analysis was performed exclusively for 5‑FU, as public transcriptomic databases do not contain expression profiles for chitosan or β‑cyclodextrin. This analysis provides systems‑level context for the molecular mechanism of 5‑FU itself, not for the nanocarrier components.
Differentially expressed gene analysis
Differential expression analysis of dataset GSE183977 (HT29 cells treated with 100 µM 5‑FU for 2 h) identified 33 upregulated and 217 downregulated genes (Padj < 0.05). Figure 11A shows the volcano plot. Among upregulated genes, MYC (log2FC = 2.21) and BMP4 (log2FC = 2.133) stand out as functionally interpretable in the context of 5-FU exposure. MYC upregulation at this early time point (2 h) is more consistent with a stress-induced transcriptional rebound than a sustained proliferative signal, a distinction that matters because persistent MYC expression at later time points is associated with ABCB5-mediated drug efflux and chemoresistance76. BMP4 upregulation, by contrast, has been shown to promote differentiation and apoptosis in CRC stem cells and to enhance 5-FU sensitivity77, suggesting it may represent part of an early drug-sensitization response. The upregulation of HAS2 (log2FC = 3.095), which encodes hyaluronan synthase 2, raises a separate question about extracellular matrix remodeling under treatment, though its role in this context requires further investigation.
Figure 11B shows the MA plot, confirmed that most significant expression changes occurred in genes with moderate to high baseline expression levels. Figure 11C shows boxplots of normalized expression values, confirming effective normalization with minimal technical variation.
Fig. 11
Differential gene expression analysis of GSE183977 (control vs. treated). (A) Volcano plot. (B) MA plot. (C) Boxplots of normalized expression values.
By analyzing GSE183977 dataset we identified 33 up regulated genes, and 217 down regulated genes, the top 10 dysregulated genes are represented in Table 6.
Table 6 Top 10 dysregulated genes from the GSE183977 dataset, ranked by statistical significance, representing key candidates most affected by treatment.
Protein–protein interaction (PPI) network analysis
A total of 250 dysregulated genes were mapped to the STRING database. The resulting PPI network comprised 112 nodes and 170 edges, with PPI enrichment P < 1.0 × 10− 16 (Fig. 12). This indicates that the genes interact more frequently than expected by chance. Hub genes with high connectivity included EGF, EGFR, MYC, ACTB, and JUN. EGFR is frequently overexpressed in colorectal cancer and has been implicated in promoting resistance to 5‑FU by enhancing autophagy78. MYC is an established oncogene that drives proliferation and metabolism; the c‑MYC/ABCB5 axis confers chemoresistance by increasing ABCB5 expression79. JUN, part of the JNK signaling pathway, contributes to 5‑FU resistance by upregulating the drug efflux transporter ABCG276.
Hub gene identification
The CytoHubba plugin in Cytoscape identified the top 10 hub genes based on degree connectivity (Fig. 13; Table 7). IL6 showed the highest degree score (30), followed by MYC (16), EGR1 (14), BMP4 (13), and ATF3 (12). IFNL3, IFNL2, and CXCL1 each had a degree score of 11. CCN1 and IL19 scored 10.
Fig. 12
Protein–protein interaction (PPI) network of 250 dysregulated genes from STRING analysis, comprising 112 nodes and 170 edges (P < 1.0 × 10− 16).
The topology of the hub gene set reflects two converging response programs to 5-FU treatment. The first is an inflammatory–cytokine axis centered on IL6 (degree = 30), which drives STAT3-mediated survival signaling and is a well-established mediator of 5-FU chemoresistance in CRC80. The co-enrichment of CXCL1, IL19, IFNL2, and IFNL3 around this hub suggests that 5-FU treatment activates broad intercellular immune signaling rather than a single cytokine pathway, a finding that may have implications for the inflammatory side effects observed clinically. The second program is a stress-transcription axis comprising MYC, EGR1, and ATF3, all of which are immediate-early response genes. Their simultaneous upregulation points to a coordinated transcriptional response to genotoxic stress: EGR1 and ATF3 can independently drive p21 and PTEN expression to enforce cell cycle arrest81,82, while MYC, paradoxically upregulated, likely reflects the competing proliferative pressure that determines whether cells commit to apoptosis or adaptation. The presence of BMP4 at the periphery of this cluster is notable given its reported role in sensitizing CRC stem cells to 5-FU through differentiation induction77.
Fig. 13
Top 10 hub genes from the PPI network, identified via CytoHubba degree analysis in Cytoscape. Genes include IL6, MYC, EGR1, BMP4, ATF3, IFNL3, IFNL2, CXCL1, CCN1, and IL19, with color intensity reflecting degree score (red = highest, yellow = lowest). IL6 showed the highest connectivity (degree = 30).
Table 7 Top 10 hub genes ranked by degree score from the PPI network (CytoHubba analysis). Higher scores reflect greater connectivity and potential regulatory importance.
Functional enrichment analysis
The functional enrichment analysis showed overrepresentation of differentially expressed genes in immune response, cell signaling, and cell proliferation–related biological processes (Fig. 14A). The most enriched term was the cytokine-mediated signaling pathway (FDR = 8.77 × 10⁻⁵). This term involved seven hub genes: EGR1, IFNL2, IL19, CXCL1, IL6, IFNL3, and MYC (Table 8). These genes mediate intercellular communication during inflammatory and immune responses.
The co-enrichment of IL6, MYC, and EGR1 within the cytokine-mediated signaling pathway term reveals a tension that is central to understanding 5-FU pharmacology. IL6/GP130–STAT3 signaling is one of the best-characterized drivers of 5-FU resistance in CRC: persistent IL6 activity maintains anti-apoptotic gene expression and reduces drug uptake83. Yet EGR1, induced here by 5-FU-mediated DNA damage, counteracts this by transcriptionally activating p21 and PTEN independently of p53 status84,85. The simultaneous upregulation of MYC alongside EGR1 in this dataset therefore represents competing outputs, MYC sustaining a proliferative programmed while EGR1 attempts to enforce arrest, and the balance between these signals may determine whether individual cells undergo apoptosis or develop adaptive resistance. This interpretation aligns with the in vitro gene expression data showing that the ternary nanocarrier, by delivering 5-FU more gradually, may shift this balance toward apoptosis by avoiding the acute IL6-mediated survival response triggered by free drug.
The interferon family members IFNL2 and IFNL3 also emerged as modulators. Both activate the JAK–STAT pathway (STAT1, STAT2, and STAT3) and influence antiproliferative responses similar to IFN‑α and IFN‑γ86. Amplification of IFNL2/IFNL3 genes has been reported in poor‑prognosis cancers, correlating with TP53 mutations, reduced DNA methylation, and altered immune checkpoint activity87,88. CXCL1 was upregulated in response to 5‑FU, a change linked to inflammation and adverse effects including diarrhea during therapy89. CCN1 is a matricellular protein frequently overexpressed in colorectal cancers and associated with poor prognosis, tumor progression, and metastasis77. IL19 is a cytokine that may modulate inflammatory responses during chemotherapy, similar to IL690.
Fig. 14
Functional enrichment analysis before and after hub gene selection. (A) GO biological process enrichment of all dysregulated genes (STRING). (B) Pathway enrichment of the top 10 hub genes with key terms including JAK–STAT signaling and cytokine–cytokine receptor interaction. Bubble size = gene count; color = FDR.
Beyond cytokine signaling, other enriched biological processes were observed. Terms included “cellular response to organic substances” (FDR = 3.3 × 10− 4) and “response to chemical” (FDR = 5.3 × 10− 4). Enrichment of “positive regulation of cell death” and “positive regulation of apoptotic process” appeared, consistent with the cytotoxic effects of 5‑FU observed in vitro.
Developmental processes, including kidney development and metanephros development, were also enriched. These involved genes such as EGR1, BMP4, and MYC. Although these terms are classically linked to organogenesis, the implicated genes are also involved in tissue remodeling and repair91. BMP4 promotes differentiation and apoptosis of colorectal cancer stem cells and enhances the antitumor effects of 5‑FU92. ATF3 is upregulated by 5‑FU and plays roles in the DNA damage response, cell cycle control, and apoptosis81. At the pathway level, enrichment in MAPK cascade regulation and JAK–STAT receptor signaling appeared (Fig. 14B). Additional enrichment of immune‑related processes such as defense response to viruses and chemotaxis was observed93.
Table 8 GO biological process enrichment of dysregulated genes. Key terms include cytokine signaling, stress responses, apoptosis, immune processes, and signal transduction, indicating treatment effects on immune modulation and communication.
These findings indicate that 5‑FU induces transcriptional changes across immune activation, apoptosis, stress adaptation, and developmental pathways. This interplay of signaling networks may underlie both the therapeutic efficacy and the toxicological effects of 5‑FU. Cytokines including IL6 and IL19 appear as modulators of treatment response. Further studies are needed to elucidate their roles in chemoresistance and sensitivity in colorectal cancer.
Taken together, the in vitro and in silico data suggest a coherent mechanistic picture. At the cellular level, the pH-responsive release of 5-FU from the ternary nanocarrier produces sustained intracellular drug concentrations sufficient to activate the P53–Caspase-3 axis and suppress BCL2, without triggering the acute survival response, reflected in paradoxical BCL2 upregulation, that accompanies free drug delivery. At the network level, the in silico analysis identifies IL6–STAT3 signaling and the MYC/EGR1 stress-transcription axis as the primary nodes through which 5-FU reshapes the CRC transcriptome. The stronger modulation of apoptotic and angiogenic markers observed with the nanocarrier formulation in vitro is consistent with a delivery profile that sustains drug exposure long enough to overcome the IL6-mediated chemoresistance mechanism identified in the network analysis. This convergence between the two approaches strengthens confidence in both datasets and provides a rationale for prioritizing IL6 pathway co-targeting in future formulation studies.
