


ATRA suppresses terminal exhaustion and preserves effector function in CD8⁺ T cells
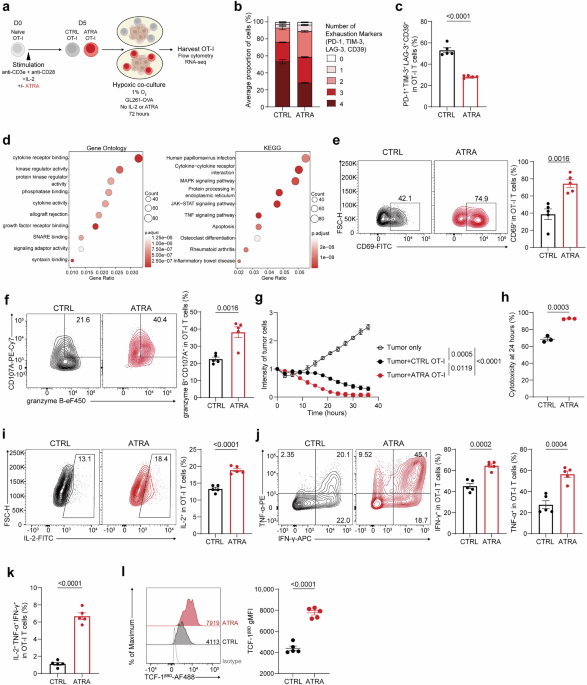
To explore the factors that promote CD8+ T-cell exhaustion, we used CD8⁺ T cells from OT-I TCR-transgenic mice (OT-I T cells) that express TCRs specific to the ovalbumin (OVA)257-264 peptide (SIINFEKL) loaded on the H-2b allotype of major histocompatibility complex class I (MHC-I).21 We cocultured OT-I T cells with ovalbumin (OVA)-expressing GL261 mouse glioma cells (GL261-OVA) without additional cytokines under hypoxic (1% O₂) conditions in vitro to mimic a TME that promotes exhaustion (Fig. 1a). This led to the downregulation of TCF-1 expression and upregulation of exhaustion markers, including PD-1, TIM-3, LAG-3, and CD39, in OT-I T cells (Supplementary Fig. 1a, b). To evaluate whether ATRA modulates CD8⁺ T-cell exhaustion, we cultured OT-I T cells with ATRA-containing medium or control medium during expansion (ATRA OT-I and CTRL OT-I, respectively). Next, we cocultured conditioned OT-I T cells with GL261-OVA cells under hypoxia without additional ATRA or cytokine treatment and compared the exhaustion profiles of OT-I T cells. To quantitatively assess the extent of T-cell exhaustion, we stained cells with multiple exhaustion markers (PD-1, TIM-3, LAG-3, and CD39) and stratified the OT-I T cells on the basis of the number of markers expressed.22,23,24,25 In parallel, we assessed CD44 and CD62L expression to assess CD8⁺ T-cell differentiation and memory phenotypes26 (Supplementary Fig. 1c). We observed that compared with CTRL OT-I T cells, ATRA OT-I T cells exhibited a distinct exhaustion state distribution, characterized by a shift toward fewer coexpressed exhaustion markers (Fig. 1b; Supplementary Fig. 1d). In particular, ATRA-conditioned OT-I T cells coexpressing all four exhaustion markers, corresponding to a highly exhausted phenotype, were significantly less frequent (Fig. 1c). Both CTRL OT-I T cells and ATRA-conditioned OT-I T cells displayed comparable CD44 and CD62L expression, predominantly indicating a CD44⁺CD62L⁻ phenotype (Supplementary Fig. 1e).
Fig. 1
ATRA suppresses terminal exhaustion of CD8+ T cells. a Experimental scheme for in vitro exhaustion induction. CD8+ T cells from OT-I TCR-transgenic mice were harvested from the spleen and activated with anti-CD3e/anti-CD28 antibodies in the presence of 100 IU/mL IL-2 for 48 h. For ATRA conditioning, 5 ng/mL ATRA was added to the culture medium. The cells were further cultured with IL-2 + /- ATRA for three days. Five days after initial activation, OT-I T cells conditioned with either ATRA-containing medium (ATRA OT-I) or control medium (CTRL OT-I) were cocultured with GL261 mouse glioma cell lines expressing ovalbumin (OVA) under 1% O2 for 72 hours. b Stacked bar plot showing the distribution of OT-I T cells according to the number of exhaustion markers expressed (PD-1, TIM-3, LAG-3, and CD39) after 72 hours of in vitro exhaustion. Populations expressing 0, 1, 2, 3, or 4 markers are shown (n = 5 wells per group). c Proportion of OT-I T cells coexpressing all four exhaustion markers (PD-1, TIM-3, LAG-3, and CD39) in each experimental group after 72 hours of in vitro exhaustion (n = 5 wells per group). d Enrichment plots showing the top 10 enriched pathways according to Gene Ontology (left) and KEGG (right) enrichment analyses of genes whose expression was upregulated in ATRA OT-I T cells compared with that in CTRL OT-I T cells after 72 hours of in vitro exhaustion followed by 24 hours of CD3e antibody restimulation. e Representative flow cytometry plots and quantification of CD69 expression in OT-I T cells harvested from the in vitro exhaustion assay following 5 hours of PMA/ionomycin stimulation (n = 5 wells per group). f Representative flow cytometry plots and quantification of OT-I T cells coexpressing granzyme B and CD107A following in vitro exhaustion and 5 hours of PMA/ionomycin stimulation (n = 5 wells per group). g In vitro cytotoxicity assay of tumor cell (GL261-OVA-mCherry) and OT-I T-cell coculture. The intensity of the tumor cells was measured by multiplying the red fluorescence intensity and the area of the tumor cells. Statistical significance represents pairwise comparisons of tumor intensity values at 24 hours post-coculture, analyzed using one-way ANOVA with Tukey’s multiple comparison test (n = 3 wells per group). h Percent cytotoxicity measured from the in vitro cytotoxicity assay shown in panel (g) 24 hours after coculture, calculated as the ratio of decreased intensity (intensity of tumor-only group – intensity of coculture group) to the intensity of the tumor-only group (n = 3 wells per group). i, j Representative flow cytometry plots and quantification of the proportions of cells expressing the indicated cytokines after OT-I T cells harvested from an in vitro exhaustion assay were stimulated with PMA/ionomycin for 5 hours (n = 5 wells per group). i Representative flow cytometry plots and proportions of IL-2-expressing cells. j Representative flow cytometry plots and proportions of IFN-γ- and TNF-α-expressing cells. k Quantification of the proportions of cells coexpressing IL-2, TNF-α and IFN-γ after the stimulation of OT-I T cells harvested from the in vitro exhaustion assay with PMA/ionomycin for 5 hours (n = 5 wells per group). l Representative histogram of TCF-1 long isoform (TCF-1βBD) expression and quantification of the geometric mean fluorescence intensity (gMFI) in ATRA- and CTRL-OT-I T cells following 72 hours of in vitro exhaustion (n = 5 wells per group). The data were analyzed using two-tailed unpaired Student’s t tests (c, e, f, h, i–l) or one-way analysis of variance (ANOVA) with Tukey’s multiple comparison test (g). Representative results of two (g–h) or three (b–c, e–f, i–l) independent experiments are shown. The error bars represent the mean ± standard error of the mean (s.e.m)
We next assessed whether ATRA-conditioned OT-I T cells maintain effector potential. To elucidate the molecular pathways affected by ATRA conditioning, we performed bulk RNA sequencing on OT-I T cells after in vitro exhaustion followed by restimulation and analyzed the enriched gene expression pathways using Gene Ontology and Kyoto Encyclopedia of Genes and Genomes (KEGG) terms. ATRA-treated OT-I T cells displayed upregulated gene signatures associated with cytokine signaling, T cell activation, and inflammation, suggesting that they have elevated effector potential (Fig. 1d). To assess effector potential, we evaluated activation markers and effector molecules following in vitro exhaustion and subsequent phorbol 12-myristate 13-acetate (PMA)/ionomycin stimulation. Strongly exhausted CD8⁺ T cells exhibit impaired induction of CD69 expression upon stimulation.27 Compared with CTRL OT-I T cells, ATRA OT-I T cells exhibited significantly higher CD69 expression upon stimulation, indicating enhanced effector potential (Fig. 1e; Supplementary Fig. 2a). Moreover, compared with CTRL OT-I T cells, ATRA OT-I T cells presented a significantly greater proportion of granzyme B⁺ CD107A⁺ cytotoxic T cells following stimulation (Fig. 1f; Supplementary Fig. 2b). Compared with CTRL OT-I T cells, ATRA OT-I T cells consistently increased GL261-OVA glioma cell death in vitro (Fig. 1g, h). As ATRA alone did not induce tumor cell death (Supplementary Fig. 2c), the enhanced cytotoxicity was attributed to the intrinsic activity of CD8⁺ T cells conditioned by ATRA treatment.
During the progression of exhaustion, CD8+ T cells exhibit an early loss of IL-2 production, followed by a decrease in TNF-α, while IFN-γ production is relatively preserved until the last stage.28 ATRA OT-I T cells displayed significantly higher IL-2 production (Fig. 1i) and IFN-γ and TNF-α production (Fig. 1j) than did CTRL OT-I T cells after in vitro exhaustion and stimulation. Furthermore, the proportion of polyfunctional T cells, determined by the production of multiple cytokines,29 was also significantly greater among ATRA OT-I T cells after in vitro exhaustion and stimulation (Fig. 1k; Supplementary Fig. 2b). Therefore, compared with that in CTRL OT-I T cells, the sustained expression of IL-2 and TNF-α in ATRA OT-I T cells indicates a less exhausted state. We further examined the expression of individual T-cell activation genes and effector genes using bulk RNA sequencing, which revealed upregulated expression of these genes in ATRA-conditioned OT-I T cells (Supplementary Fig. 2d).
In addition to markers of exhaustion, we examined the expression of TCF-1βBD, which has been shown to play a direct role in restricting exhaustion.13,14 ATRA OT-I T cells expressed significantly higher levels of TCF-1βBD after in vitro exhaustion compared with CTRL OT-I T cells (Fig. 1l). Collectively, these data suggest that ATRA pretreatment during CD8⁺ T-cell expansion prevents terminal exhaustion while preserving effector functions.
Canonical WNT/β-catenin signaling mediates ATRA-driven expression of TCF-1βBD and resistance to exhaustion
To further elucidate the mechanism underlying ATRA-mediated upregulation of TCF-1 expression, we quantified the mRNA levels of Tcf7 (which encodes TCF-1) in OT-I T cells using quantitative reverse-transcriptase PCR (qRT‒PCR) (Supplementary Fig. 3a). Before hypoxic coculture, the quantity of Tcf7βBD transcripts was ~25% that of total Tcf7, indicating the predominance of the transcript encoding the short TCF-1 isoform (Tcf7∆βBD) (Supplementary Fig. 3b). During in vitro exhaustion induced by hypoxic coculture with GL261-OVA, the expression of both Tcf7 and Tcf7βBD transcripts substantially decreased (Supplementary Fig. 3c, d). Conversely, ATRA treatment significantly increased the expression of total Tcf7 transcripts (Fig. 2a, left) and Tcf7βBD transcripts (Fig. 2a, right) in OT-I T cells before in vitro exhaustion. In correlation with the transcript levels, the protein levels of total TCF-1 (Supplementary Fig. 3e) and TCF-1βBD (Supplementary Fig. 3f) measured by flow cytometry were increased in ATRA-OT-I T cells. Following in vitro exhaustion, ATRA conditioning did not increase total Tcf7 transcript levels (Fig. 2b, left), which led to unchanged total TCF-1 protein levels (Supplementary Fig. 3g). However, ATRA treatment significantly rescued Tcf7βBD transcript expression (Fig. 2b, right), which was accompanied by increased protein levels of TCF-1βBD following in vitro exhaustion (Fig. 1l). These data suggest that ATRA induces the expression of TCF-1βBD during the induction of exhaustion.
Fig. 2
Canonical WNT pathway upregulation upon ATRA conditioning induces expression of the long isoform of TCF-1 and subsequent suppression of terminal exhaustion. a Expression levels of total or long isoform of the Tcf7 transcript in CTRL- or ATRA-conditioned OT-I T cells measured by quantitative PCR before in vitro exhaustion (n = 4 wells per group). b Expression levels of total or long isoform of the Tcf7 transcript in CTRL- or ATRA-conditioned OT-I T cells measured by quantitative PCR after 48 hours of in vitro exhaustion (n = 4 wells per group). c Expression levels of canonical WNT pathway receptor (Fzd1, n = 6 wells per group) and ligand (Wnt3a, n = 6 wells per group) transcripts measured by quantitative PCR after 48 hours of in vitro exhaustion. d Representative histogram of β-catenin protein expression measured by flow cytometry after 72 hours of in vitro exhaustion in each group. e–h OT-I T cells were stimulated and conditioned with or without 5 ng/mL ATRA, and β-catenin (encoded by Ctnnb1) was subsequently silenced using shRNA. As a negative control, cells were treated with scramble shRNA. Cells were subjected to in vitro exhaustion for 48 hours (e) or 72 hours (f–h). The expression levels of the Tcf7βBD transcript (e, n = 3 wells per group), protein (f, n = 5 wells per group), and the distribution of OT-I T cells according to the number of exhaustion markers expressed (PD-1, TIM-3, LAG-3, and CD39) (g, n = 5 wells per group) and the proportions of cells coexpressing all four exhaustion markers (PD-1, TIM-3, LAG-3, and CD39) (h, n = 5 wells per group) are shown. i Quantification of CD69 expression in OT-I T cells that underwent 72 hours of in vitro exhaustion followed by 5 hours of PMA/ionomycin stimulation (n = 5 wells per group). Quantification of IL-2 (j), IFN-γ (k), and TNF-α (l) expression in OT-I T cells subjected to 72 hours of in vitro exhaustion followed by 5 hours of PMA/ionomycin stimulation (n = 5 wells per group). m Quantification of the proportions of OT-I T cells coexpressing multiple cytokines (IL-2, IFN-γ, and TNF-α) after 72 hours of in vitro exhaustion followed by 5 hours of PMA/ionomycin stimulation (n = 5 wells per group). n Quantification of the proportion of OT-I T cells coexpressing granzyme B and CD107A after 72 hours of in vitro exhaustion followed by 5 hours of PMA/ionomycin stimulation (n = 5 wells per group). o Cytotoxicity assay of tumor cells (GL261-OVA-mCherry) cocultured with OT-I T cells. The intensity of the tumor cells was measured by multiplying the red fluorescence intensity and the area of the tumor cells (n = 4 wells per group). Statistical significance represents pairwise comparisons of tumor intensity values at 24 hours post-coculture, analyzed using one-way ANOVA with Tukey’s multiple comparison test. p Percent cytotoxicity calculated as the ratio of decreased intensity (intensity of the tumor-only group – intensity of the coculture group) to the intensity of the tumor-only group (n = 4 wells per group). q–u OT-I T cells were stimulated and conditioned with either 20 μM SKL2001 or 5 ng/mL ATRA. The cells were subjected to in vitro exhaustion and analyzed. q Representative histogram of β-catenin expression and quantification of the gMFI in OT-I T cells after 72 hours of in vitro exhaustion (n = 5 wells per group). r Expression levels of the long isoform of the Tcf7 transcript measured by quantitative PCR after 48 hours of in vitro exhaustion (n = 4 wells per group). s Quantification of the gMFI of TCF-1βBD after 72 hours of in vitro exhaustion (n = 4 wells per group). t Distribution of OT-I T cells according to the number of exhaustion markers expressed after 72 hours of in vitro exhaustion (PD-1, TIM-3, LAG-3, and CD39) (n = 5 wells per group). u Proportion of cells expressing all four exhaustion markers (PD-1, TIM-3, LAG-3, and CD39) in each experimental group after 72 hours of in vitro exhaustion (n = 5 wells per group). For quantitative PCR analysis results (a–c, e, r), the expression values of each transcript were measured as the relative expression compared with that of the housekeeping gene (Hprt) and were visualized after normalization to the mean expression value of the CTRL group. Data were analyzed using two-tailed unpaired Student’s t test (a–c) or one-way analysis of variance (ANOVA) with Tukey’s multiple comparison test (e–u). Representative data from two (e–p) or three (a–d, q–s) independent experiments are shown. The error bars represent the mean ± s.e.m
In addition to evaluating the expression of TCF-1 isoforms, we evaluated the expression of canonical WNT signaling molecules, which are upstream of β-catenin. qRT‒PCR revealed that the expression of the genes encoding the canonical WNT signaling receptor and ligand Fzd1 and Wnt3a, respectively, was significantly upregulated in ATRA OT-I T cells subjected to in vitro exhaustion (Fig. 2c). Similarly, the protein level of β-catenin was also increased in ATRA OT-I T cells (Fig. 2d). These data suggest that ATRA not only increases the expression of the TCF-1βBD isoform but also facilitates the expression of its coactivator, β-catenin, which is consistent with the activation of canonical WNT/β-catenin signaling.
We next sought to investigate whether increased β-catenin and TCF-1βBD expression induced by ATRA conditioning modulates exhaustion. When we silenced β-catenin expression with short hairpin RNAs (shRNAs) in OT-I T cells (Supplementary Fig. 4a, b), the ATRA-induced upregulation of Tcf7βBD expression, as measured by qRT‒PCR, was abrogated (Fig. 2e), and the protein level of TCF-1βBD was also decreased (Fig. 2f). We next quantified the extent of T-cell exhaustion and observed that silencing β-catenin ablated the regulatory effect of ATRA on exhaustion (Fig. 2g, h; Supplementary Fig. 4c). Silencing of β-catenin further abrogated the ATRA-induced upregulation of CD69 expression, cytokine production (IL-2, IFN-γ, and TNF-α), including polyfunctionality, and the expression of cytotoxic molecules (granzyme B and CD107A) in OT-I T cells that were exhausted in vitro, followed by stimulation with PMA/ionomycin (Fig. 2i–n; Supplementary Fig. 5a–e). In line with the diminished expression of cytotoxic molecules, compared with scramble-transduced control T cells, β-catenin–silenced OT-I T cells did not display increased tumor cell cytotoxicity upon ATRA conditioning and tended toward increased killing activity in the ATRA-conditioned group (Fig. 2o, p). Collectively, these findings support a model in which β-catenin contributes to ATRA-mediated upregulation of TCF-1βBD and suppression of terminal exhaustion while maintaining effector functions.
To further validate these findings, we conditioned OT-I T cells with SKL2001, a small-molecule that upregulates β-catenin expression by disrupting the interaction of β-catenin with Axin, which normally facilitates degradation.30 SKL2001 conditioning elevated β-catenin expression in OT-I T cells to levels comparable to those observed in response to ATRA conditioning (Fig. 2q) and upregulated both the transcript (Fig. 2r) and protein (Fig. 2s) expression of the TCF-1βBD isoform following in vitro exhaustion. Consistently, SKL2001-conditioned OT-I T cells exhibited a redistribution of exhaustion marker coexpression similar to that observed in ATRA-conditioned cells (Fig. 2t; Supplementary Fig. 6). In particular, compared with that of the CTRL cells, the frequency of cells coexpressing all four exhaustion markers was significantly reduced (Fig. 2u). Taken together, these findings reveal that in CD8+ T cells, ATRA activates canonical WNT/β-catenin signaling, which upregulates TCF-1βBD expression and thereby suppresses terminal exhaustion.
ATRA enhances CD8+ T-cell functionality by preventing terminal exhaustion in the glioma microenvironment in vivo
Given our observations that ATRA suppresses CD8⁺ T-cell terminal exhaustion, we next investigated whether ATRA OT-I T cells maintain their exhaustion-resistant state within an exhaustion-promoting TME in vivo. An orthotopic GL261 glioma model exhibited a strongly immunosuppressive microenvironment, in which severe exhaustion of tumor-infiltrating CD8⁺ T cells was observed (Supplementary Fig. 7). Prior to tumor implantation, the CD45.2+ cells in the brain were predominantly microglia (94.7%), whereas 20 days after GL261 cell implantation, the TME was dominated by myeloid populations (71.3%), particularly macrophages (42%), while lymphoid cells remained less abundant, although they increased relative to those in the normal brain (from 2.4% to 28.6%) (Supplementary Fig. 7a–c). Compared with immune cells from normal brain tissue, tumor-infiltrating immune cells from tumor tissue also exhibited elevated HIF-1α expression, indicating exposure to hypoxic conditions within the TME (Supplementary Fig. 7d). Furthermore, myeloid cells from the TME exhibit high PD-1 ligand 1 (PD-L1) expression, particularly in macrophages and monocytes, which is consistent with tumor-associated macrophage (TAM)-mediated immunosuppression31 (Supplementary Fig. 7e). These populations also expressed arginase-1, an immunoregulatory enzyme associated with tumor progression and the suppression of T-cell function in multiple cancer types32,33 (Supplementary Fig. 7f). In addition, tumor-infiltrating CD8⁺ T cells expressed the four exhaustion markers PD-1, TIM-3, LAG-3, and CD39, which is consistent with the exhausted phenotype (Supplementary Fig. 7g). Together, these results confirm that the orthotopic mouse GL261 glioma model induces exhaustion of tumor-infiltrating CD8+ T cells and that this is a suitable system for studying the immunosuppressive and exhaustion-promoting glioblastoma TME.
To assess the functional impact of ATRA conditioning on OT-I T cells in this context, we orthotopically implanted GL261-OVA-mCherry mouse glioma cells into mice and adoptively transferred either ATRA- or CTRL-conditioned OT-I T cells (Fig. 3a). Multiplex immunofluorescence imaging of the TME 7 days after OT-I T-cell transfer confirmed the infiltration of transferred OT-I T cells into the tumor core, and these cells were closely localized to tumor cells as well as other host-derived immune cells. High levels of myeloid cell infiltration, particularly macrophages, were observed within the tumor core, and host-derived T cells were also detected in both tumor and adjacent brain tissues (Supplementary Fig. 8a). When we quantified the immune cell composition in the TME, the frequency and absolute number of ATRA OT-I T cells significantly increased within the TME (Fig. 3b, c). No substantial differences were observed in host immune cell numbers or the expression of immunosuppressive molecules between mice receiving ATRA-OT-I-T cells and those receiving CTRL-OT-I-T cells (Supplementary Fig. 8b–e). Notably, adoptively transferred OT-I T cells were detected within the tumor, with minimal detection in the blood or spleen 7 days post-transfer (Supplementary Fig. 9a–d). A transient signal for ATRA OT-I T cells was observed in the small intestine on day 1 but was not sustained on day 7 posttransfer (Supplementary Fig. 9e–h), which is consistent with antigen-driven retention at the tumor site.
Fig. 3
ATRA-conditioned CD8+ T cells maintain an effector state in an exhaustion-promoting glioma microenvironment in vivo. a Experimental scheme. GL261 mouse glioma cells (2 × 10⁵) expressing OVA and mCherry were implanted intracranially into CD45.2+ mice. Ten days after tumor injection, 1 × 10⁶ ATRA-conditioned or control OT-I T cells expressing CD45.1 were adoptively transferred intravenously. For OT-I T-cell and host-derived immune cell analysis, tumors were harvested 7 days after OT-I T-cell transfer (Fig. 3b–l). For tumor cell analysis, tumors were harvested 14 days after OT-I transfer (Fig. 3m–n). b Representative flow cytometry plots and proportions of OT-I T cells among total tumor-infiltrating live cells measured by CD45.1 expression (n = 6 mice per group). c Total number of tumor-infiltrating OT-I T cells (n = 6 mice per group). Representative histogram and quantification of the gMFI of β-catenin (d) and TCF-1βBD (e) in tumor-infiltrating OT-I T cells (n = 6 mice per group). f Distribution of adoptively transferred and tumor-infiltrating OT-I T cells according to the number of exhaustion markers expressed (PD-1, TIM-3, LAG-3, and CD39) (n = 6 mice per group). g Proportion of adoptively transferred and tumor-infiltrating OT-I T cells expressing all four exhaustion markers (PD-1, TIM-3, LAG-3, and CD39) in each group (n = 6 mice per group). h–l Representative flow cytometry plots and quantification of tumor-infiltrating OT-I T cells expressing the indicated effector molecules after ex vivo stimulation with the OVA257-264 peptide (SIINFEKL) for 6 h (n = 7 mice per group). h Proportion of CD69-expressing cells. i Proportion of IL-2-expressing cells. j Proportions of IFN-γ- and TNF-α-expressing cells. k Proportion of cells expressing multiple cytokines (IL-2, IFN-γ and TNF-α). l Proportion of cells coexpressing granzyme B and CD107A. m Representative images and quantification of tumor size 24 days after GL261-OVA–mCherry cell injection and adoptive transfer of OT-I T cells 10 days later (n = 7 mice per group). Scale bars represent 1000 μm. n Representative flow cytometry plots and numbers of tumor cells measured by mCherry expression 24 days after GL261-OVA-mCherry cell injection and adoptive transfer of OT-I T cells 10 days later (n = 6 mice per group). The data were analyzed using two-tailed unpaired Student’s t tests. Data are representative of two (d–l) or three (b, c) independent experiments or pooled from two independent experiments (m, n). The error bars represent the mean ± s.e.m
We then evaluated the exhaustion status and functional characteristics of adoptively transferred tumor-infiltrating OT-I T cells. Consistent with our in vitro observations, both groups exhibited comparable CD44 and CD62L expression, with the majority of cells displaying a CD44⁺CD62L⁻ phenotype (Supplementary Fig. 10a, b). ATRA OT-I T cells displayed higher levels of β-catenin (Fig. 3d) and TCF-1βBD (Fig. 3e) expression than CTRL OT-I T cells did. Compared with CTRL OT-I T cells, ATRA OT-I T cells in the TME in vivo displayed a shift toward fewer exhausted T cells coexpressing exhaustion markers (Fig. 3f; Supplementary Fig. 10c, d) and a significantly lower proportion of highly exhausted cells expressing all four markers (Fig. 3g), recapitulating our in vitro findings (Fig. 1b, c).
We next asked whether the reduced exhaustion of tumor-infiltrating ATRA OT-I T cells translated to enhanced effector function. We performed ex vivo restimulation with the OVA257–264 (SIINFEKL) peptide and assessed the expression of activation markers and effector molecules in OT-I T cells (Supplementary Fig. 10e, f). ATRA OT-I T cells exhibited significantly elevated CD69 expression (Fig. 3h). In addition, the production of IL-2 (Fig. 3i), IFN-γ and TNF-α (Fig. 3j) was significantly increased in ATRA OT-I T cells, resulting in a higher frequency of polyfunctional T cells than in CTRL OT-I T cells (Fig. 3k). Furthermore, an increased population of granzyme B⁺ CD107A⁺ cytotoxic T cells was observed among ATRA OT-I T cells (Fig. 3l). Finally, compared with adoptively transferred CTRL OT-I T cells, adoptively transferred ATRA OT-I T cells significantly improved tumor control in vivo (Fig. 3m, n). These results suggest that ATRA conditioning mitigates terminal exhaustion and enhances tumor-specific CD8⁺ T-cell function even in the exhaustion-promoting glioma microenvironment.
Oral ATRA treatment suppresses CD8⁺ T-cell exhaustion and enhances glioma suppression in vivo
We next investigated whether systemic administration of ATRA could suppress tumor-infiltrating CD8+ T-cell terminal exhaustion in vivo and improve tumor suppression in glioma-bearing mice. To ensure effective systemic delivery, we orally administered ATRA for two weeks prior to orthotopic GL261-OVA or GL261-OVA-mCherry mouse glioma cell inoculation and continued for an additional two weeks thereafter (Supplementary Fig. 11a), as previous studies have reported a temporal delay between oral retinoid intake and peripheral tissue distribution.34 Oral ATRA administration significantly improved survival and reduced tumor burden (Fig. 4a, b).
Fig. 4
Oral treatment with ATRA suppresses CD8+ T-cell terminal exhaustion and potentiates CD8+ T-cell-dependent glioma suppression. a Kaplan–Meier plot of mice orally treated with 200 μg/head ATRA or control for 2 weeks before and after intracranial injection of GL261-OVA cells (n = 10 mice per group). b Representative flow cytometry plots and numbers of tumor cells measured by mCherry expression 21 days after GL261-OVA-mCherry cell injection (n = 5 mice per group). c Number of CD8+ T cells infiltrating the tumor 14 days after GL261-OVA cell injection (n = 5 mice per group). d Representative flow cytometry plots and numbers of CD8+ T cells that bind (Tet OVA+) or do not bind (Tet OVA-) to the OVA257-264 tetramer among tumor-infiltrating cells 14 days after GL261-OVA cell injection (n = 5 mice per group). e Kaplan–Meier plot of mice receiving oral administration of 200 μg/head ATRA or control and inoculated intracranially with GL261-OVA cells, followed by treatment with anti-CD8a or isotype antibodies (n = 5 mice per group). Representative histograms and quantification of the gMFI of β-catenin (f) and TCF-1βBD (g) in tumor-infiltrating OVA257-264 tetramer-bound CD8+ T cells harvested 14 days after GL261-OVA cell injection (n = 5 mice per group). h Distribution of OVA257-264 tetramer-bound CD8+ T cells harvested 14 days after GL261-OVA cell injection according to the number of exhaustion markers (PD-1, TIM-3, LAG-3, and CD39) expressed (n = 6 mice per group). i Proportion of OVA257-264 tetramer-bound CD8+ T cells expressing all four exhaustion markers (PD-1, TIM-3, LAG-3, and CD39) (n = 6 mice per group). j–n Representative flow cytometry plots and quantification of effector molecule expression in tumor-infiltrating CD8+ T cells harvested 14 days after GL261-OVA cell injection following ex vivo stimulation with the OVA257-264 peptide for 6 hours. j Proportion of CD69-expressing cells (n = 6 mice per group). k Proportion of IL-2-expressing cells (n = 5 mice per group). l Proportion of IFN-γ− and TNF-α-expressing cells (n = 5 mice per group). m Proportion of cells coexpressing IL-2, IFN-γ and TNF-α (n = 5 mice per group). n Proportion of cells coexpressing granzyme B and CD107A (n = 6 mice per group). o Representative histogram and proportion of apoptotic (annexin V+) tumor cells (GL261-OVA) cocultured with CD8+ TILs from each group (n = 5 mice per group). Data were analyzed using two-tailed unpaired Student’s t test (b–c, f–o), two-way analysis of variance (ANOVA) with Šídák’s multiple comparison test (d) or the log-rank test (a, e). Representative results of three (b–d) or two (f–o) independent experiments are shown. For a, pooled data from two independent experiments are shown. The error bars represent the mean ± s.e.m
Next, we analyzed immune cell populations within the tumors of ATRA-treated mice. Multiplex immunofluorescence imaging revealed abundant infiltration of macrophages, monocytes, and lymphoid cells, including CD8⁺ T cells, CD4⁺ T cells, and regulatory T cells (Supplementary Fig. 11b). CD8⁺ T cells were closely juxtaposed with tumor cells and macrophages within the tumor core, which is consistent with the ability of the TME to promote exhaustion-inducing interactions. To quantitatively assess immune composition, we performed flow cytometric analysis of tumor-infiltrating immune cell populations. Oral ATRA treatment significantly increased the number of CD8⁺ T cells within the TME (Fig. 4c), whereas other immune cell populations did not significantly differ in terms of the number or expression of immunosuppressive molecules (Supplementary Fig. 11c–f). Among the tumor-infiltrating CD8⁺ T cells, the number of OVA-specific cells was significantly elevated, indicating that ATRA promotes the accumulation of tumor-specific CD8⁺ T cells within the TME (Fig. 4d). To confirm that these ATRA-induced tumor-specific CD8+ T cells were responsible for the antitumor effect, we ablated CD8+ T cells. The administration of ATRA to TCRβ-KO mice 2 weeks prior to and after GL261-OVA inoculation did not have a therapeutic effect (Supplementary Fig. 12a). Similarly, antibody-mediated depletion of CD8⁺ T cells eliminated the therapeutic effect of ATRA (Fig. 4e). The experimental timeline for the depletion studies is provided in Supplementary Fig. 12b. Under conditions of antibody-mediated CD4⁺ T-cell depletion, mice in the ATRA-treated group exhibited significantly prolonged survival compared with those in the CTRL group, indicating that the therapeutic effect of oral ATRA treatment was observable in the absence of CD4⁺ T cells (Supplementary Fig. 12c). These findings indicate that oral ATRA affects tumor-specific CD8⁺ T cells to mediate glioma suppression.
We next evaluated whether oral treatment with ATRA can confer resistance to exhaustion of tumor-specific CD8+ T cells. The expression of CD44 and CD62L on glioma-infiltrating, OVA-specific CD8+ T cells was comparable between the ATRA and CTRL groups (Supplementary Fig. 13a, b), which is consistent with our previous results in which OT-I T cells were adoptively transferred (Supplementary Fig. 10a, b). ATRA administration upregulated β-catenin (Fig. 4f) and TCF-1βBD (Fig. 4g) expression in OVA-specific CD8⁺ T cells. This was accompanied by a shift toward fewer coexpressed exhaustion markers (Fig. 4h; Supplementary Fig. 13c, d) and a significantly lower proportion of highly exhausted cells expressing all four markers among OVA-specific CD8+ T cells (Fig. 4i). Upon peptide restimulation with OVA257–264, CD8⁺ T cells from ATRA-treated mice exhibited elevated CD69 expression (Fig. 4j, Supplementary Fig. 13e) and increased cytokine production (Fig. 4k, l; Supplementary Fig. 13f), resulting in enhanced polyfunctionality (Fig. 4m). CD8+ T cells from ATRA-treated mice also displayed an increased granzyme B+ CD107A+ cytotoxic population upon restimulation (Fig. 4n, Supplementary Fig. 13f). Furthermore, when tumor-infiltrating CD8⁺ T cells were sorted and cocultured with GL261-OVA cells in vitro, CD8+ T cells derived from ATRA-treated mice exhibited greater tumor cell killing than those from CTRL-treated mice (Fig. 4o). These results suggest that oral ATRA treatment alleviates terminal exhaustion and reinforces the effector program of tumor-specific CD8⁺ T cells in vivo.
ATRA enhances anti-PD-1 efficacy by alleviating CD8⁺ T-cell exhaustion and maintaining effector potential in gliomas
Recent studies suggest that terminal exhaustion of tumor-infiltrating CD8+ T cells is a major contributor to resistance to ICB.9,35,36 On the basis of our findings that ATRA suppresses terminal exhaustion and preserves CD8⁺ T-cell function, we hypothesized that oral ATRA treatment could enhance the efficacy of anti-PD-1 therapy against gliomas. We tested this hypothesis using a spontaneous glioblastoma model induced by EGFRvIII overexpression and Trp53 and Pten deletion, which is characterized by low T-cell infiltration37,38 (Supplementary Fig. 14a). We intracranially inoculated spontaneous glioma-derived tumor cells and orally administered ATRA for 2 weeks before and after tumor injection. Afterward, we treated the mice intraperitoneally with anti-PD-1 antibody or an isotype at 10, 13 and 16 days after tumor cell injection (Supplementary Fig. 14b). Anti-PD-1 monotherapy failed to control tumor progression (Fig. 5a, b; Supplementary Fig. 14c, d; CTRL + IgG vs. CTRL + anti-PD-1). Similarly, ATRA alone showed limited efficacy (Fig. 5a, b; Supplementary Fig. 14c, d, CTRL + IgG vs. ATRA + IgG). In contrast, combination therapy with ATRA and anti-PD-1 markedly enhanced therapeutic efficacy, leading to prolonged survival and a significant reduction in tumor burden (Fig. 5a, b; Supplementary Fig. 14c, d; ATRA + anti-PD-1).
Fig. 5
ATRA-mediated attenuation of terminal exhaustion of CD8+ T cells synergizes with anti-PD-1 treatment in an anti-PD-1-resistant glioma model. a Kaplan–Meier plot of mice orally treated with 200 μg/head ATRA or control (corn oil) for 2 weeks before and after intracranial injection with mouse spontaneous glioblastoma-derived tumor cells and treated with 200 μg/head anti-PD-1 or isotype (IgG) antibodies 10, 13, and 16 days after tumor injection (n = 5 mice per group). b Number of tumor cells assessed 20 days after tumor cell implantation (n = 6 mice per group). Representative histograms and quantification of the gMFI of TCF-1βBD (c) and β-catenin (d) in tumor-infiltrating CD8+ T cells assessed 20 days after tumor cell implantation (n = 6 mice per group). e Distribution of CD8+ T cells according to the number of exhaustion markers (PD-1, TIM-3, LAG-3, and CD39) expressed 20 days after tumor cell implantation (n = 6 mice per group). f Proportion of CD8+ T cells expressing all four exhaustion markers (PD-1, TIM-3, LAG-3, and CD39) assessed 20 days after tumor cell implantation (n = 6 mice per group). g–l Quantification of effector molecule expression in tumor-infiltrating CD8+ T cells 20 days after tumor cell implantation following stimulation with PMA/ionomycin for 5 hours. g Proportion of CD69-expressing cells (n = 6 mice per group). h Proportion of IL-2-expressing cells (n = 6 mice per group). i Proportion of IFN-γ-expressing cells (n = 6 mice per group). j Proportion of TNF-α-expressing cells (n = 6 mice per group). k Proportion of cells coexpressing IL-2, IFN-γ and TNF-α (n = 6 mice per group). l Proportion of cells coexpressing granzyme B and CD107A (n = 6 mice per group). m Representative histograms and proportions of apoptotic (annexin V+) tumor cells (spontaneous glioma-derived tumor cells) cocultured with CD8+ TILs from each group (n = 3 mice for the CTRL + IgG and ATRA + IgG groups; n = 4 mice for the CTRL + anti-PD-1 and ATRA + anti-PD-1 groups). The data were analyzed using the log-rank test (a) or one-way ANOVA with Tukey’s multiple comparison test (b–m). Representative data from two (a) or one (b–m) independent experiment are shown. The error bars represent the means ± s.e.m
We next analyzed immune cell populations within the TME at 20 days after tumor cell injection (Supplementary Fig. 14e). Compared with the CTRL + IgG group, the CTRL + anti–PD-1 group showed a reduction in microglia and a reciprocal increase in macrophages, whereas no significant differences were observed in other immune cell populations, including monocytes, CD8⁺ T cells, non-Treg CD4⁺ T cells, or Tregs (Supplementary Fig. 14f). Analysis of immunosuppressive molecule expression revealed elevated PD-L1 expression by macrophages and monocytes in the CTRL + anti–PD-1 group, whereas arginase 1 expression remained unchanged (Supplementary Fig. 14g, h).
We next evaluated whether anti–PD-1 antibody treatment and oral ATRA administration altered the exhaustion status of tumor-infiltrating CD8⁺ T cells. Oral ATRA administration, anti–PD-1 antibody treatment, or their combination had only marginal effects on CD44 and CD62L expression, with CD8⁺ T cells predominantly exhibiting a CD44⁺CD62L⁻ phenotype ( > 90%) across all experimental groups (Supplementary Fig. 15a, b). CD8⁺ T cells from the ATRA + IgG and ATRA + anti-PD-1 groups exhibited significantly upregulated TCF-1βBD expression compared with those from the CTRL + IgG group (Fig. 5c), and significant β-catenin upregulation was observed in the ATRA + anti-PD-1 group (Fig. 5d). We next evaluated exhaustion marker coexpression across treatment groups. Both ATRA alone and ATRA + anti-PD-1 treatment induced a shift toward fewer coexpressed exhaustion markers (Fig. 5e; Supplementary Fig. 15c, d), with a significantly reduced proportion of highly exhausted CD8⁺ T cells expressing all four exhaustion markers (Fig. 5f). These findings indicate that oral ATRA suppresses terminal exhaustion in this spontaneous glioma-derived model.
We next assessed the effector potential of tumor-infiltrating CD8⁺ T cells (Supplementary Fig. 16a). Following PMA/ionomycin stimulation, compared with the CTRL + IgG group, the ATRA + anti–PD-1 group exhibited significantly higher CD69 expression; however, no significant changes were observed in the CTRL + anti–PD-1 or ATRA + IgG groups (Fig. 5g; Supplementary Fig. 16b). Consistently, cytokine production and the frequency of polyfunctional CD8⁺ T cells significantly increased only in the ATRA + anti–PD-1 group (Fig. 5h–k; Supplementary Fig. 16c–d). Assessment of the cytotoxic potential revealed a significant increase in the granzyme B⁺ CD107A⁺ CD8⁺ T-cell population in the ATRA + anti–PD-1 group (Fig. 5l; Supplementary Fig. 16e). Furthermore, when tumor-infiltrating CD8⁺ T cells were sorted and cocultured with spontaneous glioma-derived tumor cells in vitro, CD8⁺ T cells from ATRA + anti–PD-1–treated mice exhibited enhanced tumor cell killing, whereas those from the CTRL + anti–PD-1 and ATRA + IgG groups showed killing capacities comparable to those of the CTRL + IgG group (Fig. 5m).
To confirm the combined therapeutic effect of oral ATRA administration and anti–PD-1 antibody treatment, we evaluated therapeutic efficacy in an orthotopic GL261 glioma model (Supplementary Fig. 17a). Consistent with observations in the spontaneous glioma-derived model, combined ATRA and anti–PD-1 treatment elicited a synergistic therapeutic effect (Supplementary Fig. 17b). Moreover, increased cytokine production was observed in the ATRA + anti–PD-1 group following PMA/ionomycin stimulation (Supplementary Fig. 17c, d), indicating that the combined therapeutic effect is reproducible across distinct glioma models.
Collectively, these results demonstrate that ATRA potentiates anti-PD-1 therapy by enhancing the antiglioma responses of CD8+ T cells, thereby contributing to the reversal of therapeutic resistance in glioma.
ATRA administration potentiates anti-PD-1 therapy against recurrent glioma
Glioblastoma recurs in approximately 90% of patients following surgical resection,39,40 often arising from the resection margin or the primary site and occasionally necessitating repeat surgery.41,42,43 Although adjuvant anti–PD-1 therapy has been introduced to prevent tumor recurrence, its therapeutic efficacy remains limited.36,44,45 To evaluate whether combined ATRA and anti–PD-1 treatment could prevent glioma recurrence, we performed tumor resection of gliomas formed in mice that were intracranially injected with organoid cells derived from spontaneous glioma (induced by EGFRvIII overexpression and loss of Trp53 and Pten) (Supplementary Fig. 18a). Although surgical resection resulted in effective removal of the primary tumor, residual glioma cells at the resection margin and adjacent ventricular regions resulted in tumor recurrence over time (Supplementary Fig. 18b). As a result, surgical resection significantly increased survival but failed to confer long-term survival (Supplementary Fig. 18c).
In this recurrent glioma model, we treated mice with oral ATRA and an intraperitoneal anti-PD-1 antibody after surgical resection and evaluated mouse survival. Compared with surgical resection alone (CTRL + IgG), ATRA + anti-PD-1 therapy not only significantly improved survival but also resulted in long-term survival (Fig. 6a). Notably, treatment with anti-PD-1 or ATRA alone also significantly improved survival, but no long-term survival was observed (Fig. 6a; CTRL + anti–PD-1 and ATRA + IgG).
Fig. 6
ATRA treatment has synergistic effects on anti-PD-1 therapy to control recurrent glioma. a Kaplan–Meier plot of mice that underwent surgical resection on day 9 and were subsequently orally treated with 200 μg/head ATRA or control (corn oil) for 3 weeks and treated with 200 μg/head anti-PD-1 or isotype (IgG) antibodies 10, 13, and 16 days after tumor injection (n = 8 mice per group). b Number of tumor cells in recurrent tumors 25 days after initial tumor implantation (n = 6 mice per group). Representative histogram and quantification of the gMFI of TCF-1βBD (c) and β-catenin (d) in tumor-infiltrating CD8+ T cells assessed 25 days after initial tumor implantation (n = 6 mice per group). e Distribution of tumor-infiltrating CD8+ T cells according to the number of exhaustion markers expressed (PD-1, TIM-3, LAG-3, and CD39) 25 days after initial tumor implantation (n = 6 mice per group). f Proportion of tumor-infiltrating CD8+ T cells expressing all four exhaustion markers (PD-1, TIM-3, LAG-3, and CD39) 25 days after initial tumor implantation (n = 6 mice per group). g–l Quantification of effector molecule expression in tumor-infiltrating CD8 + T cells 25 days after initial tumor implantation following stimulation with PMA/ionomycin for 5 hours. g Proportion of CD69-expressing cells (n = 6 mice per group). h Proportion of IL-2-expressing cells (n = 6 mice per group). i, Proportion of IFN-γ-expressing cells (n = 6 mice per group). j Proportion of TNF-α-expressing cells (n = 6 mice per group). k Proportion of cells coexpressing IL-2, IFN-γ and TNF-α (n = 6 mice per group). l Proportion of cells coexpressing granzyme B and CD107A (n = 6 mice per group). m Expression levels of the RA-DEG signature (left) and WNT signaling signature from the KEGG database (right) in the total CD8+ T-cell population of publicly available human glioblastoma patient-derived scRNA-seq data (GSE235913). NR: nonresponders. R: responders. n, Pearson’s correlation between the expression of the RA-DEG signature and the WNT signaling signature in the CD8+ T-cell population shown in Fig. 6m. The correlation coefficient (Pearson r) and p value are presented. o, Kaplan‒Meier plot with a 95% confidence interval of overall survival of glioblastoma patients from CGGA mRNAseq_693 data. Among the 693 patients, 179 ICB treatment-naïve, WHO grade IV patients with known survival durations and a history of chemoradiotherapy were selected for further analysis. Patients were classified according to the abundance of the CD8TRA population in the tumor, and patients showing higher proportion of CD8TRA than median value obtained from the total number of assessed patients were classified into the high group (n = 90), and patients showing lower proportion of CD8TRA than median value were classified into the low group (n = 89). The data were analyzed using the log-rank test (a, o), one-way ANOVA with Tukey’s multiple comparison test (b–l), two-tailed unpaired Student’s t test (m), and two-tailed Pearson correlation test (n). Cumulative data from two independent experiments (a) or one independent experiment are shown (b–l). The error bars represent the mean ± s.e.m
Next, we performed a phenotypic analysis of tumor cells and immune cells in treated mice at 25 days after tumor injection (16 days after surgical resection). Compared with those in the surgery-only group, the tumor burden in the anti-PD-1 + ATRA group was significantly lower (Fig. 6b; Supplementary Fig. 19a, b). A difference in microglial abundance was observed between the CTRL + anti–PD-1 and CTRL + IgG groups, whereas no consistent changes were detected among the other immune cell populations across treatment groups (Supplementary Fig. 19c, d). PD-L1 expression in myeloid cells tended to be lower in all treatment groups than in the control group, whereas arginase-1 expression remained unchanged (Supplementary Fig. 19e, f).
We next examined the exhaustion status and activation signatures of tumor-infiltrating CD8⁺ T cells upon restimulation under these conditions. Consistent with our previous observations, CD44 and CD62L expression was comparable across all experimental groups, with the majority of CD8⁺ T cells exhibiting a CD44⁺CD62L⁻ phenotype (Supplementary Fig. 20a, b). Compared with those in the CTRL + IgG group, the expression of TCF-1βBD and β-catenin in the ATRA + IgG and ATRA + anti–PD-1 groups were significantly increased (Fig. 6c, d). Stratification of exhaustion status on the basis of multiple exhaustion markers revealed a shift toward fewer coexpressing exhaustion markers across treatment groups, particularly in the combination treatment group (ATRA + anti-PD-1) (Fig. 6e; Supplementary Fig. 20c, d), with a significantly reduced proportion of highly exhausted cells expressing all four markers in the ATRA + anti–PD-1 group compared with that in the CTRL + IgG group (Fig. 6f).
To assess the effector potential of tumor-infiltrating CD8⁺ T cells, cells were stimulated with PMA/ionomycin, and the expression of activation markers, cytokines, and cytotoxic molecules was analyzed (Supplementary Fig. 21a). CD69 expression was significantly greater in the ATRA + anti-PD-1 group than in the CTRL + IgG group (Fig. 6g; Supplementary Fig. 21b). Cytokine analysis revealed that IFN-γ production was elevated in the CTRL + anti-PD-1 and ATRA + anti-PD-1 groups compared with those in the CTRL + IgG group, whereas IL-2 and TNF-α production was significantly increased only in the ATRA + anti–PD-1 group (Fig. 6h–j; Supplementary Fig. 21c, d). Accordingly, the frequency of polyfunctional CD8⁺ T cells was significantly greater in the ATRA + anti-PD-1 group (Fig. 6k). In line with these findings, the proportion of granzyme B⁺ CD107A⁺ cytotoxic CD8⁺ T cells was also significantly greater in the ATRA + anti-PD-1 group than in the CTRL + IgG group (Fig. 6l; Supplementary Fig. 21e). Taken together, these data demonstrate that combined treatment with ATRA and anti-PD-1 therapy after surgical resection suppresses glioma recurrence in vivo and preserves CD8⁺ T-cell functionality.
Next, we sought to further evaluate the clinical relevance of ATRA-induced changes using publicly available glioblastoma transcriptomic datasets. To this end, exhaustion was induced in ATRA- or CTRL-conditioned OT-I T cells using the in vitro exhaustion protocol described in Fig. 1a, followed by bulk RNA sequencing to identify differentially expressed genes (Supplementary Table 1). From these data, we defined a gene set comprising human homologs that are significantly upregulated in ATRA-conditioned OT-I T cells (RA-DEG, n = 2537 genes, which are listed in Supplementary Table 2) and assessed the expression patterns of this gene set in glioblastoma transcriptomic datasets.
Using a publicly available NanoString panel of glioblastoma tumor samples obtained before and after anti–PD-1 therapy,46 we found that anti–PD-1 therapy did not induce a significant change in the expression of the RA-DEG signature captured by the NanoString platform at the cohort level (Supplementary Fig. 22a). Consistently, stratification of patients based on increased (ΔRA-DEG signature-Pos) or decreased (ΔRA-DEG signature-Neg) RA-DEG expression following anti–PD-1 treatment did not result in a significant separation of overall survival curves (Supplementary Fig. 22b).
We next examined the relationships between changes in RA-DEG expression before and after anti–PD-1 treatment and T-cell activation–associated signatures. To this end, we analyzed curated gene sets related to T-cell activation and effector functions together with a subset of RA-DEG genes defined by the exclusion of overlap with these activation- and effector-associated gene sets from RA-DEG genes (nonoverlapping RA-DEG; Supplementary Fig. 22c–g). Notably, changes in nonoverlapping RA-DEG expression following anti–PD-1 treatment were significantly correlated with multiple T-cell activation/effector function–related gene sets (Supplementary Fig. 22h–k), supporting a link between ATRA-responsive transcriptional dynamics and T-cell activation/effector states in this context.
Next, we analyzed single-cell RNA sequencing (scRNA-seq) data from tumor samples from glioblastoma patients treated with anti-PD-1 therapy (GSE235913)47 (Supplementary Fig. 23a, Supplementary Table 3). To account for the sparsity of the single-cell transcriptomic data, the genes detectably expressed in CD8⁺ T cells from scRNA-seq data were selected on the basis of expression frequency, and this filtered RA-DEG subset was used to calculate an RA-DEG signature score. With respect to total CD8⁺ T cells, the RA-DEG signature expression score was significantly greater in anti-PD-1 responder patients (Fig. 6m, left). Notably, while the CD8T-TCF1/PD-1hi subcluster did not significantly differ between responders and nonresponders, the remaining CD8⁺ T-cell subclusters exhibited significantly higher RA-DEG signature scores in responders (Supplementary Fig. 23b). These data suggest that anti-PD-1 responsiveness in glioblastoma patients may be correlated with ATRA signaling. Additionally, CD8⁺ T cells from responders also presented elevated expression of genes related to the KEGG pathway database-derived WNT signaling signature that are detectably expressed in CD8⁺ T cells (Fig. 6m, right). RA-DEG signature expression scores positively correlated with WNT signaling signature expression scores in CD8+ T cells (Fig. 6n), suggesting the possible upregulation of WNT signaling according to ATRA signaling among CD8+ T cells from glioblastoma patients. Consistent with our data obtained from mice, CD8+ T cells from anti-PD-1 responder patients, whose RA-DEG and WNT signaling signatures were higher, exhibited lower exhaustion scores than those of the other patients described by Zheng et al.48 (Supplementary Fig. 23c, d). These findings suggest that glioblastoma patients who do not respond to anti-PD-1 therapy may benefit from the addition of ATRA to activate the WNT‒TCF-1βBD axis in CD8+ T cells, although further research is needed to investigate this possibility.
To further assess the prognostic value of RA-responsive CD8+ T cells for glioblastoma patient survival, we used CIBERSORTx49 trained on scRNA-seq data to deconvolute bulk RNA-seq profiles with matched patient survival data obtained from the Chinese Glioma Genome Atlas (CGGA).50 To construct the CIBERSORTx signature matrix, we combined our CD8⁺ T-cell data with scRNA-seq datasets from human high-grade glioma–infiltrating CD8⁺ T cells9 and performed unsupervised clustering, yielding distinct CD8⁺ T-cell states (Supplementary Fig. 23e; Supplementary Table 4). To identify the CD8⁺ T-cell cluster most strongly associated with ATRA signaling, we next performed enrichment analysis of the complete RA-DEG gene set across the identified CD8⁺ T-cell clusters. For each cluster, we tested whether cluster-specific upregulated marker genes were overrepresented among the RA-DEG gene set relative to a shared background gene universe using a one-tailed Fisher’s exact test with false discovery rate correction. This revealed that cluster 4 had the greatest enrichment of RA-DEG (Supplementary Fig. 23f), which was subsequently defined as the RA-responsive CD8⁺ T-cell population (CD8TRA). We then estimated the proportion of the CD8TRA population in the bulk RNA-seq profiles from glioblastoma patients in the CGGA mRNAseq_693 cohort. Among 179 ICB treatment-naïve WHO grade IV patients with a known survival duration and a history of chemoradiotherapy, patients with high CD8TRA abundance had significantly improved overall survival compared with those with low CD8TRA abundance (Fig. 6o). Importantly, this association remained significant after adjustment for key clinical variables, including age, sex, and disease status, and showed a consistent trend upon additional adjustment for established molecular prognostic markers in multivariate Cox regression analyses (Supplementary Table 5). Collectively, these data highlight the potential prognostic value and clinical relevance of RA-responsive CD8⁺ T cells in glioblastoma.
