


Study overview
This study employed a five-step framework to identify and validate novel therapeutic strategies for NECC. First, we established the CMC-NECC Cohort (n = 715) and non-NECC Cohort (n = 1059), tracking survival outcomes following first-line antitumor therapies, complemented by in vitro drug sensitivity assays to profile differential responses between NECC and conventional cervical cancer cell lines. Second, we performed multi-omics profiling (transcriptomics, proteomics, and phosphoproteomics) on treatment-naïve tumor specimens and paired NATs from 10 randomly selected CMC-NECC cases to define molecular signatures and identify druggable vulnerabilities. Third, candidate agents were rigorously screened in vitro for monotherapy efficacy and combinatorial potential. Fourth, integrated multi-omics and functional assays elucidated the mechanistic bases for optimized combination strategies. Finally, in vivo validation was conducted using cell line-derived xenograft (CDX) models to confirm therapeutic efficacy and dissect pharmacodynamic mechanisms. (Supplementary Fig. 1). This study was approved by the Institutional Review Board (IRB) of Fujian Maternity and Child Health Hospital (Approval No. 2024KY033) and conducted in accordance with the Declaration of Helsinki. Written informed consent was obtained from all participants prior to sample collection. The animal experiments were approved by the Animal Ethics Committee of Fujian Medical University (Approval No. IACUC FIMU 2023-0272).
Clinical validation cohort for chemotherapeutic response
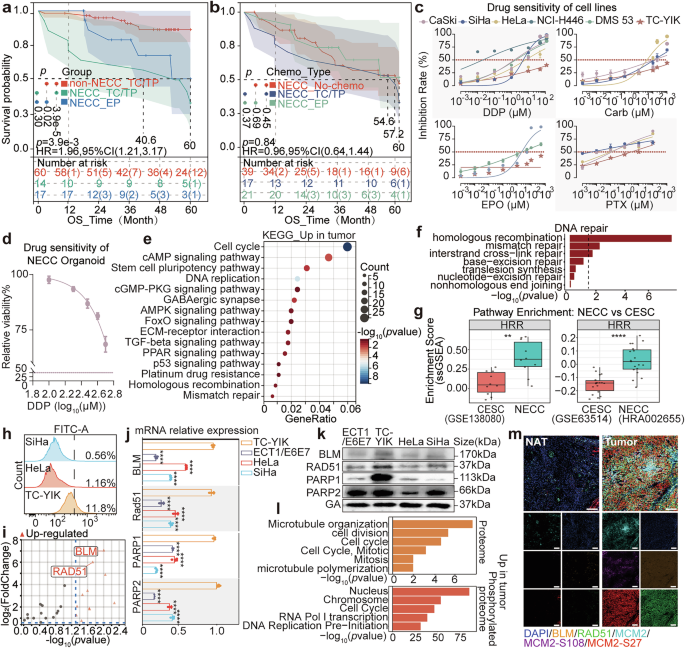
To quantify the real-world effectiveness of empirical first-line chemotherapy in NECC, we analyzed patients treated with cisplatin, carboplatin, or etoposide from the CMC-NECC. The CMC-NECC cohort comprised histologically confirmed NECC cases diagnosed and treated between January 2008 and May 2024 across fifteen medical centers in China: Fujian Maternity and Child Health Hospital, Fujian Cancer Hospital, The First Affiliated Hospital of Fujian Medical University, Zhangzhou Affiliated Hospital of Fujian Medical University, Mindong Hospital Affiliated to Fujian Medical University, The First Hospital of Putian City, Jiangxi Maternal and Child Health Hospital, Xiangya Hospital of Central South University, Shaanxi Cancer Hospital, Gansu Maternal and Child Health Hospital, Hubei Maternal and Child Health Hospital, Shengjing Hospital of China Medical University, Shanghai First Maternity and Infant Hospital, Shenzhen Maternity and Child Healthcare Hospital, and Peking Union Medical College Hospital. Additionally, we recruited 1,059 patients diagnosed with squamous cell carcinoma or adenocarcinoma from the same 15 centers in China (2008-2020) to serve as the control group, comprising patients with non-NECC.
To minimize the influence of confounding factors and enhance the reliability of comparisons between the CMC-NECC and non-NECC groups, we employed propensity score matching (PSM), adjusting for variables including patient age, surgical approach, FIGO stage, lymphovascular space invasion (LVSI), lymph node involvement status, preoperative radiotherapy, and postoperative radiotherapy.
The first-line chemotherapeutic regimens evaluated in this cohort analysis were based on guideline-recommended combinations for cervical cancer, utilizing the agents cisplatin, carboplatin, and etoposide. The specific combination regimens and their abbreviations were as follows: TP/TC regimen, comprising a platinum agent (cisplatin or carboplatin) with paclitaxel; and EP regimen, comprising etoposide with cisplatin. For survival analysis, patients were categorized into distinct groups based on histology (NECC vs. non-NECC) and treatment received. Specifically, to compare chemotherapy efficacy between histologic types, we compared NECC patients receiving TP/TC versus non-NECC patients receiving TP/TC and NECC patients receiving EP. To assess survival benefit within the NECC population, we compared NECC patients receiving TP/TC-based or EP-based chemotherapy versus NECC patients not receiving any chemotherapy. Prognostic analyses were subsequently conducted between the matched NECC and non-NECC cohorts. Overall survival (OS) was defined as the time from diagnosis to death from any cause. Detailed baseline characteristics, treatment regimens, and follow-up data were extracted from medical records and are summarized in Supplementary Table 1, and the inclusion and exclusion criteria table is shown in Supplementary Fig. 2a.
Multi-omics discovery cohort
From the CMC-NECC cohort, treatment-naïve patients (no prior chemotherapy or radiotherapy) were selected. Ten participants were randomly chosen using a simple random sampling algorithm implemented in R software (v4.2.1). For each case, matched pairs of NECC tumor tissue and adjacent nontumour cervical tissue (NATs, ≤1 cm from tumor margin) were collected during surgical resection. Tumor and NATs tissues were sectioned consecutively (5–10 μm thick). The first and last sections (1st and 10th) were stained with hematoxylin and eosin (H&E) and evaluated by a pathologist to confirm the location and area of the tumor and NATs regions. Only samples with tumor and NATs cross-sectional diameters greater than 0.5 cm were considered valid for further experiments. Based on the H&E-stained sections, a “map” of NECC and NATs tissues was created to guide precise microdissection of the unstained “white sections.” Tumor regions were scraped into sterile, nuclease-free tubes. For NATs tissue, only regions within 1 cm of the tumor edge were scraped and stored in a separate tube. The minimum sample size for each omics analysis (e.g., transcriptomics, proteomics) was at least 5 white sections (10 μm thick) per sample. Clinicopathological data are presented in Supplementary Table 5. Fresh tumor tissue and NATs tissue were obtained intraoperatively, snap-frozen in liquid nitrogen within 20 min of devascularisation, and stored at −80 °C until simultaneous transcriptomic, global-proteomic, and phosphoproteomic analyses. Sample collection was approved by the institutional ethics committee, and all participants provided written informed consent.
Cell culture and reagents
The human cervical neuroendocrine carcinoma cell line TC-YIK, cervical squamous cell carcinoma line SiHa, adenocarcinoma line HeLa, immortalized cervical epithelial cell line ECT1/E6E7, and ovarian cancer lines A2780 and SKOV3 were purchased from iCELL or ATCC (all cell, consumables, reagents, antibodies, and their catalog numbers are provided in Supplementary Tables 6 and 7). CAFs and NFs were isolated from freshly resected cervical cancer and adjacent normal tissues, respectively, and authenticated by immunophenotyping (FAP⁺, α-SMA⁺).
Cells were cultured in complete media as recommended by the suppliers, at 37 °C in a humidified atmosphere with 5% CO₂. For co-culture experiments, TC-YIK or ECT1/E6E7 cells were seeded in the lower chamber of 0.4 μm Transwell inserts (Jet Biofil, China), while CAFs or NFs were cultured in the upper chamber. After 24 h of co-culture under serum-starved conditions, cells were harvested for downstream assays.
Vector construction and stable cell line transfection
Cell culture conditions were as described in Section cell culture and reagents. TC-YIK cells were transduced with shBLM lentiviruses (GV493/hU6–MCS–CBh–gcGFP–IRES–puromycin, Genechem, China) in the presence of polybrene (4–8 μg/mL) to stably knock down BLM expression; TC-YIK and ECT1/E6E7 cells were transduced with shE2F1 lentiviruses (GV493/hU6–MCS–CBh–gcGFP–IRES–puromycin, Genechem, China) to stably knock down E2F1 expression; and TC-YIK and ECT1/E6E7 cells were transduced with BLM overexpression lentiviruses (GV747/CMV enhancer–MCS–T2A–puromycin, Genechem, China) to stably overexpress BLM. Puromycin (1–2 µg/mL, Sigma) was used to select cells at 48 h after transduction, and cells were continuously selected for ~2 weeks to establish stable cell lines. The target sequences for shBLM were 5′-GCTACATATCTGACAGGTGAT-3′ (shBLM-1), 5′-CGAAGGAAGTTGTATGCACTA-3′ (shBLM-2), and 5′-GCCTTTATTCAATACCCATTT-3′ (shBLM-3); the target sequences for shE2F1 were 5′-ACCTCTTCGACTGTGACTTTG-3′ (shE2F1-1), 5′-TAAGAGCAAACAAGGCCCGAT-3′ (shE2F1-2), and 5′-CATCCAGCTCATTGCCAAGAA-3′ (shE2F1-3). The negative control sequence was 5′-TTCTCCGAACGTGTCACGT-3′ (CON313, Genechem, China). An empty-vector control lentivirus (CON563, Genechem, China) was used for BLM overexpression. Knockdown/overexpression efficiency was confirmed by qPCR and Western blot.
RNA sequencing (RNA-seq)
Total RNA was extracted using TRIzol reagent (Invitrogen) and quantified using a Qubit 4.0 fluorometer. RNA integrity was assessed using an Agilent 2100 Bioanalyzer (RIN ≥ 7.0). Libraries were prepared using the NEBNext Ultra RNA Library Prep Kit and sequenced on the Illumina NovaSeq 6000 platform (150 bp paired-end reads). Raw reads were processed using FastQC and Trimmomatic for quality control. Alignment to the human reference genome (GRCh38) was performed using HISAT2. Gene-level quantification was conducted using featureCounts, and differential expression analysis was performed using DESeq2 (|log₂FC| > 1, FDR < 0.05). Gene Ontology (GO) and KEGG pathway enrichment analyses were carried out using DAVID v6.8.
Genomics
WES was performed to interrogate coding regions enriched by probe hybridization and to profile coding-region variants relevant to tumor genomics. Raw sequencing data underwent routine quality assessment and filtering to remove low-quality reads, followed by evaluation of sequencing error-rate distribution and base-quality profiles. Clean reads were aligned to the human reference genome (B37/GRCh37), and alignment-based metrics, including sequencing depth and target-region coverage, were summarized to ensure data quality. Variants were then identified from the aligned data, and single-nucleotide polymorphisms (SNPs) were summarized as part of the standard variant-detection output.
HRD status in tumor tissues and cell-line samples was assessed using an amplicon-based targeted NGS assay for HRR-related gene variants and genomic scar scoring (GSS). The panel covered coding regions and exon–intron junctions of HRR-related genes and incorporated genome-wide SNP loci for GSS calculation. Reads were analyzed against the human reference genome (hg19), and variants were reported following HGVS nomenclature. HRD positivity was defined as GSS ≥ 45; samples with GSS < 45 were considered HRD-positive only if pathogenic/likely pathogenic BRCA1/2 variants were detected, otherwise HRD-negative. For Formalin-fixed paraffin-embedded (FFPE) tissue specimens, quality control metrics included Q30, BRCA/CDS coverage, BAF noise, and depth noise, and only samples meeting predefined QC criteria were interpreted.
Proteomics and phosphoproteomics
FFPE tissue sections were deparaffinized, rehydrated, and microdissected under H&E guidance. Proteins were extracted using the FFomic method as previously described.44 After tryptic digestion, peptides were desalted and fractionated using high-pH reverse-phase liquid chromatography.
Phosphopeptides were enriched using TiO₂ beads. Samples were analyzed on an EASY-nLC 1200 system coupled to a Q Exactive HF-X mass spectrometer (Thermo Fisher Scientific). Raw MS data were processed using the iProX platform for peptide identification and quantification. Proteins with ≥2 unique peptides and FDR < 1% were retained. Phosphorylation sites were localized using ptmRS. Differential expression analysis was performed using Perseus (p < 0.05, |log₂FC| > 0.58). KSEA was conducted using the KSEAapp R package.
I-SceI–based HDR reporter assay
Cells (SiHa, HeLa, and TC-YIK) were seeded in 24-well plates and transiently cotransfected with the HDR reporter plasmid and the I-SceI endonuclease plasmid (GeneChem, China). Eight hours after transfection, the medium was replaced with complete medium, and the cells were cultured for an additional 48 h. The HR repair efficiency was quantified as the percentage of GFP-positive cells, indicative of successful HDR repair.
Flow cytometry analysis
Cells were treated with the following drugs 48 h after plasmid transfection: CK2 (1 μM, treated for 24 h), hydroxyurea (2 mM, treated for 2 h followed by a 2-h recovery), and PARP1 inhibitor (2.6 μM, treated for 24 h). After drug treatment, GFP-positive cells were quantified using flow cytometry on a BD LSRFortessa™ instrument (BD Biosciences) to assess HRR/HDR repair efficiency. Flow cytometry data were analyzed using FlowJo (v10.8.1).
Cytokine profiling
Cytokine profiling was performed using a membrane-based array (Proteome Profiler Human XL Cytokine Array, ARY022B, R&D Systems). Culture supernatants were collected from CAFs, NFs, TC-YIK cells conditioned with CAFs- or NFs–derived supernatants, TC-YIK cells alone, and CAFs‒TC-YIK co-cultures. Supernatants were harvested after 72 h of culture/conditioning or 72 h of co-culture, clarified by centrifugation, and analyzed with three biological replicates per condition (n = 3). Membranes were incubated with samples overnight, followed by biotinylated detection antibodies and streptavidin-HRP for chemiluminescent detection and imaging. Spot intensities were quantified by transmission scanning, duplicate spots were averaged, background was subtracted, and relative differences were compared across conditions.
Western blotting (WB)
Total protein was extracted using RIPA lysis buffer (Yaenzyme Biotech Co., Ltd. ShangHai, China) supplemented with protease inhibitor cocktail (Roche, Switzerland) and phosphatase inhibitors (Yaenzyme). Protein concentration was quantified using the BCA Protein Assay Kit (Yaenzyme). Equal amounts of protein (20 μg per lane) were separated by SDS-PAGE (Yaenzyme) and transferred onto PVDF membranes (Millipore, USA). Membranes were blocked with 5% nonfat milk in TBST for 1 h at room temperature, followed by overnight incubation at 4 °C with primary antibodies against BLM, RAD51, PARP1, PARP2, E2F1, γH2A.X, phospho-Chk1-S345, and GAPDH. After washing with TBST, the membranes were incubated with HRP-conjugated secondary antibodies (1:50,000, Tagene Biotech Co., Ltd., Xiamen, China) for 1 h at room temperature. Protein bands were visualized using ECL chemiluminescent substrate (Yaenzyme) and imaged using the ChemiDoc Imaging System (Bio-Rad). Band intensities were quantified using ImageJ software and normalized to GAPDH. All Western blot experiments were performed in biological triplicates to ensure reproducibility.
Quantitative real-time PCR (qRT‒PCR)
Total RNA was extracted using TRIzol reagent (Invitrogen) according to the manufacturer’s instructions. RNA concentration and purity were assessed using a NanoDrop 2000 (Thermo Fisher). cDNA was synthesized from 1 μg of total RNA using the PrimeScript RT Reagent Kit (Takara, Japan). qPCR was performed using SYBR Green PCR Master Mix (Applied Biosystems) on the ABI 7500 Real-Time PCR System. Each reaction was run in triplicate, and relative gene expression was calculated using the 2(−ΔΔCt) method, with GAPDH as the internal control.
The sequences of primers used in this study are listed in Supplementary Table 8. All qPCR assays were performed in three independent biological replicates to ensure data reliability.
Cell immunofluorescence
Cells were seeded on glass coverslips in 24-well plates. Cells were treated with CK2 inhibitor (1 nM) for 24 h, hydroxyurea (HU, 2 mM) for 2 h followed by a 2 h recovery, and/or a PARP2 inhibitor (2.6 μM) for 24 h prior to immunofluorescence staining. After treatment, the cells were fixed with 4% paraformaldehyde for 15 min, permeabilized with 0.3% Triton X-100 for 10 min, and blocked with 5% BSA for 1 h. Coverslips were incubated overnight at 4 °C with primary antibodies against BLM, E2F1, PARP1, PARP2, 53BP1 or phospho-RPA32/RPA2 (Ser8). After three washes, coverslips were incubated with Alexa Fluor 488- or 647-conjugated secondary antibodies (1:500, Beyotime) for 1 h at room temperature. DAPI was used for nuclear staining. Coverslips were mounted with anti-fade mounting medium (Beyotime). Images were acquired using a Zeiss LSM 980 confocal microscope and analyzed using ImageJ with the Cellpose plugin for automated cell segmentation and fluorescence quantification, ensuring unbiased analysis. All imaging and quantification were performed in a blinded manner to reduce observer bias.
Organoid immunofluorescence
Organoid samples were processed as FFPE sections and stained using a TSA-based multiplex immunofluorescence workflow. Sections were baked at 65 °C for 2 h, deparaffinized in xylene, and rehydrated through graded ethanol (95%, 85%, and 75%; 5 min each), followed by PBS washes (3 × 5 min) and a brief PBST wash (30 s). Antigen retrieval was performed in EDTA buffer (pH 9.0) or citrate buffer (pH 6.0) by microwaving (buffer preheating for 10 min, followed by heating with slides for 25 min at medium-low power), and sections were then washed with PBS (3 × 5 min). Endogenous peroxidase activity was quenched with 3% H₂O₂ for 10 min at room temperature, followed by PBS washes (3 × 5 min). Sections were blocked with normal nonimmune goat serum (100 μL per section) for 20 min at room temperature. Primary antibodies were applied and incubated overnight at 4 °C, using the same antibody panel and dilutions as described in Section cell immunofluorescence (BLM, E2F1, PARP1, PARP2, 53BP1, and phospho-RPA32/RPA2 (Ser8); all 1:500). After PBST washes (3 × 5 min), sections were incubated with an HRP-polymer secondary reagent for 30 min at room temperature and washed with PBS (5 × 5 min). TSA fluorophore development was performed by incubation with tyramide fluorophore reagents (e.g., 520/570) for 5 min, followed by PBST washes (3 × 5 min). Nuclei were counterstained with DAPI for 10 min at room temperature in the dark, followed by PBS washes (3 × 5 min), and sections were mounted with anti-fade mounting medium prior to fluorescence imaging. For multiplex staining, the antibody–HRP-Polymer–TSA cycle was repeated sequentially for each target as needed.
Chromatin immunoprecipitation (ChIP)
ChIP assays were performed using the SimpleChIP Enzymatic Chromatin IP Kit (CST, USA) according to the manufacturer’s instructions. Briefly, cells were crosslinked with 1% formaldehyde for 10 min, quenched with glycine, and lysed. Chromatin was sheared to 200–500 bp fragments using a Covaris ultrasonicator. After preclearing with Protein G magnetic beads, chromatin was immunoprecipitated with anti-E2F1 antibody (CST, #3742) or control IgG overnight at 4 °C. Immunocomplexes were washed, eluted, and reverse-crosslinked. DNA was purified and analyzed by qPCR using primers targeting the BLM promoter region. Primer sequences are listed in Supplementary Table 8. ChIP‒qPCR results are presented as % of input and fold enrichment over IgG control, as recommended by ENCODE and CST guidelines.
Drug sensitivity assays
Cells were seeded in 96-well plates (5 × 10³ cells/well) and treated with increasing concentrations of cisplatin, carboplatin, etoposide, paclitaxel, olaparib, or BLM inhibitor for 24–48 h. Cell viability was assessed using the CCK-8 assay. IC₅₀ values were calculated using GraphPad Prism 9.5.1. Synergistic effects were evaluated using the ZIP model (synergyFinder R package).
Organoid drug sensitivity assay (ATP-based luminescence)
Cervical cancer organoids were plated in 96-well plates and treated with compounds as indicated. For screening, 29 compounds were tested across six concentrations with three technical replicates per concentration, together with medium-only controls (n = 3) and vehicle controls containing 0.1% DMSO (1:1,000; n = 3). Organoids were treated for 3 days with a medium change on day 2, and bright-field images were collected at days 0–3 (40× and 100×). Viability was quantified on day 3 using the CellCounting-Lite® 3D Luminescent ATP assay and normalized to the corresponding controls.
For dose–response profiling, organoids were treated for 48 h with olaparib (0.1–50 μM), BLM (1–100 μM), or cisplatin (0-100 μM) (three replicates per condition). Olaparib and BLM were prepared in DMSO and cisplatin in water; matched vehicle controls (0 μM) were included. Luminescence was measured at 48 h to fit dose–response curves and calculate IC50 values. For efficacy validation, organoids were treated for 48 h with single agents or combinations (olaparib 500 μM; BLM 500 μM; cisplatin 200 μM), followed by bright-field imaging and ATP-based viability measurement (three replicates per condition).
DNA damage and repair assays
DNA double-strand breaks (DSBs) were assessed by immunofluorescence staining of γH2A.X and RAD51 foci. Cells were irradiated (4 Gy) or treated with drugs, fixed after 6–24 h, and stained with primary antibodies against γH2A.X (ABclonal/AP0687) and RAD51 (Abcam/ab88752). Foci were counted in ≥100 cells per group using ImageJ.
EdU cell proliferation assay
Cell proliferation was assessed using the EdU Cell Proliferation Kit (Beyotime, China) according to the manufacturer’s instructions. Briefly, cells were seeded in 24-well plates and incubated with 50 μM EdU for 2–6 h at 37 °C, a duration optimized in pilot experiments to ensure labeling during the log-phase of growth. After fixation with 4% paraformaldehyde and permeabilization with 0.3% Triton X-100, the cells were incubated with Click reaction cocktail for 30 min. Nuclei were counterstained with Hoechst 33342. Images were captured using a Zeiss LSM 980 confocal microscope. EdU-positive cells were quantified using ImageJ and expressed as a percentage of total nuclei.
Mouse xenograft model
To evaluate the antitumor efficacy of BLM and PARP inhibition in vivo, two independent xenograft experiments were performed using female BALB/c nude mice (4–6 weeks old, Beijing Vital River Laboratory Animal Technology Co., Ltd.). All animals were housed under specific pathogen-free (SPF) conditions with free access to food and water. Animal procedures were approved by the Ethics Committee of Fujian Maternity and Child Health Hospital and conducted in accordance with institutional guidelines.
TC-YIK monoculture xenograft
TC-YIK cells (1 × 10⁶ cells/mouse) were resuspended in a 1:1 mixture of PBS and Matrigel (Corning) and subcutaneously injected into the right flank of each mouse. When tumor volumes reached approximately 50 mm³, mice were randomly assigned into four treatment groups (n = 4 per group):
Control group: received daily intraperitoneal (i.p.) and intragastric gavage (i.g.) injections of vehicle; BLM inhibitor (B-i) group: received ML216 at 25 mg/kg/day via i.p. injection; PARP inhibitor (P-i) group: received olaparib at 50 mg/kg/day via i.g.; Combination group (B-i and P-i): received both ML216 (25 mg/kg/day) and olaparib (50 mg/kg/day).
TC-YIK and CAFs/NFs cotransplantation xenograft
To investigate the role of CAFs in modulating treatment response, TC-YIK cells were mixed with CAFs or NFs at a 1:1 ratio (total 2 × 10⁶ cells/mouse) and coinjected subcutaneously. When tumors reached 50 mm³, mice were similarly randomized into the four treatment groups described above (n = 7 per group).
Tumor monitoring and endpoint analysis
Tumor length (L) and width (W) were measured every 2 days using a vernier caliper, and tumor volume was calculated as V = 0.5 × L × W². After 14 days of treatment, all mice were euthanized, and tumors were excised and weighed. Part of the tumor tissue was fixed in 4% paraformaldehyde for H&E staining and immunohistochemical (IHC) analysis (e.g., TUNEL, Ki67, γH2A.X, RAD51, BLM, α-SMA); the remainder was snap-frozen for molecular analyses. Major organs (heart, liver, spleen, lungs, kidneys) were also collected for H&E staining to assess potential drug-related toxicity.
Cancer-associated fibroblast staining in tumor tissues
Tumor tissues were collected from the TC-YIK and CAFs/NFs cotransplantation xenograft model. After fixation in 4% paraformaldehyde for 24 h, the samples were paraffin-embedded and sectioned at 4 μm thickness. Sections were deparaffinized in xylene and rehydrated through a graded ethanol series. Antigen retrieval was performed using citrate buffer (pH 6.0) at 95 °C for 20 min. After blocking with 5% normal goat serum for 30 min, the sections were incubated overnight at 4 °C with primary antibodies against the CAFs markers α-SMA and FAP. After washing with PBS, the sections were incubated with Alexa Fluor 488- or 647-conjugated secondary antibodies (1:500, Beyotime) for 1 h at room temperature. Finally, the sections were counterstained with DAPI for 10 min and mounted with anti-fade mounting medium (Beyotime). Stained sections were analyzed by microscopy using a Zeiss LSM 980 confocal microscope.
Bioinformatics and data integration
Multi-omics data integration was performed using R 4.2.1. RNA-seq and proteomics data were matched by gene symbol, and correlation analyses were conducted using Pearson correlation. Pathway enrichment was performed using DAVID 6.8, and GSEA KSEA was conducted using the KSEAapp package. Transcription factor prediction was performed using JASPAR, hTFtarget, and CistromeDB. Tumor microenvironment deconvolution was performed using the xCell algorithm. Drug sensitivity data were extracted from the DepMap and CCLE databases. All bioinformatics workflows were performed under standard quality control and normalization protocols. All computational analyses were performed in at least two independent pipelines to verify reproducibility. All bioinformatics packages, versions, and parameters used in this study are listed in the Supplementary Software and Algorithms.
Bioinformatics analysis
Publicly available transcriptome datasets were obtained from the GEO database (GSE138080, CESC cohort) and the Genome Sequence Archive (GSA; HRA002655, NECC cohort). Expression matrices were quantile-normalized using normalizeQuantiles in limma (v3.60.3). Differential expression was performed with limma (v3.60.3) using thresholds of P < 0.05 and |log2FC| > 1 and visualized with ggplot2 (v3.5.2) and ComplexHeatmap (v2.20.0). Tumor microenvironment infiltration scores were inferred using xCell (v1.1.0); samples were stratified into fibroblast-high (CAF+) and fibroblast-low (CAF−) groups by the median fibroblast score, followed by differential expression analysis (P < 0.05, |log2FC| > 1). Pearson correlations between E2F1 expression and all genes were computed in Python using pandas; positively correlated genes were intersected with CAFs-associated DEGs to define an E2F1-associated candidate set. Pathway activity was quantified by ssGSEA using GSVA (v1.52.3) with MSigDB gene sets (Hallmark E2F Targets, DNA replication, and HRR); E2F Targets ssGSEA scores were used as a proxy for E2F1 transcriptional activity, and ssGSEA scores were also computed for HRR and DNA replication gene sets (including BRCA1/2, ATM, and MCM family genes). Statistical analyses were conducted in R (v4.4.1) using two-sided Wilcoxon rank-sum tests for two-group comparisons, with ggplot2 and ggpubr (v0.6.0) for visualization; P < 0.05 was considered significant. HRD analysis on paired tumor–normal sequencing data used Sequenza (v3.0.0) to infer purity, ploidy, and CNVs; depth and allele frequencies were extracted with sequenza-utils, processed with 50-bp binning and quality filtering, and optimal solutions were selected via the Bayesian model; scarHRD (v0.1.1) was then used to compute HRD-sum scores from LOH, LST, and TAI.
Statistical analysis
Survival curves were estimated using the Kaplan‒Meier method and compared with the log-rank test. For Kaplan‒Meier plots, the numbers at risk were provided at annual time points, with the numbers censored during each interval indicated in parentheses. The hazard ratios (HR) and their 95% confidence intervals (CI) for the effect of histology (NECC vs. non-NECC) and treatment regimens on OS were calculated using univariable and multivariable Cox proportional hazards regression models. All statistical analyses were performed using R software (version 4.2.1) with the “survival” and “survminer” packages. All experiments were independently repeated at least three times unless otherwise stated. Data are presented as the mean ± standard deviation (SD). Statistical comparisons between two groups were performed using two-tailed Student’s t-test. Multiple group comparisons were analyzed using one-way ANOVA followed by Tukey’s post hoc test. All statistical analyses were performed using GraphPad Prism version 9.0 and R version 4.2.1. A two-sided P value of <0.05 was considered statistically significant.
