


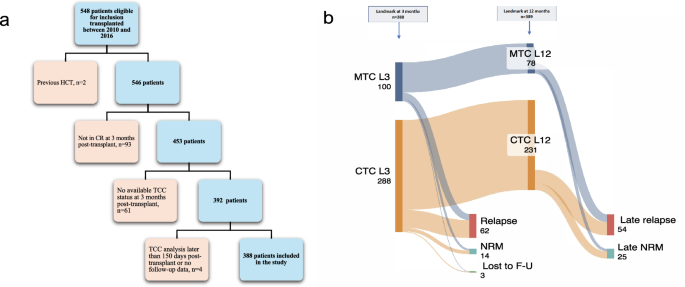
A total of 388 patients were included in the study. Of these, 309 were alive and in CR at 12 months post-HCT and comprised the primary landmark cohort. Among patients who were excluded between L3 and L12, the distribution of MTC and CTC did not differ from the overall cohort (p = 0.70). Among the 62 patients who relapsed between L3 and L12, 16 (26%) had MTC and 46 (74%) CTC, mirroring the distribution in the overall L3 cohort, in which 100 of 388 patients (26) had MTC and 288 (74%) had CTC. See Fig. 1a,b.
The median age at HCT was 56 (range: 15—71) years. Patients in the CTC group were younger than those in the 3-month MTC group (median 54 versus 59 years, p = 0.036), although the difference was not significant among patients in CR at 12 months. No significant differences were observed in pre- or post-HCT MRD status between groups. Testing of MRD at three months was less frequent in patients with MTC (44% vs 33%, p = 0.041), but this difference was not observed among patients in CR at 12.
T-cell depletion and MAC was more common in the CTC group (77% vs 62%, p = 0.033 and 49% vs 35%, p = 0.0015), whereas MTC was more common in patients receiving RIC (33% vs 19%). HLA-mismatched donors were more common in the CTC group (p = 0.0014). T-cell chimerism was assessed in PB (43%), BM (7%), or both (50%), with some discordance observed between compartments (see Supplementary Results).
The median follow-up time was 60 months (95% CI, 52–70). See Tables 1 and 2 for patient characteristics and results.
Table 1 Background characteristics (n = 388).Table 2 Results (n = 388).
Relapse
Overall, 32% of the patients relapsed, of which half occurred beyond 12 months post-HCT.
T-cell chimerism status and late relapse
Among all patients, relapse occurred in 38% in the three-month MTC group and 31% in the CTC group (p = 0.17). Among the 309 patients that were alive and in CR at 12 months, 26% in the MTC group compared with 15% in the CTC group (p = 0.028; Table 2).
The 60-month CIR from L12 was 29% (95% CI, 19–41) in the MTC group and 17% (95% CI, 12–23) in the CTC group (p = 0.024), whereas no significant difference was observed from L3 (39% [95% CI, 29–50] versus 28% [95% CI, 23–34], p = 0.11; Fig. 2A,B).
Fig. 2
Cumulative incidence of relapse by T-cell chimerism status. Shown from (a) 12-month and (b) 3-month landmarks. Death was treated as a competing event.
Pre-transplant MRD-status and early relapse
Pre-transplant MRD-positivity was associated with increased CIR from L3 (41% [95% CI, 29–57] versus 25% [95% CI, 19–34], p = 0.029), whereas the association from L12 was weaker and not statistically significant (25% [95% CI, 13–44] versus 13% [95% CI, 8–22], p = 0.058); Fig. 3A,B).
Fig. 3
Cumulative incidence of relapse by pre-HCT MRD status. Shown from (a) 12-month and (b) 3-month landmarks. Death was treated as a competing event.
In univariable competing-risk regression, T-cell chimerism was the only variable significantly associated with CIR after L12, with lower relapse risk observed in the CTC group (subhazard ratio [SHR], 0.54, 95% CI, 0.31–0.93, p = 0.028). Pre-transplant MRD-positivity (SHR 2.28, p = 0.067), high risk disease at HCT (SHR 1.64, p = 0.13) and absence of cGvHD (SHR 1.57, p = 0.095) showed a numerically increased, but non-significant, relapse risk after L12. No associations were observed for conditioning intensity, T-cell depletion, donor match, stem cell source, CMV status or patient age at HCT.
In multivariable analyses adjusting for pre-HCT MRD status, disease risk at HCT, cGvHD, conditioning intensity and T-cell depletion, the association between T-cell chimerism and CIR remained. No significant interactions were observed between T-cell chimerism and pre-HCT MRD (p = 0.44) or other variables.
RFS, NRM and overall survival
The 60-months RFS from L12 was lower in patients classified as having MTC at three months compared with CTC (62% [95% CI, 49 –73] versus 74% [95% CI, 67 –80], p = 0.017). Similarly, pre-HCT MRD-positive compared with MRD-negative patients had inferior RFS (68% [95% CI, 49–82] versus 82% [95% CI, 72–88], p = 0.049; Fig. 4A,B).
Fig. 4
Relapse-free survival from the 12-month landmark. Stratified by (a) T-cell chimerism status and (b) MRD status.
In univariable analysis, T-cell chimerism was the only variable significantly associated with RFS after L12; CTC versus MTC group (hazard ratio [HR], 0.57, 95% CI, 0.36–0.91, p = 0.019). Pre-transplant MRD-positivity (HR 2.13, p = 0.055) and disease risk at HCT (HR 1.57, p = 0.083) showed non-significant trends towards inferior RFS. No significant associations were observed for other clinical variables included in the CIR analysis, and no significant interactions were identified.
No differences in NRM were seen between the MTC and the CTC group at 60 months from either L12 or L3 (Figure S2A,B).
Among patients in CR at 12 months, OS was lower in the MTC group compared with the CTC group (71% [95% CI, 60–80] versus 79% [95% CI, 72–84], p = 0.051). Pre-transplant MRD-positive patients had inferior OS compared with MRD-negative patients (74% [95% CI, 55–86] vs 87% [95% CI, 78–93], p = 0.033; Fig. 5A,B).
Fig. 5
Overall survival by T-cell chimerism status. Shown from (a) 12-month and (b) 3-month landmarks.
In the overall survival analysis, a significant interaction was observed between T-cell chimerism and pre-HCT MRD status. Pre-transplant MRD-positivity was associated with an increased risk of death among patients with MTC (HR 8.40, 95% CI 1.99–35.55), whereas no clear effect was observed among patients with CTC (HR 1.31, 95% CI 0.27–6.52).
Subanalyses were made of patients in MRD-negative CR at three months post-HCT, to exclude that the T-cell chimerism status analyzed simultaneously, was affected by residual disease. The difference in CIR between MTC and CTC groups remained (Fig. 6) among MRD-negative patients.
Fig. 6
Cumulative incidence of relapse in MRD-negative patients at 3 months post-HCT, stratified by by T-cell chimerism status.
Time to relapse and from relapse to death
Patients with pre-HCT MRD-positivity showed numerically shorter time to relapse, and from relapse to death, compared with patients with three-month MTC, although differences were not statistically significant (Figure S3).
Donor lymphocyte infusions
Donor lymphocyte infusions (DLI) were more frequent among patients with MTC compared with CTC (29% vs 10%; p < 0.001).
Infections
Treatment of CMV reactivation was more common in the CTC group (48% vs 30%, p = 0.0015). No differences were observed in EBV or fungal infections.
Acute and chronic GvHD
No significant differences were observed between the groups regarding the rate or severity of aGvHD; grade II–IV (25% vs 31%; p = 0.26) and grade III–IV (6% vs 6%; p = 0.97). No significant differences in rates or severity of cGvHD was seen between the MTC and CTC groups.
