


Cultured cell lines
The cell lines OVCAR8, OVCAR8-ULK1KO, HEYA8, and HEYA8-ULK1KO were grown in RPMI-1640 medium (Wisent), whereas ES2, ES2-ULK1KO, FT190, and FT190-ULK1KO were grown in DMEM/F12 medium (Life Technologies). All growth media were supplemented with 10% fetal bovine serum. OVCAR8, HEYA8, and ES2 cells were procured from the American Type Culture Collection. Adherent cells were sustained on tissue culture-treated polystyrene (Sarstedt, Newton, NC, USA) and spheroids were maintained in Ultra-Low Attachment (ULA) cluster plates (Corning, NY, USA). The immortalized human fallopian tube secretory epithelial cell line FT190 [26] was generously provided by R. Drapkin from the University of Pennsylvania, Philadelphia, PA, USA. The human lung mesothelial ZT-GFP cell line [7] was generously provided by Marcin Iwanicki from the Stevens Institute of Technology All cell lines were authenticated through short tandem repeat analysis by the Center for Applied Genomics (The Hospital for Sick Children, Toronto, ON, Canada) and routinely examined them for mycoplasma using a Universal Mycoplasma Detection Kit (30–1012 K; ATCC).
Generation of ULK1KO cell lines
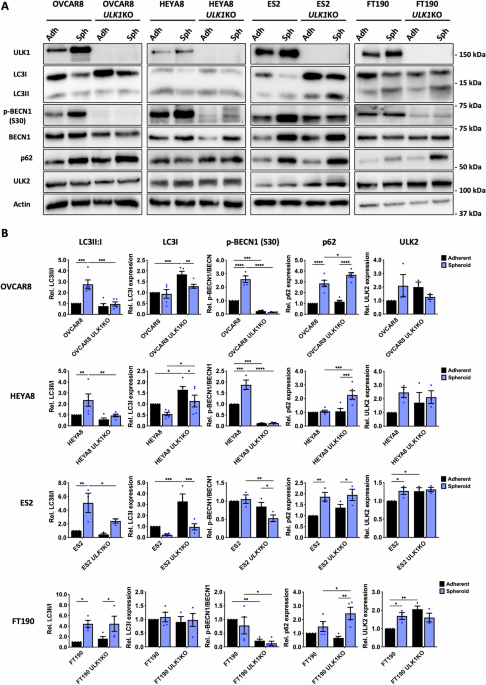
CRISPR/Cas9 (sc-400516-KO-2 Lot# C3016, Santa Cruz Biotechnology) was used to ablate ULK1 in OVCAR8, HEYA8, ES2, and FT190 cells. Briefly, cells were seeded at 1–1.5 × 10⁵ per well in a 6-well plate and transfected the following day. Cells were trypsinized four days post-transfection and sorted using fluorescence-activated cell sorting (FACS) in 96-well plates. The clones were left to grow for a minimum of two weeks, after which colony formation was observed. Colonies were harvested and plated into 6-well plates and then 10 cm plates upon reaching confluency. Cells were harvested for protein lysates, screened for ULK1 loss via western blotting and passaged for continued culture and subsequent clone pooling.
Generation of Nuclight GFP and RFP cell lines
Cells were transduced with Incucyte® Nuclight Green Lentivirus (EF1a, Puro) (Sartorius, #4624) or Incucyte® Nuclight Red Lentivirus (EF1a, Puro) (Sartorius, #4476) following the manufacturer’s instructions. After transduction, cells were cultured in complete media supplemented with puromycin (1 μg/mL; BioShop, #5E38885) to select successfully transduced cells. The isolated GFP+ and RFP+ cells were expanded and used for further analysis and experimentation.
Generation of mCherry-eGFP-LC3 cell lines
Parental and ULK1KO cells were transfected with mCherry-eGFP-LC3B autophagy reporter plasmid [pBABE-puro mCherry-EGFP-LC3B was a gift from Jayanta Debnath (Addgene plasmid # 22418; http://n2t.net/addgene:22418;RRID:Addgene_22418] [27]. After transfection, cells were grown in complete media containing G-418 (400 μg/mL, Wisent, #450-130-QL) for two weeks to select those with successful reporter plasmid integration. Following the selection phase, the cells were cultured in complete medium without G-418 for another four weeks, allowing for growth and recovery. Cells were sorted using FACS to identify double-positive cells (GFP+, mCherry+).
Generation of luc2tdTomato cell lines
Cells were transduced with pCDH-EF1-Luc2-P2A-tdTomato, according to the manufacturer’s instructions [pCDH-EF1-Luc2-P2A-tdTomato was a gift from Kazuhiro Oka (Addgene plasmid # 72486; http://n2t.net/addgene:72486;RRID:Addgene_72486)]. After transduction, the cells were subjected to FACS to isolate the tdTomato+ cells. The cells were cultured in a complete medium for growth and recovery. The cells were then subjected to another round of FACS to gate and select for populations of cells with similar tdTomato expression intensities. Cell populations were seeded in a serial dilution for bioluminescent imaging (BLI) analysis using D-luciferin and the IVIS Lumina S5 system (PerkinElmer) to determine optimal populations (i.e., similar reporter gene expression among lines) to use for subsequent in vivo xenograft assays.
Antibodies and reagents
Antibodies against ULK1 (#8054S), p62 (#5114S), LC3B (#2775S), Beclin1 S30 (#5410S), Beclin1 (#3738S), p21 (#2947), p27 (3686), AKT S473 (#9271), AKT (#9272S), MEK1/2 S217/221 (#9154S), MEK (#8727), ERK1/2 Thr202/Tyr204 (#9101), ERK1/2 (#9102), cleaved-PARP (#9541S), P70S6K Thr389 (#9234S), P70S6K (#2708S), p38 MAPK Thr180/Y182 (#4511S), 4EBP1 T37/46 (#2855S), 4EBP1 (#9452S) were purchased from Cell Signaling Technology. Anti-ULK2 antibody (AB97695), ATG16L1 (AB187671), ATG16L1 S30 (AB19016), and mCherry (AB167453; 1:500) were purchased from Abcam. Anti-actin antibody (A2066; 1:25000) was purchased from Millipore. Antibodies against tubulin (T5168; 1:40000) and vinculin (V9264; 1:25000) were purchased from Sigma-Aldrich. Horseradish peroxidase (HRP)-conjugated antibodies against mouse IgG (NA931; 1:10000) and rabbit IgG (NA934; 1:10000) were purchased from GE Healthcare. Antibodies were diluted in tris-buffered saline-Tween 20 containing either 5% bovine serum albumin or non-fat milk 1:1000 or as stated otherwise. Adenovirus expressing green fluorescent protein (Ad-GFP) was a kind gift from Dr. B. C. Vanderhyden (Ottawa Health Research Institute) and prepared as described previously [11]. Rat-tail collagen was purchased from Gibco (#963791) and Matrigel was purchased from Corning (CLS356231). Paclitaxel was purchased from Cayman Chemical Company (#10461) and stored at −20 °C as 5 mM in DMSO stocks. Carboplatin was received from the London Regional Cancer Program and stored at 4 °C as 27 mM in saline stocks. Olaparib, (#HY-10162), ralimetinib (#HK-13241), and DCC-3116 (#HY-160699) were purchased from MedChemExpress, trametinib (#7709) was purchased from Tocris Bioscience, and AKT inhibitor VIII (Akti-1/2) was purchased from EMD/Calbiochem (#12408).
Immunoblot analysis
The Bio-Rad Mini-PROTEAN II Electrophoresis System was used for immunoblotting following the manufacturer’s guidelines, utilizing in-house prepared gels (30% acrylamide/bis solution 37.5:1, catalog number 1610158; Bio-Rad). Densitometric analysis was conducted using Image Lab 6.05 software suite (Bio-Rad).
Preparation of whole-cell lysates
For assessment of all proteins, 4-, 8-, 24-, 48, and 72-hour whole-cell lysates were generated from adherent cells cultured at a density of 0.75–1× 10⁶ cells in 10 mL medium (10 cm dish), or spheroid cells cultured at a density of 1–3× 10⁶ cells in 15 mL medium (35 mm ULA well). Cell seeding numbers were chosen to obtain acceptable protein yields for each cell line.
Whole-cell lysates
Adherent cells cultivated on tissue culture-treated plates or dishes were collected by removing the medium, washing twice with cold PBS, and scraping into a modified radioimmunoprecipitation (RIPA) buffer (50 mM HEPES (pH 7.4), 150 mM NaCl, 10% glycerol, 1.5 mM MgCl2, 1 mM EGTA, 1% Triton X-100, 0.1% SDS, 1 mM Na3VO4, 10 mM NaF, 1 mM PMSF, 1 × SIGMAFAST protease inhibitor cocktail (cat. S8820; Sigma), 10 mM beta-glycerophosphate). Spheroids (minimum of 1.5× 10⁶ cells per sample) were collected by transferring the cell suspension into an ice-cold conical tube, followed by centrifugation using a swinging bucket rotor (800 × g at 4 °C for 4 min) to form a pellet. The medium was aspirated, and the pellet was resuspended in cold PBS (at least 10 mL of cold PBS. This process was repeated by resuspending the pellet in cold PBS, followed by centrifugation and aspiration of the PBS. The resulting cell pellets were lysed using modified RIPA buffer, vortexed, exposed to one freeze-thaw cycle, and clarified by centrifugation (maximum × g at 4 °C for 20 min).
Spheroid viability assays
Bulk spheroids
Cells were placed in 24-well ultra-low attachment (ULA) cluster plates at a density of 0.5–1× 10⁵ cells per well in 1 mL of medium. The spheroids were then collected into chilled microcentrifuge tubes and centrifuged at 500 × g for 3 min to form pellets. After aspirating the medium, the pellets were washed once with 500 μL of PBS, centrifuged once more, and resuspended in 50–250 μL of trypsin/EDTA. The suspension was incubated at 37 °C with gentle agitation every 10 min until no aggregates were visible (10–30 min). Trypsin was inactivated by adding an equal volume of FBS, followed by the addition of Trypan Blue dye (Gibco™ 15250061) at 1:1 ratio and gentle mixing via pipetting. Cell counting was performed using the TC20 Automated Cell Counter (Bio-Rad Laboratories).
Individual spheroids
Cells were seeded in a 96-well round-bottom ULA plate at a density of 2000 cells per well in 100 μL of medium. For alamarBlue assays, cells were incubated at a final dilution of 1:10 (alamarBlue to media) for 4, 24, or 48 h and fluorescence was measured using an Agilent Biotek Synergy H1 plate reader. For Caspase-Glo 3/7 (Promega, G8092) assays, 100 μL of reagent was added to each well, and the plate was frozen at −80 °C. After 24 h, the plates were thawed at room temperature in the dark for 60 min on a plate rocker. The contents of wells were transferred to individual wells of a 96-well opaque white plate, and luminescence was measured on the Agilent Biotek Synergy H1 plate reader.
Cell proliferation
Cells expressing Nuclight GFP were placed in 96-well standard-well ultra-low attachment (ULA) cluster plates at a density of 0.5–1× 10⁵ cells per well in 200 µL of medium. Fluorescent images were captured at 4 h intervals in the Incucyte® S3 System (Sartorius). Growth curves and doubling times were calculated using GraphPad Prism 10. Adherent and spheroid doubling time calculations were performed using green and green mean intensity features of the Incucyte® S3 system, respectively.
Organoid culture
Cell line organoid culture
Cells were seeded at a density of 5000 cells/well as droplets in 50 µL of Cultrex Basement Membrane Extract (BME) PathClear Type 2 (Cedarlane, Burlington, ON, Canada) on a 24-well standard tissue culture plate (Corning). Droplets were overlaid with an EOC organoid specific media containing Advanced DMEM/F-12 (Invitrogen) supplemented with B-27™ (Invitrogen), Forskolin (Sigma), GlutaMAX™ (Invitrogen), HEPES (Wisent), Human EGF (Peprotech Inc.), Human FGF-10 (Peprotech Inc.), Nicotinamide (Sigma), N-Acetyl-L-cysteine (Sigma), Recombinant Human Noggin (R&D Systems) and ROCK-inhibitor (Y27632 dihydrochloride, Sigma). Brightfield images were captured every 12 h with the Incucyte® S3 System. The total organoid area (µm²) and number of organoids per well were quantified using the Organoid Analysis Software via the Incucyte® S3 System.
Patient-derived organoid culture
Patient consent for the clinical specimens from which PDO cultures were derived was obtained according to our institution’s research ethics board-approved protocol (#115904). Cells were seeded at a density of 25,000 cells/well as droplets in 50 µL of Matrigel (Corning) on a 96-well standard tissue culture plate (Corning). Droplets were overlaid with an patient-derived organoid specific media containing Advanced DMEM/F-12 (Invitrogen) supplemented with Antibiotic-Antimycotic (WISENT), B-27™ Supplement (Invitrogen), GlutaMAX™ Supplement (Invitrogen), Recombinant Human FGF basic/FGF2/bFGF Protein (Novus Biologicals), Human FGF-10 (Peprotech Inc.), ROCK-inhibitor (Y27632 dihydrochloride, Sigma), Human EGF (Peprotech Inc.), Forskolin (Sigma), N-Acetyl-L-cysteine (Sigma), Recombinant Human Noggin (R&D Systems), Nicotinamide (Sigma), β-Estradiol (Sigma), HEPES (WISENT), N-2 Supplement (Invitrogen), SB431542 hydrate (Sigma), and Human Recombinant BMP-2 (Sigma).
Scratch wound closure migration assay
Confluent cell monolayers were scratched with a pipette tip and immediately imaged (0 h time point). Images were acquired up to 36 h post-scratch and ImageJ [28] was used to measure scratch width and calculate scratch area.
Mesothelial clearance assay
ZT-GFP mesothelial cell line with red fluorescence-positive spheroids
Human ZT-GFP mesothelial cells (1–1.5× 10⁵ cells in 1 mL) were seeded into each well of a 24-well tissue culture plate and incubated for 24 h. An empty well containing 1 mL of media served as a control. Cells expressing luc2tdTomato (OVCAR8 and HEYA8) or Nuclight RFP (ES2) (2000 cells per well) were seeded into 96-well ULA plates and incubated for 24 h then individual spheroids were transferred using a P200 and placed onto mesothelial cell monolayers or control wells, with at least 6 spheroids per well. Green and red fluorescent images were captured 24 h later using a Leica DMI4000B inverted microscope and spheroid displacement was quantified using Fiji (Fiji is just ImageJ).
Primary human mesothelial cells with mouse ascites-derived spheroids
Prior to cell culture, collagen (50 μg) was dissolved in 70% ethanol and added to each well of a 24-well tissue culture plate and incubated at room temperature for 2 h. The wells were then aspirated, washed with PBS, and re-aspirated before adding mesothelial cells. To generate fluorescing primary mesothelial cells, 3.5 μL of recombinant human Ad5-green fluorescent protein (Ad-GFP) vector stock per 100,000 cells was added to the cell suspension, which was then seeded to the collagen layer at a density of 1–1.5× 10⁵ cells and incubated for 24 h. Mouse xenograft ascites-derived spheroids were generated by seeding cells into 96-well ULA plates at 2000 cells per well in 100 μL and incubated for 24 h. The following day, mesothelial cells were washed twice with PBS to remove Ad-GFP-containing media, and 1 mL of fresh media was added to each well, including control wells without mesothelial cells. Spheroids were transferred to a 24-well plate at 6 per well using a P200. Green and red fluorescent images were captured 24 h later and spheroid displacement was quantified as described above.
Xenotransplantation assays
Eight NOD/SCID female mice (8–10 weeks old; Charles River Laboratories) were injected intraperitoneally with luc2tdTomato cells with the following cell numbers in 150 μL PBS: OVCAR8/OVCAR8-ULK1KO, 2× 10⁶; HEYA8/HEA8A8-ULK1KO, 1× 10⁶). Mice were randomly assigned to receive either parental or ULK1KO cells. For survival analyses, mice were monitored daily after intraperitoneal injection and euthanized using established criteria for humane endpoints (lethargy, hunched posture, impaired breathing, weight loss, and excessive ascites) as per protocol guidelines. Animals that died prematurely without evidence of tumor burden (i.e., in the absence of jaundice, lethargy, abdominal distension, or a palpable mass) were excluded from the survival analysis. Mice received weekly injections of D-luciferin (Perkin Elmer, #122799) at 75 mg/kg in 100 µL PBS to monitor tumor progression via BLI using the IVIS Lumina S5 system (PerkinElmer). Tumor locations and evidence of ascites for each mouse was assessed and recorded at necropsy. The mice were provided chow (Envigo, #2919) and water ad libitum throughout the study. All animal experiments were approved by the Institutional Animal Care and Use Committee of the University of Western Ontario (London, Ontario, Canada) and were performed in accordance with approved guidelines.
Immunohistochemistry
Sectioning and staining of tumor specimens were performed by the Molecular Pathology Core Facility at Robarts Research Institute (London, Ontario, Canada). Images of stained tumor sections were captured using an Aperio ScanScope slide scanner (Leica). IHC analysis was performed using the Fiji distribution in ImageJ software [29]. Ki67-positive nuclei were masked using the Trainable Weka Segmentation plugin [30], and masked regions were counted using a minimum particle area of 120 pixels. Cleaved caspase-3 staining in xenograft tumor sections was evaluated using the “IHC Profiler” plugin for ImageJ, as described previously [31]. Positive caspase-3 staining represents the combined “high-positive” and “positive” scores as defined by IHC profiler.
Carboplatin and paclitaxel dose-response curves
To determine carboplatin and paclitaxel half-maximal inhibitory concentration (IC50) values, 2000 cells in 100 µL media were seeded in a standard 96-well plate for adherent culture, allowed to attach for 24 h, then treated with carboplatin or paclitaxel over a 12-point concentration gradient. After 72 h of treatment, cell viability was determined using the alamarBlue Cell Viability Reagent (Invitrogen CAT# DAL 1025) according to the manufacturer’s instructions. To determine carboplatin and paclitaxel IC50 values of spheroids, 2000 cells in 100 µL media were seeded in a 96-well ULA plate. After 72 h, cells were treated individually over a 12-point concentration gradient for an additional 72 h. Following treatment, viability was determined by alamarBlue viability assay. Viability was assessed at 4 h and 48 h post alamarBlue incubation for carboplatin and paclitaxel, respectively, and IC50 values were calculated using GraphPad Prism 10.
Proteomic mass spectrometry
Protein extraction and mass spectrometer analysis were performed on OVCAR8 wild-type and OVCAR8-ULK1KO 24-hour spheroids. Spheroids were lysed using three 5-s pulse rounds of sonication at 35% amplitude lysed OVCAR8 wild-type and OVCAR8-ULK1KO spheroids at 24 h post seeding in lysis buffer containing 200 mM 4-(2-hydroxyethyl)-1-piperazinepropanesulphonic acid (EPPS; pH 8.6), 6 M guanidine, 1 mM PMSF, 100 mM NaF, and phosphatase inhibitor cocktail (2 mM NaF, 2 mM imidazole, 1.15 mM Na2MoO4, 1 mM Na4P2O7, 4 mM Na2C4H4O6, 2 mM Na3VO4, and 1 mM β-glycerophosphate). Lysates were incubated in the dark with 5 mM Tris (2-carboxyethyl) phosphine and 15 mM indole-3-acetic acid for 30 and 45 min, respectively, and quenched with 5 mM dithiothreitol. Sera-MagTM SpeedBeads (GE Healthcare, Little Chalfont, UK; 65152105050250) were added to the lysates, followed by equal volumes of 100% ethanol. The resulting mixture was incubated on a shaker for 10 min. The supernatant was removed from the mixture, and the beads were washed and resuspended in 50 mM EPPS buffer (pH 8.5). After beads and EPPS buffer were subjected to a 2-h LysC digestion at 1 mAu per 100 μg of protein, trypsin was added at a 1:50 ratio for overnight digestion. The beads were washed with water and 30% acetonitrile the following day to elute the peptides, which were stored at −80 °C.
For mass spectrometry, the peptides were analyzed using a Q Exactive Plus mass spectrometer coupled with an EASYLCn-1000 system (Thermo Fisher Scientific). The peptides were loaded onto an Easy-LCn-1000 and separated on an EASY-Spray 75 μm × 500 mm at 45 °C using an ES803A analytical column (Thermo Fisher Scientific) at a flow rate of 300 nl/min. Raw mass spectrometry data were processed using FragPipe (version 20.0) and Rstudio with the Tidyverse R package for data manipulation, mice R package for imputing missing data, and LIMMA R package for differential expression analysis. Pathway analysis was performed using Kegg [32] (http://bioinformatics.sdstate.edu/go/) and Reactome databases [33] (https://reactome.org).
Spheroid drug treatments and reattachment
Cells were placed in 24-well ULA cluster plates at a density of 5× 10⁴ cells per well in 1 mL of medium. After 24 h, spheroids were treated with individually with carboplatin (100 µM), paclitaxel (50 nM), olaparib (20 µM), AKTi 1/2 (5 µM), trametinib (10 nM), or ralimetinib (15 µM). Spheroid cell viability was performed using Trypan Blue Exclusion assay as described above at 96 h for all drug treatments, except for Olaparib, which was performed at 192 h. For spheroid reattachment assays, inhibitor-treated spheroids were reattached to standard tissue culture plates for 48 h and viability was assessed using alamarBlue at 1:10 dilution in media. Fluorescence was measured using the Agilent Biotek Synergy H1 plate reader.
Statistical analysis
Statistical analyses were performed using GraphPad Prism 10 (GraphPad Software) and the details for specific statistical tests are described in each figure legend.
