


Plasmids, recombinant proteins, antibodies, siRNA and reagents
pEFh_SBP-SMG1 (residues 2–3661 of human SMG1, codon-optimized), pEFh_SMG8 (residues 1-991 of human SMG8, codon-optimized), pEFh_SMG9 (residues 1–520 of human SMG9, codon-optimized), pEFh_SBP-mTOR (residues 2-2549 of rat mTOR), pEFh_HA-mLST8 (residues 2–326 of human mLST8, codon-optimized), pEFh_SBP-ATM (residues 2-3056 of human ATM), pEFh_HA-ATMIN (residues 2–823 of human ATMIN), pEFh_SBP-ATR (residues 2–2644 of human ATR), pEFh_HA-ATRIP (residues 2–791 of human ATRIP), pEFs_SBP-Flag-NRF2 (residues 1–605 of human NRF2), pcDNA5_NRF2-HA_FRThyg (residues 1–605 of human NRF2), pGEX6p1_GST-NRF2 (residues 1–56 of human NRF2), pEFs_SBP-KEAP1 (residues 2–624 of human KEAP1), and pEFs_His-SBP-KEAP1-DC (residues 321–609 of human KEAP1) were constructed by cloning the corresponding cDNA fragments using standard molecular biology techniques. S13A, S40A, or S13A/S40A mutants of pcDNA5_NRF2-HA_FRThyg and S13E, S40E, or S13E/S40E mutants of pGEX6p1_GST-NRF2 (1–56) were generated using a standard site-directed mutagenesis protocol. GST-NRF2 14-mer peptide fusion proteins, designated as S13, S40, S103, and S410, were generated by inserting the corresponding oligonucleotides into the pGEX6p1 vector. pSR_Flag-SMG1, pSR_Flag-SMG1-DA, and pGEX6p1_GST-UPF1-S1096 plasmids were constructed as previously described.57 Detailed vector sequences are available upon request.
Recombinant proteins, including the SBP-SMG1:SMG9 complex, SBP-SMG1:SMG8:SMG9 complex, SBP-mTOR:HA-mLST8 complex, SBP-ATM:HA-ATMIN complex, SBP-ATR:HA-ATRIP complex, SBP-NRF2, SBP-KEAP1, and His-SBP-KEAP1-DC, were purified as previously described.58 Briefly, 3 × 10⁷ to 6 × 10⁸ HEK293T cells were co-transfected with the indicated plasmids using polyethylenimine (Polysciences). Two to three days after transfection, cells were lysed using a loose-fit Potter–Elvehjem homogenizer in NF buffer [20 mM Tris-HCl (pH 7.5), 150 mM NaCl, 0.25 M sucrose, 0.5% NP-40, 1% Tween 20, 1 mM dithiothreitol (DTT), protease inhibitor cocktail (Nacalai Tesque), EDTA-free phosphatase inhibitor cocktail (Nacalai Tesque)] supplemented with 50 μg/mL RNase A. SBP-tagged proteins were captured using streptavidin Mag Sepharose (GE Healthcare) by incubation at 4°C for 2 h with gentle rotation, followed by washing with NF buffer. Protein complexes were eluted at 4°C for 30 min using T buffer [20 mM HEPES-KOH (pH 7.5), 150 mM NaCl, 2.5 mM MgCl₂, 0.05% Tween 20] containing 2 mM DTT, EDTA-free protease inhibitor cocktail, phosphatase inhibitor cocktail, and 2 mM desthiobiotin (Sigma). For PIKKs, eluted proteins were dialyzed against PIKK kinase buffer [10 mM HEPES-NaOH (pH 7.5), 50 mM NaCl, 2.5 mM MgCl₂]. Purified DNA-PK was purchased from Promega (V5811).
GST fusion proteins, including GST-NRF2 (1–56), its mutants, GST-NRF2 (57–98), and GST-14-mer peptide fusion proteins, were purified using standard glutathione affinity chromatography with glutathione Sepharose 4B (GE Healthcare).
Antibodies against UPF1, phospho-S1078/S1096-UPF1 (clone 8E6), and phospho-T28-UPF1 were used as previously described.59,60 Clone 8E6 was used for AlphaScreen assays. Commercial antibodies used in this study included anti-phospho-T37/46-4EBP1 (236B4; CST, #2855), HO-1 (CST, #5853), eEF2 (CST, #2332), NRF2 (GeneTex, GTX103322; Proteintech, 80593-1-RR), phospho-S40-NRF2 (Abcam, #ab76026), KEAP1 (Millipore, MABS514), phospho-MLKL (Ser358; D6H3V; CST, #91689), caspase 3 (D3R6Y; CST, #14220), cleaved caspase 3 (5A1E; CST, #9664), GPx4 (Proteintech, 67763-01-Ig), CD71 (TfR1; Proteintech, 10084-2-AP), Flag (Sigma, F1804), and HA (Roche, 11867423001). An anti-phospho-S13-NRF2 antiserum was generated as described previously35 using a KLH-conjugated phospho-peptide [C-PPGLP(pS)QQDMD]. This antibody does not detect S13 phosphorylation for endogenous NRF2 due to antibody sensitivity.
The following siRNAs were used: SMG1 siRNA, GTGTATGTGCGCCAAAGTA; DNA-PK siRNA, Hs_PRKDC_8_HP Validated siRNA; and non-silencing control siRNA, AllStars Negative Control siRNA (QIAGEN). PIKK inhibitors were obtained from commercial sources: AZD8055 (mTORi; Sigma, ADV465749178), KU-55933 (ATMi; Sigma, SML1109), VE-821 (ATRi; Sigma, SML1415), NU7441 (DNA-PKi; Sigma, N1537), and AZD7648 (DNA-PKi; TargetMol, T7122). NPD15008 and compound 11j were synthesized by TLC Pharmaceutical Standards.
Hybridoma production
Two 6-week-old female BALB/cAJcl mice were purchased from CLEA Japan. The Animal Care and Use Committee of Tohoku University (Permit number: 2022MdA-001) approved animal experiments. To develop mAbs against phospho-T3550-SMG1 [NTGQK(pT)QPDV], we intraperitoneally immunized two mice with 100 µg of the KLH-conjugated phospho-T3550-SMG1 peptides [C-NTGQK(pT)QPDV; Hokkaido System Science] plus Alhydrogel adjuvant 2% (InvivoGen). The procedure included three additional weekly immunizations (100 µg/mouse), which was followed by a final booster intraperitoneal injection (100 µg/mouse), two days before the harvest of spleen cells. Harvested spleen cells were subsequently fused with P3X63Ag8.U1 [P3U1; American Type Culture Collection (ATCC)] cells, using PEG1500 (Roche Diagnostics), after which hybridomas were grown in an RPMI-1640 medium (Nacalai Tesque) with 10% FBS (Thermo Fisher Scientific), 100 units/mL of penicillin, 100 μg/mL of streptomycin, and 0.25 μg/mL of amphotericin B (Nacalai Tesque). For the hybridoma selection, hypoxanthine, aminopterin, and thymidine (HAT; Thermo Fisher Scientific) were added into the medium. Supernatants were subsequently screened using enzyme-linked immunosorbent assay (ELISA) with the phospho-T3550-SMG1 and wild-type SMG1 (NTGQKTQPDV) peptides. To produce purified mAbs, hybridomas were cultured in Hybridoma-SFM (Thermo Fisher Scientific), and the purified mAbs were separated using Ab-Capcher (ProteNova).
ELISA
The synthesized phospho-T3550-SMG1 and wild-type peptides were immobilized on Nunc Maxisorp 96 well immunoplates (Thermo Fisher Scientific) at 0.5 µg/mL concentration for 30 min at 37 °C. After washing with phosphate-buffered saline (PBS) containing 0.05% Tween 20 (PBST; Nacalai Tesque), wells were blocked with 1% bovine serum albumin (BSA)-containing PBST for 30 min at 37 °C. Plates were then incubated with supernatants of hybridomas, followed by peroxidase-conjugated anti-mouse immunoglobulins (1:2,000 diluted; Agilent Technologies). Next, enzymatic reactions were conducted, using ELISA POD Substrate TMB Kit (Nacalai Tesque), followed by measurement of the optical density at 655 nm using iMark microplate reader (Bio-Rad Laboratories).
AlphaScreen assay for SMG1 kinase assay
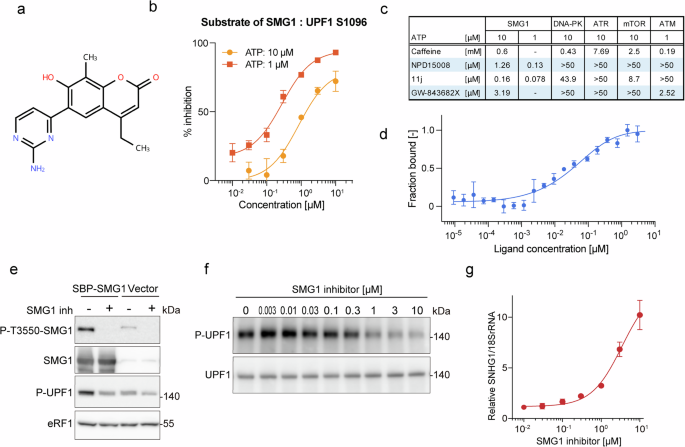
AlphaScreen assay was performed on OptiPlate-384 (PerkinElmer) plates. 0.4 nM of SMG1 kinase (the SBP-SMG1:SMG9 complex) were incubated with 1 μM of the biotinylated UPF1-peptide [Biotin-PEG8-QIDVALSQDSTYQG (underline: S1096)] and 10 μM of ATP in SMG1 kinase buffer [10 mM HEPES-KOH (pH 7.5), 50 mM NaCl, 2.5 mM MnCl2 and 0.1% bovine serum albumin (BSA) and 0.1% Tween 20] at 26 °C for 120 min with or without 0.1 μL of 1 mg/mL of compounds (OCDD core: 9,600 compounds, NPDepo: 20,000 compounds, AIST synthetic compounds: 10560 compounds, AIST natural extract library isolated natural compounds: 2,240 compounds, and clinical development molecules: 4160 compounds) in a total volume of 10 μL per well. Then, the phosphorylated SMG1-substrated-peptides were labeled by the 312.5 μg/mL of anti-phospho-S1078/S1096-UPF1 (8E6) with 5 mM EDTA, which terminates kinase reaction, diluting in AlphaScreen detection buffer [10 mM Tris-HCl (pH. 7.0), 100 mM NaCl, 0.1% Tween 20 and 0.05% BSA] at 26 °C for 60 min in a total volume of 12 μL per well. After labeling, the mixture of streptavidin donor beads and protein A-acceptor beads (final concentration: 7.5 μg/mL) (PerkinElmer) were added in a total volume of 20 μL per well and incubated at 26 C for 16 to 19 h in the dark. After the incubation, laser excitations were carried out at 680 nm, and readings were performed at 520 to 620 nm using the EnVision Multilabel Reader (PerkinElmer). To determine the half maximal inhibitory concentration (IC50), 10-9 to 10-4 M concentration of compounds were used.
In vitro kinase assay
In vitro kinase assay of PIKK using radiolabeled ATP was performed as described elsewhere previously.61 In brief, recombinant PIKKs were incubated with the substrate peptides [UPF1: QIDVALSQDSTYQGRRRRR (underline: S1096), 4EBP1: KKKKKPQDYCTTPGGTLF (underline: T37), p53: KKKKKSVEPPLSQETFSD (underline: S15)] together with 16.6 to 49.8 nM of [γ-32P]ATP and 1 to 10 μM ATP in SMG1 kinase buffer with 0 to 50 μM of compounds at 30 °C for 15 min. The kinase reaction was terminated by heat inactivation at 65 °C for 15 min. After heat inactivation, each reaction mixture was spotted onto the center of a 1-cm square of P81 phosphocellulose paper (Millipore). Immediately immerse the paper into the 75 mM phosphoric acid in the glass beaker and gently shake for 5 min. Papers were transferred into new 75 mM phosphoric acid in the glass beaker and gently shaken for 5 min (repeat this washing procedure three times). After the final wash in phosphoric acid, transfer each paper to a new 1.5 mL microcentrifuge tube and measure radioactivity in the samples by Cerenkov counting without liquid scintillation fluid using the ‘32P program’ in a liquid scintillation counter.
Luciferase-based NMD reporter assay
HeLa Tet-On Advanced cells were infected with pLenti6/FRT/eGFP-BSD lentivirus62 and single-cell clones were isolated by selection with 4 μg/mL of blasticidin S. Single integration of the Flp recombination target (FRT) site was confirmed by Southern blotting. pSV40-Luc2-21HBB_FRThyg_tk-Rluc (control reporter, NMD insensitive) or pSV40-Luc2-179HBB_FRThyg_tk-Rluc (test reporter, NMD sensitive) was integrated into the FRT site of HeLa Tet-On Advanced_FRT (clone #12) using Flp-In system (Thermo Fisher Scientific) to generate HeLa Tet-On Advanced-21H and HeLa Tet-On Advanced_-179H cells. Both reporters integrated into the same FRT site of HeLa Tet-On Advanced_FRT which ensures the same transcriptional rate of NMD-insensitive and -sensitive mRNA. For reporter assay, HeLa Tet-On Advanced cells were treated with 0.01 to 10 μM of NPD15008 for 16 h. Firefly luciferase activity which represents NMD inhibition and Renilla luciferase activity which represents cell number, were analyzed by Dual luciferase assay system (Promega). Details of reporter vector sequences are available upon request.
Assay of cellular SMG1 inhibition
For phospho-T3550 of SMG1 analysis, the anti-phospho-T3550-SMG1 mouse monoclonal antibody (clone SpMab-7) was generated using a KLH-conjugated phospho-T3550 peptide as an antigen as described above. HEK293T cells were transfected with pEFh_SBP-SMG1 or an empty vector. For phospho-S1078/S1096 of UPF1 analysis, HeLa Tet-Off cells were treated with 0.01 to 30 μM of NPD15008 for 2 h. Cells were washed with PBS and then lysed in 1× SDS lysis buffer. Samples were analyzed by western blotting using anti-phospho-S1078/S1096-UPF1 (8E6) or anti-UPF1 antibody.
For analysis of the accumulation of natural NMD target mRNAs, HeLa Tet-Off cells were treated with 0.01 to 10 μM of NPD15008 for 4 h and harvested for total RNA isolation using RNeasy plus mini kit (QIAGEN). cDNA was synthesized using SuperScript VILO cDNA Synthesis Kit (Thermo Fisher Scientific). Reverse transcription- quantitative polymerase chain reaction (RT-qPCR) was performed using iCycler iQ Real-Time PCR Detection System (Bio-Rad Laboratories) with TaqMan gene expression assays probe (Thermo Fisher Scientific) and qPCR Master-mix (NIPPON GENE). mRNA expression was quantified and normalized to 18S ribosomal RNA. Mean values ± standard error represent data from more than three independent experiments. The following probes were used: SNHG1 (Hs00411543_m1); and 18S rRNA (Hs99999901_s1).
Cell culture, transfection, viability assay, oxidative stress assay, and RT-qPCR assay
PC-3, a human prostate cancer cell line, was cultured in Ham’s F12 medium (Sigma-Aldrich) containing 10% (v/v) fetal bovine serum (FBS) and 1% (v/v) penicillin-streptomycin under a humidified atmosphere of 5% (v/v) CO2 at 37°C. HeLa Tet-Off and Hela Tet-On Advanced cell lines (Clontech), TIG-7, a normal human fibroblast cell line, HEK293T, a human embryonic kidney cell line expressing a mutant version of the SV40 large T antigen, were cultured in Dulbecco’s modified Eagle’s medium (DMEM) (Fujifilm Wako Pure Chemical) supplemented with 10% (v/v) FBS and 1% (v/v) penicillin-streptomycin under the same conditions.
Plasmid transfections were performed in six-well plates using polyethyleneimine (PEI; for HEK293T cells) or Lipofectamine 3000 (for PC-3 cells, Thermo Fisher Scientific) according to the manufacturer’s instructions. Cells were harvested or subjected to downstream analyses 42–48 h after transfection. siRNA transfections were performed in six-well plates using Lipofectamine RNAiMAX (Thermo Fisher Scientific) according to the manufacturer’s protocol. Cells were stimulated, harvested, or analyzed 42–48 h after siRNA transfection.
For the cell viability assay, cells were seeded at a density of 5 × 10³ cells per well in a 96-well half-well plate (Corning). After 24 h, the medium was replaced with fresh medium. The next day, the medium was replaced with a fresh medium containing either 0.2% (v/v) DMSO or 200 µM diethyl maleate (DEM) (Fujifilm Wako Pure Chemical, 041-21252) with or without 9 or 6 µM NPD15008 and/or 4 µM NU7441. After another 21 or 45 h, cells were incubated with alamarBlue reagent (Thermo Fisher Scientific) for 3 h. Fluorescence (excitation/emission: 555/590 nm) was measured by SpectraMax Paradigm plate reader with TUNE cartridge (Molecular Devices). As an alternative to alamarBlue assay, the number of viable cells was counted by analyzing the particle analysis of cell suspensions with ImageJ2 (Fiji) software.63
For oxidative stress treatment, cells were seeded at a density of 2.5 × 10⁵ cells per well in a 6-well plate and cultured for 2 days before assay. After 24 h of incubation, culture medium was changed. Cells were stimulated with DMSO or several oxidants, such as DEM, L-Buthionine-sulfoximine (BSO) (Sigma, B2515), 2-AAPA (Sigma, A4111), and rotenone (AdipoGen, AG-CN2-0516). At each time point, cells were washed in PBS and lysed with lysis buffer [2% LDS, 5 mM Tris-HCl (pH 6.8)] containing protease inhibitor cocktail and EDTA-free phosphatase inhibitor cocktail (Sigma-Aldrich), followed by homogenization using QIAshredder Mini Spin Column (QIAGEN).
For inhibition of PIKKs under oxidative stress, each PIKK inhibitor was added to a cell culture medium containing 200 µM DEM. The following compounds were used as PIKKs inhibitors: NPD15008 (SMG1i), KU-55933 (ATMi), VE-821 (ATRi), AZD8055 (mTORi) and NU7441 (DNA-PKi).
For analysis of mRNA expression under mild oxidative stress, PC-3 cells treated with oxidative stress described above were collected, and total RNA was purified using the RNeasy Plus Mini Kit (QIAGEN). cDNA was synthesized using the ReverTra Ace qPCR RT Master Mix (Toyobo). Real-time quantitative polymerase chain reaction (qPCR) was performed with a universal probe library (UPL) probe (Roche) and qPCR Master mix (NIPPON GENE) using iCycler iQ Real-Time PCR Detection System (Bio-Rad Laboratories) as described above. The following primer sets and probes were used: SNHG1 mRNA (TaqMan probe, Hs00411543_m1); HO-1 mRNA (primers: ggcagagggtgatagaagagg and agctcctgcaactcctcaaa, UPL probe #15); ATF4 mRNA (primers: tctccagcgacaaggctaa and ccaatctgtcccggagaa, UPL probe #76); SLC7A11 (primers: ccatgaacggtggtgtgtt and gaccctctcgagacgcaac, UPL probe #80); GCLM (primers: gacaaaacacagttggaacagc and cagtcaaatctggtggcatc, UPL probe #18) and 18S rRNA (TaqMan probe, Hs99999901_s1).
Lentivirus production, concentration, and titer determination
We generated pLenti6-GFP_U6-sh-SMG1 and pLenti6-GFP_U6-sh-Rluc (siRNA target sequence: SMG1, AGGGATACAGTTGATATAT; Rluc, GGCCTTTCACTACTCCTAC) plasmids using standard molecular biology methods. The lentiviral supernatant was produced as follows. On the day of transfection, 5 × 10⁶ of 293FT cells were seeded into 10-cm culture dishes (20 dishes of each were prepared). Simultaneously, we prepared transfection mixture for each dish as the following method. Three µg of pLenti6-GFP_U6-sh-SMG1 or pLenti6-GFP_U6-sh-Rluc and 9 µg of ViraPower Lentiviral Packaging Mix (Thermo Fisher Scientific) were mixed in 1.5 mL of Opti-MEM medium (Thermo Fisher Scientific). Separately, 36 μL of Lipofectamine 2000 was diluted in another 1.5 mL of Opti-MEM. These two solutions were then mixed and incubated for 30 min at room temperature. After incubation, the mixtures were added to the 293FT cells, which were then cultured for 8 h. The medium was subsequently replaced for DMEM containing 10% FBS and the cells were cultured for 48 h. The culture supernatants were collected and filtered with a 0.22-µm Steriflip filter (Millipore) to generate the lentiviral supernatant. For the lentiviral concentration, we used PEG-it Virus Precipitation Solution (System Biosciences) following the manufacturer’s instructions.
To determine virus titers, we performed colony formation assay. In brief, 1 × 10⁻³ to 1 × 10⁻⁵ diluted lentivirus infection of 5 × 10⁵ of HT1080 cells cultured in 6-well plate was performed. Two days after infection, the medium was replaced with fresh medium containing 5 μg/mL blasticidin. After two weeks of culture, cells were stained with the crystal violet solution (1% crystal violet/10% ethanol) for 10 min at room temperature. After washing out the excess crystal violet with PBS, stained colonies were counted to determine the viral titer in transducing units (TU)/mL.
In vivo xenograft analysis
For analysis effects of SMG1 on xenograft formation, PC-3 cell-derived xenografts were generated as follows. Nude mice (BALB/c, male) were inoculated bilaterally in the flanks with 7 × 10⁶ of PC-3 cells suspended in 0.1 mL of saline. One week after cell inoculation, when tumor nodules of approximately 5 mm in diameter had formed, lentivirus expressing shRNA targeted to SMG1 or non-silencing control (TU: 1 × 10⁸) was directly injected into the tumor nodule. Tumor volume was calculated as V = (L*S2)/2. The maximum (L) and minimum (S) diameters of the tumor were measured every week for 4 weeks after lentivirus infection. The tumor growth curves represent the mean relative tumor volume to day 0 ± SEM.
For analysis effects of NPD15008 on the xenograft formation, nude mice (BALB/c, male) were inoculated with 1 × 10⁶ of PC-3 cells on the right flank. Daily starting 3 days after inoculation, 100 μL of 12 mM NPD15008 in DMSO or 100 μL of DMSO control was administered daily by intraperitoneal injection. Body weight of each mouse was measured every other day from day 9 to day 23 of cell inoculation. Tumor volume was calculated same as lentivirus infected experiment. Due to the limited solubility of NPD15008 in DMSO (up to 12 mM), higher doses required larger volumes of DMSO, resulting in increased toxicity. Consequently, the amount of NPD15008 could not be increased. In compliance with the guidelines and standards for use of laboratory animals, mice exhibiting signs of distress, including excessive weight loss, were removed from the experiments.
For all xenograft analysis, mice were housed at the Animal Facility of Yokohama City University School of Medicine in accordance with the institutional guidelines and standards for use of laboratory animals. Prior to experiments, animal studies were reviewed and approved by the Animal Studies Committee of Yokohama City University (Permit number: F15-006).
Western blot analysis, Immunoprecipitation assay and chromatin immunoprecipitation-qPCR analysis
For western blot analysis, samples were separated on a 4–20% gradient polyacrylamide gels (ATTO) in running buffer (250 mM Tris, 1920 mM glycine, 1% SDS) and transferred to Immobilon FL PVDF membranes (Merck) using EzFastBlot transfer buffer (ATTO). Signals were detected with the Luminata Classico Western HRP substrate (Merck), Luminata Forte Western HRP substrate (Merck) or ImmunoStar LD (Wako) and detected with a LuminoImager, LAS-4000, and Science Lab Image Gauge software (Fuji Photo Film). All experiments were performed at least three times, and representative results are shown.
For immunoprecipitation assay, 1 × 10⁶ cells were lysed by 0.5 mL in RIPA buffer [50 mM Tris-HCl, pH8.0, 150 mM Sodium Chloride, 0.5% Sodium Deoxycholate, 0.1% Sodium Dodecyl Sulfate, 1% NP-40, 50 μg/mL RNaseA, 1 mM dithiothreitol (DTT), protease inhibitor cocktail (Nacalai Tesque), EDTA-free phosphatase inhibitor cocktail (Nacalai Tesque)]. Lysates were incubated with antibodies [NRF2 (proteintech, 80593-1-RR Clone No.1I21), KEAP1 (proteintech, 10503-2-AP) or IgG control (CST, #2729)] and Dynabeads ProteinG (ThermoFisher) with gentle rotation at 4 °C for 2 h. The immunocomplexes were washed with washing buffer [50 mM Tris-HCl at pH 7.4, 50 mM NaCl, 0.05% Tween-20, 1 mM dithiothreitol (DTT), protease inhibitor cocktail (Nacalai Tesque), EDTA-free phosphatase inhibitor cocktail (Nacalai Tesque)], and boiled in 100 μL of standard 1 x LDS sample buffer and then analyzed by western blotting.
For chromatin immunoprecipitation assay, 1 × 10⁶ cells were cross-linked with 1% formaldehyde for 10 min at room temperature, followed by quenching with glycine, prior to being collected and lysed. Dynabeads ProteinA (ThermoFisher, 10002D) were pre-blocked with BSA and incubated overnight at 4 °C with 1 μg of either NRF2 antibody (proteintech, 80593-1-RR Clone No.1I21) or IgG control (CST #2729), and washed with RIPA buffer. Lysates containing chromatin fragments were incubated with washed antibody-bound beads for overnight at 4°C and washed with low-salt wash buffer [1% TritonX-100, 0.1% SDS, 2 mM EDTA (pH8.0), 150 mM NaCl, 20 mM Tris-HCl (pH8.0)], high salt wash buffer [1% TritonX-100, 0.1% SDS, 2 mM EDTA (pH8.0), 500 mM NaCl, 20 mM Tris-HCl (pH 8.0)] and LiCl buffer [0.25 M LiCl, 1% NP-40, 1% NaDOC, 1 mM EDTA, 10 mM Tris-HCl (pH 8.0)] with tube exchange at each steps. Immunoprecipitated protein-bound DNA fragments were eluted by elution buffer (1% SDS, 100 mM NaHCO3) and reverse cross-linked. DNA was purified using the FastGene Gel/PCR Extraction Kit (FastGene). Purified DNA was amplified and quantified by qPCR using TB Green® Premix Ex Taq™ II (Tli RNaseH Plus) (Takara). Total DNA served as input and quantified using the Qubit dsDNA HS Assay Kit (ThermoFisher). The following primer sets were used: HMOX1 (HO-1) enhancer (primers: GGTAGGCAGGAGGAAGTGAA and GGGCAGATTGAGGTGGACT); GCLM ARE (primers: GGAGAGCTGATTCCAAACTG and GAGTAACGGTTACGAAGCAC); p21 upstream (primers: GAGTCTTGCTCAGTGGGAGCTCTGGGAGTA and ATGTGACTTGGGGTGAGGCCTACTCGG).
In vitro oxidative stress analysis
PC-3, a human prostate cancer cell line with a nonsense mutation in p53, was seeded at a density of 5 × 10⁵ cells per well in a 6-well plate. HepG2, a human hepatocellular carcinoma cell line with wild-type p53, was seeded at a density of 2 × 10⁶ cells per 10 cm dish. After 24 h, culture medium was replaced with freshly prepared medium containing DMSO, diethyl maleate (DEM) (Fujifilm Wako Pure Chemical), NPD15008, or NU7441 as indicated. After an additional 24 h, cells were subjected to analysis. Intracellular total ROS, lipid peroxides, ferrous iron and annexin V apoptosis marker were detected with DCFH-DA probe (Dojindo), Liperfluo (Dojindo), FerroOrange (Dojindo), and Annexin V-633 Apoptosis Detection Kit (Nacalai Tesque), respectively. Fluorescence was detected on an EVOS FL fluorescence microscope (AMG), FACSCalibur (BD Biosciences), or LSR Fortessa (BD Biosciences). For flow cytometry analysis, cells were suspended in phenol red-free DMEM following detachment with Accutase (Innovative Cell Technologies). Flow cytometry data were analyzed by FlowJo (BD Biosciences).
In vivo oxidative stress analysis
For in vivo analysis of the effects of NPD15008 on apoptosis and ferroptosis, C57BL/6 mice (female, 6–8 weeks) were intraperitoneally injected with either 100 uL of 9 mM NPD15008 or 100 μL of DMSO as a vehicle control. At 6 or 8 h after injection, the livers were collected and mechanically dissociated by gentle tearing in RPMI 1640 containing 0.5 mM collagenase type IV (Sigma-Aldrich), followed by filtration through a 70-μm cell strainer. The cell suspension was centrifuged at 50 x g for 5 min, and the pellet was washed once with Hanks’ Balanced Salt Solution (HBSS). Cells were stained with Annexin V-633 Apoptosis Detection Kit (Nacalai Tesque), DCFH-DA (Dojindo), Liperfluo (Dojindo), and FerroOrange (Dojindo). Stained cells were analyzed by flow cytometry and fluorescence intensity was quantified as the mean fluorescence intensity (MFI). Flow cytometric analysis was performed using an LSR Fortessa (BD Biosciences) and all data were analyzed using FlowJo software (Tree Star). For all apoptosis and ferroptosis analyses, mice were housed at the Animal Facility of Kindai University in compliance with the institutional guidelines and standards for use of laboratory animals (KAPS-2025-002).
Definition of mild and excessive oxidative stress
To experimentally distinguish between mild and excessive oxidative stress, intracellular total ROS levels were estimated using DCFH-DA-based fluorescence analysis as a semi-quantitative readout of total ROS accumulation. DCFH-DA detects multiple reactive oxygen species, including hydrogen peroxide, peroxyl radicals, and related oxidants, and was therefore used to assess intracellular total ROS rather than specific ROS. Oxidative stress was induced by diethyl maleate (DEM), which depletes intracellular glutathione and thereby promotes endogenous ROS accumulation. For calibration purposes, cells were additionally exposed to defined concentrations of exogenously supplied hydrogen peroxide (0–100 μM) prior to DCFH-DA staining. Because basal intracellular ROS levels under steady-state conditions are estimated to be below approximately 100 nM,64 their contribution to the fluorescence signal was considered negligible relative to exogenously applied H₂O₂ and DEM-induced ROS accumulation. Under these conditions, treatment with 200 μM DEM for 4 h resulted in intracellular total ROS levels comparable to those observed upon exposure to at or below 1 μM H₂O₂, without activation of canonical anti-survival stress pathways such as ATM–CHK2 or JNK signaling. We operationally defined this condition as mild oxidative stress. In contrast, DEM concentrations ≥800 μM were required to induce intracellular total ROS levels comparable to those observed following approximately 100 μM H₂O₂ and were accompanied by robust phosphorylation of CHK2 and JNK. We operationally defined this condition as excessive oxidative stress. These definitions were based on functional signaling outcomes rather than absolute ROS quantification.
Microscale thermophoresis analysis
For a quantitative measurement of the equilibrium dissociation constant, KD value, between KEAP1-DC and NRF2 (1–56), microscale thermophoresis (MST) experiments were performed. His-SBP-KEAP1-DC (residues 321–609), used as the MST target, was fluorescently labeled using the Monolith NT His-Tag Labeling Kit (NanoTemper Technologies). GST-NRF2 (1–56) wild-type (WT) or mutants (S13E, S40E and S13E/S40E) used as MST ligands, were serially diluted in twofold steps from a 63 μM stock solution in PBS containing 1 mM DTT.
A solution of 100 nM labeled His-SBP-KEAP1-DC was mixed with each diluted GST-NRF2 (1–56) WT or mutants in a 1:1 ratio. The final concentration of labeled His-SBP-KEAP1-DC was 50 nM, and the final concentrations of GST-NRF2 (1–56) ranged from 31.5 μM to 0.953 μM. Mixtures were incubated at 4 °C for 1 h to reach an equilibrium state. Each sample was loaded into glass capillaries (NanoTemper) and the thermophoresis analysis was performed using a Nanotemper Monolith NT.115 instrument (40% Excitation power and Medium MST power). The MST curves and KD values were derived from two independent experiments using the NanoTemper analysis software (NanoTemper).
4sU metabolic RNA labeling
PC-3 cells were seeded in a 6-well plate at 2.5 × 10⁵ cells per well. After 24 h, the medium was replaced with 2 mL of fresh medium. The next day, the medium was quickly replaced with a freshly prepared medium containing 200 µM 4-thiouridine (4sU) with either 0.2% (v/v) DMSO or 200 µM DEM with or without 9 µM NPD15008 and/or 4 µM NU7441. The cells were incubated at 37 °C for 3 h and lysed in 500 µL of ISOGEN II (NIPPON GENE) supplemented with 1 mM DTT, and the prepared sample solution was stored at –20 °C. The manufacturer’s instructions were followed for RNA extraction using ISOGEN II, and the RNA samples were assessed for quality and quantity on MultiNA capillary electrophoresis instrument (Shimadzu).
SLAMseq and QuantSeq
Total RNAs were processed according to the standard SLAMseq protocol described previously.65 5 µg of total RNA was incubated in 50 µL of alkylation buffer [50 mM NaPO4 buffer (pH 8.0), 50% (v/v) DMSO, 10 mM iodoacetamide] at 50 °C for 15 min. The reaction was quenched by adding 1 µL of 1 M DTT, followed by ethanol precipitation. 500 ng of total RNA was used as an input for QuantSeq 3’ mRNA-Seq Library Prep Kit FWD for Illumina (Lexogen). The cDNA library was prepared according to the manufacturer’s instructions. Libraries were assessed for quality using a MultiNA capillary electrophoresis instrument (Shimadzu), multiplexed to equimolar concentrations, and sequenced using the HiSeq X system (Illumina) in PE-150 mode.
Bioinformatic analysis
4sU-labeled nascent RNAs were quantified using SLAM-DUNK v 0.4.2 with default parameters.65,66 12 bases from the 5’ end were trimmed as adaptor-clipped reads, and then five or more subsequent adenines from the 3’ end were regarded as the remaining poly (A) tail and removed. Up to 100 regions with multiple mapped reads were allowed. The sequence reads were aligned on genome-wide 3’ UTR sequences generated based on the human genome sequence (GRCh38.p13) and annotation data. Differential gene expression analysis was performed using DESeq2 v 1.3.8.67 To analyze the nascent T > C reads with the DESeq2, we calculated size factors using the total read counts. The log2 fold changes calculated by DESeq2 were normalized as z-scores and used to plot the cumulative curves. The following gene sets were used to plot cumulative curves: NRF2 transcriptional target genes50; ATF4/CHOP transcriptional target genes68; genes involved in pro-ferroptosis and anti-ferroptosis46 ; FOXO1 (CHEA Transcription Factor Targets), FOXO3a (GeneRIF Biological Term Annotations), and NF-κB (GeneRIF Biological Term Annotations) transcriptional target genes, as well as genes involved in anti-apoptosis and necroptosis from Harmonizome69; p53 (M5939) and AP-1 (M7477) transcriptional target genes, as well as genes involved in pro-apoptosis from GSEA MSigDB 3.0.70,71
TCGA RNA-seq datasets [prostate adenocarcinoma (PRAD), pancreatic adenocarcinoma (PAAD), head and neck squamous cell carcinoma (HNSC), breast invasive carcinoma (BRCA), uterine corpus endometrial carcinoma (UCEC), lung adenocarcinoma (LUAD), lung squamous cell carcinoma (LUSC), and esophageal carcinoma (ESCA)] were downloaded from NCI Genomic Data Commons Data Portal (https://portal.gdc.cancer.gov/v1/). Count data were normalized using size factors obtained by DESeq2 and used to calculate Spearman R.
For the mutation analysis, LUAD and LUSC samples were categorized into two groups based on the status of KEAP1 and NFE2L2 mutations, respectively. Mutation data and functional annotations were obtained from the TCGA Pan-Cancer Atlas project.72 Samples harboring mutations annotated as “Oncogenic”, “Likely Oncogenic”, or “Resistance” were assigned to the “harmful” group, while all other samples were classified as the “no harm” group. Spearman correlation analysis was performed independently for each group to evaluate whether the presence of these mutations influenced the association between SMG1 or DNA-PK expression and NRF2-target genes expression.
Statistical analysis
Statistical analyses were performed using one-way ANOVA with Tukey’s multiple-comparison test, Sidak’s multiple-comparison test or unpaired t test. Data were obtained through three or four independent experiments and values represent the means ± standard error or standard deviation. P values < 0.05 were considered statistically significant.
