


All research was conducted in accordance with all relevant ethical regulations. GSC (-) and GSC (+) were established from a patient enrolled in the STEMRI clinical trial (ClinicalTrials.gov Identifier: NCT01872221). The STEMRI trial was approved by the French Ethics Committee (registration No. 2012-A00585-38) and by the French Drug Administration (ANSM; registration No. B120639-40). Written informed consent was obtained from all participants. All animal procedures were approved by the National Cancer Institute Animal Care and Use Committee (NCI-ACUC, NIH) under protocol LCMB-040-2-F and were performed in accordance with the NIH Guide for the Care and Use of Laboratory Animals.
Cell culture
The human glioblastoma cell line U-251 MG was purchased from Cytion (CLS Cell Lines Service GmbH, Germany; Cat. No. 300385). GSC (−) and GSC (+) (also known as SRC1 and SRC2, respectively), were established from a single GBM specimen obtained from a patient enrolled in the STEMRI clinical trial (ClinicalTrials.gov Identifier: NCT01872221) ³¹. GSC (−)/and GSC (+) were derived from two spatially distinct biopsies collected from the infiltrative FLAIR region identified by MRI/MRSI-guided surgery. Specifically, GSC (−) originated from the FLAIR/CNI− region, whereas GSC (+) was established from the FLAIR/CNI+ region, a metabolically more active area. Both regions, FLAIR/CNI− and FLAIR/CNI + , were enriched in GSCs. Following tissue dissociation, cells were cultured under serum-free neurosphere conditions supplemented with EGF and FGF-2 to enrich for GSC. Both cell populations formed neurosphere-like aggregates and generated stable primary and secondary neurospheres, demonstrating their self-renewal capacity. GSC cultures were characterized by RT–qPCR analysis of markers associated with different neural cell lineages, including GFAP and CHI3L1 (astrocytic markers), TUBB3 and GAP43 (neuronal markers), and OLIG1, OLIG2, SOX11, and SOX2 (oligodendroglia and stem cell markers). This gene expression profile was maintained throughout serial passaging in culture, indicating preservation of the stem cell properties characteristic of GSCs, as previously described17.
U251 was cultured in DMEM-F12 (1:1) medium (Gibco, 31330-038) supplemented with 10% fetal calf serum (FCS, Eurobio) and 1% penicillin/streptomycin (final concentration 100 U/mL; Thermo Fisher Scientific). GSCs were cultured in suspension in DMEM-F12 (Sigma) supplemented with B27 (50×, Gibco), N2 (100×, Gibco), and 20 ng/mL FGF-2 and EGF (Peprotech), as previously described17. HN12 HNSCC-derived cell line was cultured in DMEM supplemented with 10% FBS and 1% penicillin/streptomycin. 4MOSC1 syngeneic-derived cell line previously described46, was cultured in Keratinocyte medium supplemented with SFM Growth supplement, EGF (5 ng/ml), choler toxin (5×10^11 M) and 1% penicillin/streptomycin. All the cells were maintained at 37 °C in 5% CO2 humidified incubators. Fresh medium was added, or passages were performed to the cell culture every 2–3 days. Absence of mycoplasma contamination was verified with MycoAlertTM Mycoplasma Detection Kit (Lonza). All methods were carried out in accordance with the approved guidelines of our institution.
Murine primary AS preparation
Primary cortical AS were prepared from C57BL/6 wild-type or ROSAmT/mGmT mice from our in-house colony (Institut Pasteur, Paris, France) and used at postnatal days 0 to 3 (P0–P3). Briefly, following decapitation of the pups, the meninges were removed from the brain, and cortices were pooled before homogenization. Dissociated cortical cells (neocortex) were cultured in 75 cm² flasks coated with 5 µg/mL poly-D-lysine (PDL) in complete AS medium, consisting of DMEM-F12 (1:1) (Gibco) supplemented with 10% FCS (Eurobio) and 1% penicillin/streptomycin (Thermo Fisher). Cultures were maintained at 37 °C in a humidified atmosphere containing 5% CO₂ until they reached confluency (7–10 days in vitro). Culture medium was refreshed every three days. To inhibit proliferation of other glial cells, a mixture of 5-fluoro-2′-deoxyuridine and uridine (10 µg/mL; Sigma-Aldrich) was added for one week. For experiments, confluent cultures were detached with trypsin and seeded onto PDL-coated multi-well plates. Before initiating experiments, AS cultures were characterized by immunostaining with rabbit anti-GFAP, a well-established AS marker (see schematic, Fig. S5 A). Rabbit anti-GFAP antibody (Dako, Cat. No. Z0334) was used for immunofluorescence at a dilution of 1:500.
Lentiviral constructs
To label mitochondria, the lentiviral plasmids pLV-CMV-mito-GFP (Takara Bio, #632432) and pLV-CMV-DsRed-mito (Takara Bio, #632421) were used. These plasmids encode the mitochondrial targeting sequence of subunit VIII of human cytochrome c oxidase fused to GFP or DsRed, respectively. To visualize actin filaments in different colors, the lentiviral plasmids pLenti F-tractin-mCherry PuroR (Addgene plasmid #85131), pLenti Lifeact-mTagBFP2 PuroR (Addgene plasmid #101893), and pLenti Lifeact-iRFP670 BlastR (Addgene plasmid #84385) were used. Each construct was selected to provide distinct fluorescent markers to track actin dynamics in multicolor imaging applications. For MT visualization, L304-EGFP-Tubulin-WT (64060, Addgene) was employed. This plasmid encodes EGFP-tagged tubulin, allowing for the observation of MT structures within the cellular environment.
Lentiviral particle production and transduction
Lentiviral particles (LVs) were generated in HEK 293 T cells cultured in DMEM-F12 (Gibco), supplemented with 10% FCS (EuroBio) and 1% penicillin/streptomycin (Thermo Fisher) at 37 °C in a humidified atmosphere containing 5% CO₂. The cells were seeded in T75 flasks the day prior to transfection to achieve 50–70% confluency. Transfection was performed using a mixture of plasmids encoding lentiviral components, specifically pCMVR8.74 (Gag-Pol-HIV1) and pMDG2 (VSV-G), along with the plasmid of interest at a ratio of 4:1:4 (μg), respectively. FuGENE HD Transfection reagent (Promega) was used according to the manufacturer’s protocol. After 48 h, LVs were concentrated using LentiX-Concentrator (Takara Bio), and the resulting pellet was resuspended in 1 mL of PBS. For transduction, 500 µL of the resuspended LVs were added directly to the target cells of interest, including U251, GSCs, HN12, or primary cortical AS, which had been plated in T75 flasks the day before infection to achieve 50–70% confluency. The cells were allowed to incubate with the LVs for a minimum of 48 h for effective transduction. Positive cells were subsequently sorted using a BD FACS Aria III cell sorter (BD Biosciences).
Live imaging
Two microscopes were used to perform time-lapse movies and analysis on live samples in 2D-classical culture: Spinning disk X1 Metamorph RCH (SD M) and Spinning disk W1 Nikon eclipse Ti2 confocal system (SD Ti2) (Nikon Instruments, Melville, NY, USA). These microscopes are equipped with a climate box to maintain humidity at 95%, temperature at 37 °C, and 5% CO2 concentration. The utilized excitation laser was a white light laser (WLL), adjustable across wavelengths from 470 nm to 670 nm. To minimize cell stress, cell death, and photobleaching, the power of the WLL was maintained at the lowest possible level during imaging acquisition. All samples were acquired as z-stacks, with an average overall size of 7 µm, covering the whole volume of cells, either when they were alone or in co-culture, and a z-step size varying between 300 nm and 700 nm. The magnification used for all the mitochondria tracking movies and analysis of mitochondria health ranged from a minimum 40X to 100X, depending on the aim of the experiment.
Objective used:
-
60X oil immersion objective (Nikon APO60x NA = 1.4 CSU) on SD M.
-
40X water immersion objective (Apo LWD 40X NA = 1.15 WD = 610 µm); and oil immersion objective 60x (Plan Apo 60XOIL NA = 1.42 WD = 150 µm) and 100X (Plan Apo 100X OIL NA = 1.45 WD = 130 µm) on SD Ti2.
Live-imaging analysis
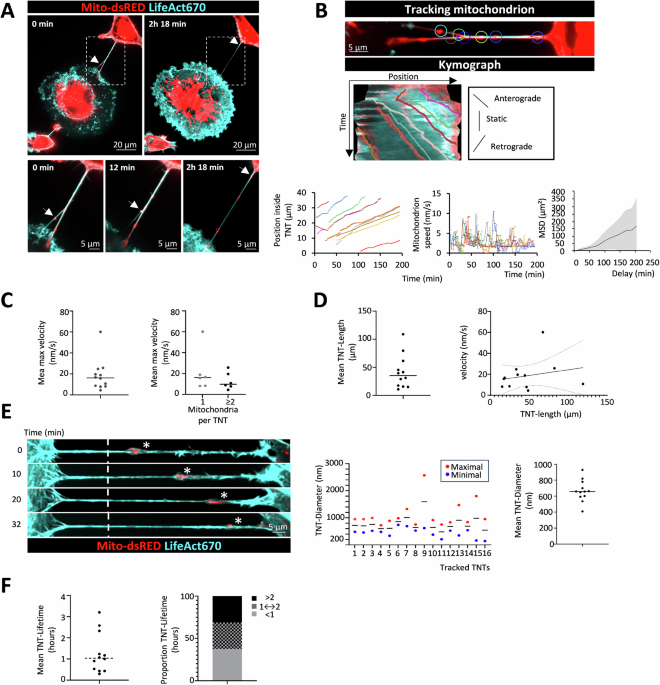
The TNT dimensions, length and diameter were measured using spinning-disk confocal microscopy during live imaging of TNTs actively transferring mitochondria.
Tracking mitochondrion movement inside the TNTs
The TrackMate program, developed by Jean-Yves Tinevez, was utilized to generate kymographs and analyze mitochondrial length and velocity within the TNTs over time, as detailed in the Data and Methods availability section of this publication in FIJI65. This tool can track objects inside a TNT while the connected cells migrate, providing the mitochondrial position relative to the TNT throughout the transfer process and yielding data on velocity and movement direction (anterograde, static, and retrograde).
Since the objects travel along a line following the TNT, assessing their speed is best accomplished via kymograph analysis. However, as the cells connected by the TNT move, the TNT itself changes position and size during imaging, making traditional kymograph tools inadequate. To address this, we developed a custom tool that constructs kymographs across a moving line over time. This tool relies on TrackMate66 to manually track the two endpoints of the TNT, and a custom extension enhances it by offering kymograph analysis and object tracking in the reference frame of the TNT.
The analyzed movies ranged from 20 min to 3 h, depending on the cytoskeletal composition, with a 2 min interval between frames. Minimal laser intensity was employed for each channel to avoid phototoxicity.
TNT thickness/diameter over time
Most analyses of TNT thickness are conducted on fixed samples. However, TNTs are highly dynamic structures that are very sensitive to fixation. Furthermore, the fixation process can disrupt some of these connections, particularly those involving Actin-based TNTs.
In this study, TNT thickness was measured using live imaging assays with a custom Jython macro65 (see “Data and Methods”). Briefly, we assessed the intensity profile in the LifeAct fluorescent channel, fitting this profile with a Gaussian function to derive the TNT thickness. This approach allowed us to obtain TNT thickness measurements across different time frames of the recorded movie.
Mean-square displacement (MSD) of mitochondria
MSD was performed on the mitochondria tracked within the TNT, using a methodology and a MATLAB tool previously developed37. The dataset for the analysis included the tracks of 24 mitochondria. We fitted the first 25% of the log-log of the 24 MSD curves by a straight line and kept only the fits with a R2 larger than 0.8. The distribution of the slopes of the fits were larger than 1 (one-sided t-test, p < 10-10, confidence interval [1.58 – ∞]), revealing that the mitochondria are undergoing active motility inside TNTs.
Manders’ co-localization coefficients assay
The co-localization of D-derived mitoGFP with tetramethylrhodamine methyl ester (TMRM, 50 nM, active mitochondria) or Lysotracker Blue DND-22 (50 nM) in recipient cells was quantified using the JACoP plugin in FIJI, providing a measure of the overlap between two fluorescence signals, with values ranging from 0 (no overlap) to 1 (perfect overlap). After co-culturing D mitoGFP (mitochondria in green) and Acc lifeAct-670 cells (actin filaments in far-red) for 4 days, the double-positive cells were sorted, seeded overnight, and labeled with TMRM ± Lysotracker Blue. Images were acquired using SD at 37 °C and 5% CO₂. For each individual cell, fluorescence channels were extracted, and thresholds were adjusted to calculate the Manders’ co-localization coefficients.
Mitochondrion fusion into the mitochondrial network of the acceptor cell
Movies highlighting the fusion of donor cell mitochondria with the acceptor cell mitochondria network were generated with Fiji using the Labkit annotation plugin (https://doi.org/10.3389/fcomp.2022.777728). Briefly: the donor mitochondria were manually labelled in Labkit over time, up to the fusion with a the donor cell network. This network was then also manually labelled, first forward in time after the fusion events, then backward in time up to the beginning of the movie.
Fixed samples imaging
Fixed samples were imaged using a laser scanning confocal microscope LSM 700 (Zeiss). Images were acquired with either a 40X or a 63X oil immersion objective (zoom 0.5), both of which have a numerical aperture of 1.4, using the Zen acquisition software (Zeiss). For each sample, a 3×3 mosaic image was captured with a 10% overlap to expand the field of view. The acquired images were then processed using ICY software (Quantitative Image Analysis Unit, Institut Pasteur, http://icy.bioimageanalysis.org) or FIJI software.
TNT counting
TNTs were identified according to the protocol of Sáenz-de-Santa-María I. et al.67. Cells were plated at 50% confluence for TNT visualization, at a density of 40,000 to 60,000 cells/cm². The adhesion surface was pre-coated with either poly-D-lysine (0.1 mg/ml), for AS alone or AS-U251 co-culture, or laminin (10 mg/ml, Sigma) for AS-GSCs co-cultures. The percentage of TNT-connected cells was analyzed in live, unfixed samples to assess mitochondrial presence within TNTs and to evaluate cytoskeletal composition. For general quantification of TNT-connected cells, fixed samples were stained with the membrane marker Wheat Germ Agglutinin (WGA), which enhances visualization of these structures. To preserve TNT integrity during fixation, cells were treated with solution 1 (2% paraformaldehyde PFA, 0.05% glutaraldehyde, and 0.2 M HEPES in PBS) for 15 min, followed by an additional 15 min with solution 2 (4% PFA and 0.2 M HEPES in PBS) at 37 °C.
Morphological image analysis
Morphological image analysis (area, perimeter, circularity, and aspect ratio) was performed using FIJI. Cells were segmented from fluorescence images (LifeAct-670 channel) following background subtraction and thresholding. Binary masks were generated and analyzed using the “Analyze Particles” function. For each detected cell, area, perimeter, circularity, and aspect ratio were quantified. Segmentation results were manually curated when necessary to correct for inaccurate detection. Data were exported for downstream statistical analysis using GraphPad Prism. Outliers in area, perimeter, and aspect ratio were identified using the ROUT method (Q = 1%) implemented in GraphPad Prism and were excluded prior to statistical analysis. The number of excluded data points is indicated in the corresponding figure legends where applicable.
Cryogenic electron tomography (Cryo-ET) data acquisition and tomogram reconstruction
The cryo-EM data were collected from multiple grids at the NanoImaging Core Facility of the Institut Pasteur using a Thermo Fisher Scientific 300-kV Titan Krios G3 cryo-transmission electron microscope equipped with a Gatan BioQuantum energy filter and K3 direct electron detector. Data acquisition was performed using Thermo Fisher Scientific Tomography software. Tomograms were acquired using a dose-symmetric tilt scheme (79), with a tilt range of ±60° and a 2° tilt increment. Tilt images were recorded in counting mode at a calibrated physical pixel size of 3.2 Å. The total electron dose over the full tilt series was 3.295 e⁻/Ų, with a dose rate of 39,739 e⁻ per pixel per second and an exposure time of 1 s per tilt image. The defocus range applied was between −3 and −6 µm.
Quantification mitochondria transfer by flow cytometry assays (FACS)
Transfer assays were performed according to the protocol of Sáenz-de-Santa-María I et al67. Experimental triplicates were performed for each co-culture condition. To monitor transfer by secretion in a 2D co-culture setup, D and Acc cells were co-cultured with a 1 µm filter separating them. This filter prevents direct cell-cell contact while allowing the passage of mitochondria (0.5–1 µm in diameter). For FACS analysis, cells were passed through a cell strainer to remove aggregates and then fixed in 2% PFA. FACS data were acquired on a BD LSR Fortessa flow cytometer, with GFP and far-red fluorescence detected at 488 nm, and 670 nm excitation wavelengths, respectively. Ten thousand events were acquired per condition, and data were analyzed using BD FACSDiva. FlowJo v10.1.1. Acc cells were identified as Alexa Fluor 670-positive events, whereas donor-derived mitochondria were detected by mitoGFP fluorescence. Mitochondrial transfer was calculated as the percentage of mitoGFP-positive Acc cells (double-positive events) within the total Acc cell population. Because AS displayed lower transduction efficiency and proliferated at a slower rate than GB/GS cells, the percentage of transferred mitochondria was normalized to a theoretical 1:1 donor-to-acceptor cell ratio. The normalization factor was calculated from the experimentally determined donor/acceptor ratio in each sample, and the normalized transfer efficiency was used for all statistical analyses.
RNA-seq
GSC (+) have received astrocytic mitochondria (mito-dsRED + ) and without astrocytic mitochondria (mito-dsRED-) were sorted after 4 days of co-culture in 2D-culture with murine AS expressing mito-dsRED in a ratio of 3 D to 1 Acc (GSC +), to allow the accumulation of mitochondria, from three independent experiments. After sorting, the cells were examined by fluorescence microscopy, and RNA was extracted using the RNeasy Micro Kit (Qiagen). cDNA libraries were prepared using Illumina Stranded mRNA library Preparation Kit (Illumina) following the manufacturer’s protocol from 250 ng of RNA. Pooled libraries were additionally purified of unbound adaptors and primer dimers on AMPure XP magnetic beads (Beckman-Coulter). Sequencing was performed on a NextSeq2000 sequencing system (Illumina) to generate 40-60 million reads per sample (150 bp).
The RNA-seq analysis was performed with Sequana version 0.16.11. In particular, we used the RNA-seq pipeline (v0.19.1) available on https://github.com/sequana/sequana_rnaseq, based on Snakemake framework. The RNA-seq pipeline trimmed the reads from adapters and low-quality bases using fastp software v0.20.1. Then it mapped the reads to the Homo Sapiens genome (GRCh38 hg38) using STAR. Note that we decided to perform dual mapping by also including the Musculus genome because small contamination with murine AS samples were also present in the reads. For the read count and subsequent statistical analysis, mouse content was ignored. The read count matrix on Human annotation file was then used to identify differentially regulated genes. Differential expression testing was conducted using DESeq2 library 1.30.068, scripts (also available in Sequana v0.16.11).
Finally, HTML reporting was available as the output of the Sequana RNA-seq pipeline. Parameters of the statistical analysis included the significance (Benjamini-Hochberg adjusted p-values, false discovery rate FDR < 0.05) and the effect size (fold-change) for each comparison considered. All software used within the RNAseq pipeline was containerized and is available within the Damona project (damona.readthedocs.io) and downloaded automatically by the RNA-seq pipeline (enforcing reproducibility of the analysis).
Concerning the comparison of GSC (+) pos (mito-dsRED + ) versus GSC (+) neg (mito-dsRED), genes with an adjusted P value of <0.05 and log2 fold change >1 were selected for an enrichment analysis. We performed GO term enrichment using the Panther database69. These enrichments were performed with the Sequana standalone called enrichment-panther feeding the list of differentiated genes of interest. The Panther databases was accessed through the BioServices package70.
The RNA-seq dataset and DE results are deposited in a public repository: https://www.ebi.ac.uk/biostudies/ArrayExpress/studies/E-MTAB-15406?key=3b85fab0-11e9-4852-aa9d-455dbff57878, :https://doi.org/10.6019/E-MTAB-15406.
Animal experimentation
All animal procedures were approved by the National Cancer Institute Animal Care and Use Committee (NCI-ACUC, NIH) under protocol LCMB-040-2-F and were performed in accordance with the NIH Guide for the Care and Use of Laboratory Animals. Female athymic (nu/nu) nude mice or mitoDendra2 (6–8 weeks old, 20–25 g) were used in this study. Mice were housed in sterile filter-top cages under a 12 h light/12 h dark cycle at 22 ± 2 °C and 40–60% relative humidity, with food and water provided ad libitum, and were provided with a soft dough diet from the day of tumor cell injection. Tumor growth and animal health were monitored weekly throughout the study. Animals were euthanized at the predetermined experimental endpoint 40–50 days after tumor cell injection, at which time tissues were collected. No animals reached the predefined humane endpoints during the study, in accordance with the approved animal protocol. The endpoints include Hunched posture, rough hair coat; Dehydration (reduced skin turgor, sunken eyes); Rapid or labored breathing, coughing; Reduced/impaired mobility affecting the ability to obtain food or water; Pallor or cyanosis (evident in the general appearance feet, muzzle or ears which may turn white or blue); Hemorrhage or bleeding from any orifice; Diarrhea, constipation or markedly reduced intake; Signs of neurological impairment for example seizures, paralysis, circling, head tilt; Impaired ability to urinate or defecate; jaundice (yellow discoloration to ears, muzzle, or feet); Loss of > 15% normal body weight from prestudy baseline.
Tumor endpoints
SQ Tumors: Single tumor approaching 2 cm in any one direction; Tumor Ulceration/Necrosis; Tumors interfering with normal movement impairs their ability to perform bodily functions, significantly impairs gait, or impairs their ability to obtain food or water; Tumors interfering normal bodily functions such as urination, defecation, breathing, chewing, or swallowing; Dyspnea at cage side observation
Tongue tumor xenograft in immunocompromised athymic nu/nu mice
The tongue xenograft tumor generation was performed as previous described by Amornphimoltham et al.45. Briefly, female athymic nude mice (6–8 weeks old; The Jackson Laboratory) were anesthetized using isoflurane 2–5% and maintained under continuous anesthesia through a nose cone. The tip of the tongue was gently pulled out of the mouth. Half a million HN12 cells, consisting of D cells co-expressing mitoGFP-lifeAct-BFP2 and Acc cells expressing F-tractin-mCherry in 20 µl saline, were submucosally injected into the lateral anterior region of the tongue using an insulin syringe. The needle was inserted up to 1–2 mm, injecting the cells as close to the surface as possible. The animals were fed a soft dough diet from the day of injection. Tumor growth was monitored, and ISMic was performed every two days for up to 40 days (Fig. 6A). ISMic was conducted when the tumor reached 150 µm from the surface, allowing the acquisition of high-quality images.
Syngeneic HNSCC mice model
4MOSC1 derived-cell line, previous described to recapitulates the human tobacco-related HNSCC mutanome46, were labeled with dextran red (TXR-D, MW70 KDa). 5 × 10⁵ cells suspended in 20 μL saline were injected into the ventral tongue of female mitoDendra2 mice (6–8 weeks old) which express all mitochondria in green (B6;129S-Gt(ROSA)26Sor tm1.1(CAG-COX8A/Dendra2)Dcc/J, https://www.jax.org/strain/018397#,The Jackson Laboratory). After the development of the tumor ISMic were performed in the animal alive to visualize the transfer from the TME into de tumoral 4MOSC1 cells.
Intravital two-photon microscopy in rodents alive (ISMic)
After the tumor developed, we performed ISMic as previous described34. Mice were anesthetized with intraperitoneal injections of ketamine (100 mg/kg) and xylazine (10 mg/kg). Animals were placed on a preheated stage with the mouth open, and the tongue was gently retracted using nontoothed forceps and held in a custom-made holder, secured with a glass coverslip. Body temperature was maintained at 37–38 °C using a preheated stage. Imaging was performed by using an inverted laser-scanning two-photon microscope (MPE-RS, Olympus, Center Valley, PA, USA) equipped with a tunable laser (Insight DS + , Spectra Physics, Santa Clara, CA, USA). Three excitations wavelengths to image distinct structures and fluorophores in live samples: 740 nm for collagen fibers via second-harmonic generation (SHG), 900 nm for mitochondria (stained with mito-GFP), and 1080 nm for mCherry–F-tractin and Texas Red–70 kDa dextran. Using silicon-oil immersion objectives (refractive index = 1.40), the theoretical two-photon diffraction-limited resolutions were calculated as follows. For the 30×/1.05 NA objective: ~225 nm/605 nm (lateral/axial) at 740 nm, 275 nm/745 nm at 900 nm, and 330 nm/880 nm at 1080 nm. For the 40×/1.25 NA objective: ~190 nm/425 nm, 235 nm/520 nm, and 277 nm/620 nm, respectively. These values, derived from theoretical point-spread-function limits for two-photon excitation, define the apparent spatial resolution attainable under our imaging conditions.
Emitted light was collected by an appropriate set of mirrors and filters on 3 GaAsP detectors (bandpass filters: Blue = 410–460 nm, Green = 495–540 nm, Red = 575–645 nm). Images were acquired using 37 °C heated objectives: 30X and 40X silicone oil immersion UPLSAPO objectives (NA 1.05 and 1.25, respectively), from Olympus. The first detector collagen fibers through SHG. The second captured mitoGFP and lifeAct-BFP2 signals, while the third detected mCherry and TXR-70. For time-lapse imaging of the live animals, the acquisition speed was set to 2 or 5 min of intervals, and duration up to 2 h.
Imaging post-acquisition procession: deconvolution and 3D-rendering
Background noise in ISMic movies was reduced by applying a 2 × 2 pixel low-pass filter to each image for one or two rounds using Metamorph software (Molecular Devices). Images were then deconvolved using the Huygens Professional Deconvolution program (Scientific Volume Imaging B.V., Hilversum, Netherlands), which calculated a theoretical point spread function (PSF) based on the microscopy parameters. Deconvolution was performed with an interactive Classical Maximum Likelihood Estimation (CMLE) algorithm. For 3D volume rendering, Imaris 9.8.2 64-bit (Bitplane) was used. Drift correction was applied using the Correct 3D Drift plugin in FIJI. Final preparation of movies and images was managed with FIJI software.
Statistics and reproducibility
Statistical analyses and graphs were generated using GraphPad Prism version 9 (GraphPad Software). Data distribution was assessed using the Shapiro–Wilk normality test. Data are presented as mean ± SD for normally distributed datasets and median for non-normally distributed datasets unless otherwise indicated. Comparisons between two groups were performed using two-sided unpaired Student’s t-tests for normally distributed data or two-sided Mann–Whitney U tests for non-normally distributed data. Comparisons among more than two groups were performed using one- or two-way ANOVA followed by Tukey’s or Šídák’s multiple-comparisons tests, or by Kruskal–Wallis tests followed by Dunn’s multiple-comparisons tests, as appropriate. Correlations were assessed by linear regression, categorical distributions by χ² tests and differential gene expression by the Wald test implemented in DESeq2 with Benjamini–Hochberg correction for multiple testing. Exact P values are reported whenever possible, and statistical significance was defined as P ≤ 0.05. No statistical method was used to predetermine sample size. No data were excluded from the analyses, except for predefined outliers identified using the ROUT method (Q = 1%) for Manders’ colocalization coefficient analyses. The experiments were not randomized. The investigators were not blinded to allocation during experiments or outcome assessment. The number of biological replicates (N), technical replicates (n), sample sizes, statistical tests, and exact P values are provided in the corresponding figure legends.
Reporting summary
Further information on research design is available in the Nature Portfolio Reporting Summary linked to this article.
