


Animal
Healthy BALB/c nude mice were sourced from GemPharmatech (Jiangsu, China) and housed at the Animal Experiment Center of Anhui Medical University under conventional laboratory settings. All animal experiments were performed following protocols approved by the Ethics Committee of Anhui Medical University (Anhui, China).
For CDX experiments, six-week-old male BALB/c nude mice were randomly assigned to experimental groups (n = 5 per group), and investigators were blinded to group allocation during data collection and analysis. To evaluate the in vivo roles of La/SSB and FSCN1, 4 × 10⁶ cells from the indicated cell lines were resuspended in a volume of 0.2 mL PBS and subcutaneously administered into the axilla to generate xenograft tumors. Tumor size was monitored at 3-day intervals, tumor volume was determined using the formula: volume = (length × width²)/2 (mm³). At the end of the experiment, mice were euthanized, and tumors were harvested, weighed, and photographed, followed by immunohistochemical (IHC) assessment.
For metastasis studies, nude mice received tail vein injections of 1 million genetically engineered cells suspended in 100 μL PBS. Eight weeks later, the mice were euthanized, and lung tissues were harvested for further analysis. Metastatic nodules were visualized under a dissecting microscope following hematoxylin and eosin (H&E) staining.
For the conditional knockout mice model, La/ssbfl/fl mice were crossed with Krt14Cre/ERT2 mice to generate La/ssbfl/fl; Krt14Cre/ERT2 offspring. All mouse strains were sourced from the Shanghai Model Organisms Center and maintained under specific pathogen-free (SPF) conditions. To establish an HNSCC model, six-week-old La/ssbwt/wt; Krt14Cre/ERT2 mice (designated as La/ssbCtrl) and La/ssbfl/fl; Krt14Cre/ERT2 mice (designated as La/ssbcKO) were administered drinking water supplemented with 4-nitroquinoline 1-oxide (4NQO, 50 μg/mL) for 16 weeks, followed by replacement with normal drinking water to allow tumor progression. For lineage tracing and conditional deletion of La/SSB, tamoxifen was delivered via intraperitoneal injection at a dose of 120 mg/kg every other day for a total of four injections to induce Cre recombinase activity. Additionally, mice received intraperitoneal injections of CDDP (5 mg/kg) or saline once per week for four consecutive weeks. Upon completion of all treatments, mice were sacrificed, and tongue tissues were harvested for downstream analyses.
Cell lines and culture conditions
HEK-293T cells were obtained from the American Type Culture Collection (ATCC; VA, USA). The TU686 HNSCC cell line was obtained from the BeNa Culture Collection (Beijing, China; catalog number BNCC359450), while TU212 (catalog number HTX2130), human normal oral keratinocytes (NOK; catalog number HTX2992) and FaDu were supplied by Otwo Biotech (Shenzhen, China). The HNSCC cell lines TU177 and LIU-LSC-1 were characterized in previous studies [20]. All cells were maintained in RPMI 1640 medium (Gibco, NY, USA) supplemented with 10% fetal bovine serum (FBS; Gibco, NY, USA) and penicillin–streptomycin (100 U/mL and 100 μg/mL, respectively; Beyotime, Jiangsu, China). Cells were cultured at 37 °C in a humidified incubator with 5% CO₂ and routinely screened for mycoplasma contamination using the MycoAlert Mycoplasma Detection Kit (Lonza, #LT07-118). Additional details regarding cell sources and culture conditions are provided in Supplementary Table S1. All cell lines were authenticated by STR profiling and routinely tested for mycoplasma contamination prior to use.
Sample collection
Human HNSCC specimens were obtained from patients treated at the First Affiliated Hospital of Anhui Medical University (Hefei, Anhui) between 2020 and 2025. Histopathological diagnoses were independently verified by a minimum of two experienced pathologists, and informed written consent was obtained from all participants before sample collection. All surgical and experimental procedures involving human tissues were performed in accordance with protocols approved by the Ethics Committee of the First Affiliated Hospital of Anhui Medical University. Detailed clinicopathological characteristics, including patient age, sex, histological grade, TNM classification, lymph node status, and local invasion, are summarized in Supplementary Tables S2 and S3. Clinical information for the patient from whom the PDO model was established is presented in Supplementary Table S4.
Antibodies and reagents
Detailed information regarding all antibodies utilized in this study is listed in Supplementary Table S5. CDDP was sourced from MedChemExpress (Monmouth Junction, NJ, USA). Puromycin and dimethyl sulfoxide (DMSO) were acquired from Sigma-Aldrich (MO, USA), whereas 4NQO was obtained from Santa Cruz Biotechnology (CA, USA).
Quantitative real-time PCR (qRT-PCR)
Total RNA was extracted using TRIzol reagent (Invitrogen, CA, USA). RNA quantity and purity were assessed with a NanoDrop 2000 spectrophotometer (Thermo Fisher Scientific). For cDNA synthesis, 1 μg of total RNA was reverse-transcribed into first-strand cDNA using the RevertAid First Strand cDNA Synthesis Kit (Thermo Fisher Scientific). qRT-PCR was performed on a LightCycler 96 system (Roche, Switzerland) using SYBR Premix Ex Taq II (TaKaRa, Kyoto, Japan) following the manufacturer’s protocols. Relative expression levels of target mRNAs were determined using the 2−ΔΔCt method, with β-actin serving as the reference gene. All primers were designed and synthesized by Sangon Biotech (Shanghai, China) and are provided in Supplementary Table S6.
H&E and IHC
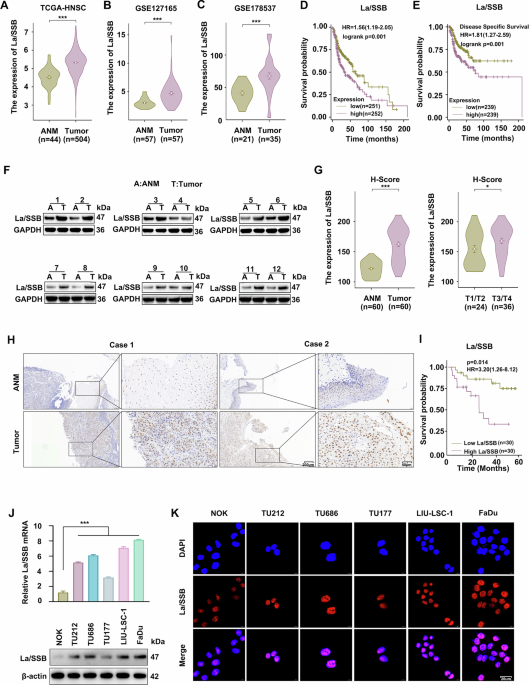
Tumor tissues from various treatment groups or organoid models were fixed in formalin, embedded in paraffin, and sectioned for histological examination. After deparaffinization and rehydration, antigen retrieval was performed, followed by incubation with 3% hydrogen peroxide for 1 h to block endogenous peroxidase activity. Sections were then incubated with 3% bovine serum albumin for 1 h and subsequently with primary antibodies at 4 °C overnight. Horseradish peroxidase-conjugated secondary antibodies were applied, and immunoreactivity was visualized using DAB substrate (Beyotime), with hematoxylin serving as a nuclear counterstain. IHC staining was semi-quantitatively evaluated using either H-scores or positive cell percentages, depending on the marker analyzed. For La/SSB, FSCN1, and TFAP2C, staining was assessed using H-scores based on staining intensity and the percentage of positively stained tumor cells. H-scores were calculated as follows: [(percentage of weak staining × 1) + (percentage of moderate staining × 2) + (percentage of strong staining × 3)], resulting in scores ranging from 0 to 300. For Ki-67 and cleaved caspase-3, staining was quantified by calculating the percentage of positively stained tumor cells using the following formula: positive cell percentage (%) = (number of positively stained tumor cells / total number of tumor cells) × 100%. For quantitative analysis of human tissue and CDX tumor samples, each individual specimen or tumor was considered one biological replicate, and three high-power fields were analyzed as technical replicates.
Western blotting
Total cellular proteins were extracted using RIPA lysis buffer (Beyotime). Protein samples were separated by 10% SDS–polyacrylamide gel electrophoresis and transferred onto polyvinylidene fluoride (PVDF) membranes (Millipore, Billerica, MA, USA). Membranes were blocked with 5% non-fat milk for 1 h and incubated overnight at 4 °C with primary antibodies (1:1000). Following washes, membranes were treated with the appropriate secondary antibodies at room temperature for 1 h. Protein signals were visualized using Pierce™ ECL Western blot Substrate (Thermo Fisher Scientific, MA, USA) and captured with a ChemiScope 6100 imaging system (Clinx, Shanghai, China).
Cell viability
HNSCC cells were seeded into 96-well plates at 1.5 × 10³ cells per well. Cell viability was assessed at 24, 48, 72, and 96 h using the Cell Counting Kit-8 (CCK-8; Topscience, Shanghai, China). After a 2-h incubation with the CCK-8 reagent at 37 °C, absorbance was recorded at 450 nm to determine the optical density (OD).
Colony formation assays
Adherent cells were harvested and counted prior to seeding. Approximately 1000 cells were plated per well in 6-cm culture dishes in triplicate and allowed to grow for 14–16 days. After incubation, the colonies were washed with PBS, fixed in 4% paraformaldehyde, and stained with 0.5% crystal violet (Beyotime, Jiangsu, China). Excess dye was gently washed away with water. Only colonies comprising more than 50 cells were counted and included in subsequent analyses.
EdU staining assays
For EdU incorporation assays, 4 × 10⁴ cells were plated in each well of 24-well plates and treated with 50 μM EdU for 2 h at 37 °C. Following fixation and permeabilization, EdU labeling was performed using the Cell-Light EdU Apollo488 Kit (RiboBio, Guangzhou, China) according to the manufacturer’s protocol. Images were acquired using an LSM880 + 225 Airyscan confocal microscope (Carl Zeiss). The proliferation rate was calculated as the proportion of EdU-positive cells relative to DAPI-stained nuclei.
Cell migration and invasion assays
Transwell assays were conducted to evaluate cell migration and invasion. For invasion experiments, the upper surface of the Transwell inserts was coated with 40 μL of Matrigel (Corning, NY, USA). A total of 2 × 10⁴ cells in 200 μL of serum-free medium were added to the upper chamber, while the lower chamber was filled with medium containing 20% FBS. After 24 h of incubation at 37 °C, cells on the lower side of the membrane were fixed with 4% paraformaldehyde, stained with 0.1% crystal violet, and quantified under a microscope.
Cell apoptosis analysis
Cell apoptosis was evaluated using the Annexin V-APC/PI Apoptosis Detection Kit (Keygen, Jiangsu, China) according to the manufacturer’s instructions. In brief, 3 × 10⁵ adherent cells were harvested with EDTA-free trypsin and washed twice with PBS. Cells were resuspended in 500 μL Binding Buffer and incubated with 5 μL Annexin V-APC and 5 μL propidium iodide (PI) in the dark for 10 min. The percentage of apoptotic cells was determined by flow cytometry (Beckman Coulter, CA, USA).
Establishment and culture of HNSCC organoids
HNSCC organoids were generated and cultured with minor modifications to previously reported protocols. Fresh HNSCC tumor specimens were washed three times with ice-cold PBS (5 min per wash) and cut into 1–3 mm³ pieces on ice. The tissue fragments were digested with trypsin (Sigma-Aldrich) for about 30 minutes under optimized conditions to preserve organoid viability. Once the suspension became turbid, it was passed through a 100-μm cell strainer and centrifuged at 200 × g for 5 min to collect cell clusters. The collected cell clusters were washed three times with PBS to remove residual enzymes and then embedded in Matrigel (Corning). After the Matrigel had solidified, HNSCC organoid culture medium (BioGenous, Jiangsu, China) was added, and cultures were maintained at 37 °C in a CO₂ incubator, with medium refreshed every 3–5 days.
For lentiviral transduction, HNSCC organoids were first dissociated into small cell clusters using a pipette. The clusters were collected by centrifugation at 200 × g for 5 min at 4 °C and resuspended in culture medium (BioGenous) containing the designated lentiviral particles. The suspension was subjected to spin infection at 700 × g for 90 min at 25 °C, followed by incubation at 37 °C for 4 h. After a brief centrifugation at 300 × g for 5 min, the cell clusters were re-embedded in Matrigel. Organoid morphology was imaged, and diameters were measured using image analysis software. Functional assays were performed using a patient-derived HNSCC organoid model established in this study. Organoids or wells represent technical replicates and not independent biological replicates.
Immunofluorescence (IF) assay
For IF studies, cells were fixed with 4% formaldehyde, permeabilized using 0.5% Triton X-100 (Sigma-Aldrich), and blocked with Immunol Staining Blocking Buffer (Beyotime). Cells were incubated overnight with primary antibodies and subsequently treated with fluorophore-conjugated secondary antibodies (Cell Signaling Technology, MA, USA) for 1 h. Finally, cells were mounted using ProLong Gold Antifade Mountant containing DAPI (Thermo Fisher Scientific) before imaging.
For multiplex IF analysis of the PDO model established in this study and orthotopic tongue tumor tissues, sections were stained with antibodies against La/SSB, Ki-67, and cleaved caspase-3. Immunoreactivity was detected using FITC- or Cy3-conjugated secondary antibodies (Cell Signaling Technology, MA, USA), followed by nuclear counterstaining with DAPI (Beyotime). To assess Ki-67 and cleaved caspase-3 expression, the percentage of marker-positive cells was calculated as follows: positive cell percentage (%) = (number of positively stained tumor cells / total number of tumor cells) × 100%. For quantitative analysis of orthotopic tongue tumor tissues, each individual tumor was considered one biological replicate, and three high-power fields were analyzed as technical replicates. For PDO fluorescence analysis, this study used a single PDO line; therefore, statistical analyses were not performed across independent donors, and n represents technical replicates within this single PDO line.
Lentivirus infection
All lentiviral constructs were purchased from GenePharma (Shanghai, China), including LV4 plasmids encoding La/SSB, FSCN1, and TFAP2C cDNAs, as well as an empty vector control. In addition, the LV-2 N lentiviral shRNA vector was employed to knock down La/SSB, FSCN1, and TFAP2C, alongside a scrambled shRNA control (shSc). Target sequences are provided in Supplementary Table S7. Lentiviral production and the establishment of stable cell lines were performed as described previously [21].
RNA sequencing (RNA-seq)
RNA-seq was performed by LC Sciences (Hangzhou, China). Briefly, total RNA was isolated from three independent biological replicates of shLa/SSB FaDu cells and their corresponding control cells. cDNA was converted to double-stranded DNA, followed by PCR amplification and 2 × 150 bp paired-end sequencing (PE150) on an Illumina Novaseq™ 6000. The resulting reads were aligned to the human reference genome (hg38) and assembled using StringTie with default parameters to generate normalized expression values (FPKM). Differential expression analysis was performed using the edgeR package in R. Raw read counts were normalized to library size using the trimmed mean of M-values (TMM) method. Common, trended, and tagwise dispersions were sequentially estimated using the edgeR pipeline, and empirical Bayes moderation was applied to shrink the dispersions toward the trended dispersion prior to differential expression testing using the exact test. Genes with adjusted P-values (FDR) < 0.05 and |log₂FC | ≥ 1 were considered significantly differentially expressed. Sequencing depth, mapping rate, and genomic distribution of mapped reads were assessed to ensure data reliability. Detailed sequencing quality control metrics, including read statistics, mapping rates, and gene body coverage, are summarized in Supplementary Table S8 (Sheets 2–5). Dispersion estimates are provided in Supplementary Table S8, Sheet 6.
Assay for transposase accessible chromatin with high-throughput sequencing (ATAC-seq)
ATAC-seq was carried out with support from Igenebook (Wuhan, China). All experiments were performed with three independent biological replicates (n = 3). Nuclei were isolated from 50,000 cells, washed, and resuspended in nuclear lysis buffer. Chromatin accessibility was assessed via transposition using Tn5 transposase, which fragments and tags open chromatin regions. The transposed DNA was purified using the Qiagen MinElute PCR Purification Kit (Qiagen, Hilden, Germany) and amplified by PCR with unique barcodes. PCR products were further cleaned to remove residual primers and adapter dimers, and library quality and concentration were checked using an Agilent Bioanalyzer. Sequencing was performed on an Illumina NovaSeq™ platform to obtain 150 bp paired-end reads. Transcription start sites (TSS) enrichment scores ranged from 8.5 to 20.5 across all samples, with consistent, sharp enrichment peaks centered at TSS, confirming the high quality of the chromatin accessibility libraries. Raw reads were subjected to strict quality control, including removal of adapters, low-quality reads, and mitochondrial reads. Clean reads were aligned to the human reference genome (hg38) using Bowtie2. Duplicated reads were marked and removed using Picard. Raw sequencing data were processed using a standard bioinformatics pipeline, including alignment, peak calling, and differential chromatin accessibility analysis. Peak calling was performed using MACS2 (v2.1.2) with parameters: –nomodel –shift -100 –extsize 200 –qvalue 0.05. Irreproducible Discovery Rate (IDR) analysis was performed between biological replicates to ensure high reproducibility, and only high-confidence peaks with IDR < 0.05 were retained for downstream analysis. The FRiP score (Fraction of Reads in Peaks) was calculated to evaluate data quality. Differential chromatin accessibility analysis between groups was conducted using the DiffBind package. For candidate gene prioritization, peaks with nominal P < 0.05 were considered for exploratory prioritization, given the limited statistical power at specific loci. ATAC-seq data met standard quality metrics, with high reproducibility across biological replicates (Supplementary Table S9, Sheets 2–4).
Reporter constructs and luciferase reporter assay
A 190-bp fragment of the human FSCN1 gene (-1339/-1139), which includes the TFAP2C-binding site, was amplified from human genomic DNA by PCR. The resulting PCR product was inserted into the pGL4.23[luc2/minP] luciferase reporter vector (Promega) using homologous recombination. The primers used for amplification are listed below: forward, 5’-TAACTGGCCGGTACCGTTCTGGGGCTCAAGGCCCT-3’; reverse, 5’-CTTGATATCCTCGAGGGCCGGGCACTGAGATAACT-3’. A mutant reporter plasmid (pFSCN1mut-Luc) was generated by altering the TFAP2C-binding site using the Q5 Site-Directed Mutagenesis Kit (NEB, MA, USA) with the following primers: forward, 5’-GGGCTAACACAGGCTCGGACCAGC-3’; reverse, 5’-CATTTAATCCCAGCCAGGGGCTTTC-3’. HEK-293T, FaDu, and TU177 cells were seeded in 24-well plates and co-transfected with 200 ng of either FSCN1wt-Luc or pFSCN1mut-Luc, 200 ng of pcDNA3.1-TFAP2C or empty pcDNA3.1 vector, and 10 ng of the internal control plasmid pRL-TK. Dual luciferase reporter assays were performed in HEK-293T, FaDu, and TU177 cells. Luciferase activity was determined using the Dual-Luciferase Reporter Assay System (Promega), and firefly luciferase signals were normalized to Renilla luciferase.
Chromatin immunoprecipitation (ChIP)
The binding of TFAP2C to the FSCN1 promoter was assessed by ChIP using a TFAP2C-specific antibody. H3K27ac ChIP-qRT-PCR was performed in parallel using the same protocol with an H3K27ac-specific antibody. ChIP assays were carried out according to the protocol provided with the SimpleChIP Plus Enzymatic Chromatin IP Kit (Cell Signaling Technology, MA, USA), with chromatin enzymatically fragmented to an average size of 200–500 bp prior to immunoprecipitation. Primers used for PCR and qRT-PCR to amplify the predicted TFAP2C-binding sites within the human FSCN1 locus are listed in Supplementary Table S10.
Bioinformatics analysis
RNA-seq data and corresponding clinical information for patients with HNSCC were obtained from The Cancer Genome Atlas (TCGA). OS analyses were initially performed using Kaplan–Meier curves and the log-rank test, with patients stratified into high- and low-expression groups according to the median expression levels of TFAP2C, La/SSB, or FSCN1. To further assess whether these genes were independently associated with patient prognosis, univariable and multivariable Cox proportional hazards regression analyses were performed. Multivariable models were adjusted for relevant clinicopathological covariates, including age, sex, clinical stage, HPV status, smoking history, alcohol history, treatment-related variables, and, where available, neck lymph node dissection status. Samples with missing values in variables included in a given model were excluded from that analysis. The proportional hazards assumption was assessed using Schoenfeld residual-based tests. Gene expression correlations were evaluated using Spearman’s correlation analysis with further stratification by HPV status, and receiver operating characteristic (ROC) curve analysis was performed to evaluate the diagnostic performance of these genes.
Statistical analysis
All statistical analyses were performed using GraphPad Prism. Differences between two groups were evaluated using an unpaired two-sided Student’s t-test, except for paired comparisons of matched samples, for which a paired two-sided Student’s t-test was used. Comparisons among more than two groups were performed using one-way analysis of variance (ANOVA), followed by appropriate post hoc tests. Survival, correlation, and ROC analyses were performed as described in the corresponding sections or figure legends. For in vitro experiments, data represent at least three independent biological replicates unless otherwise indicated. PDO data were obtained from a single PDO line. Organoids or wells represent technical replicates and not independent biological replicates. The number of animals used in in vivo experiments is specified in each figure legend. Data are presented as mean ± standard deviation (SD), and “n” denotes independent biological replicates as defined in each figure legend. A P < 0.05 was considered statistically significant. ns, not significant; *P < 0.05; **P < 0.01; ***P < 0.001, ****P < 0.0001.
