


Inhibition of stromal TRAP1 suppresses BC progression
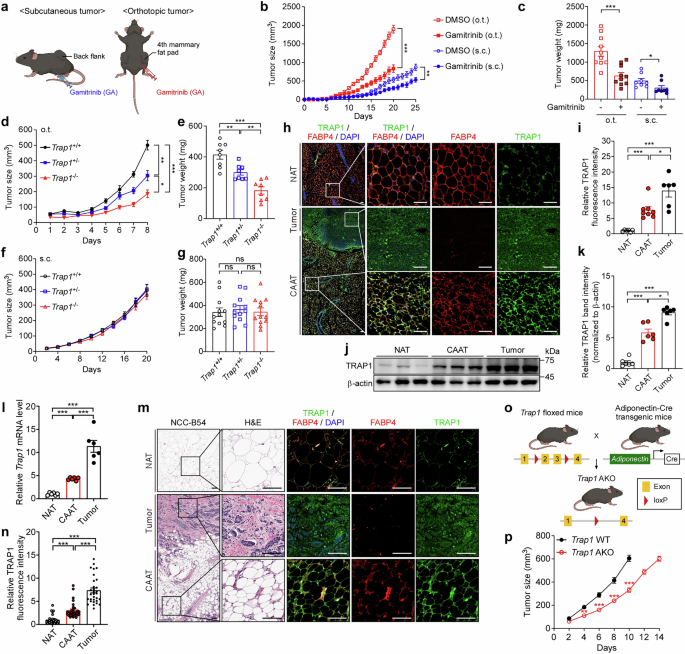
To assess the contribution of TRAP1 to BC growth, we evaluated the anticancer activity of gamitrinib, a TRAP1 inhibitor currently in a phase I clinical trial.17,28,29 We examined its efficacy in two BC models: nude mice bearing orthotopic xenografts of triple-negative BC cells derived from the human BC cell line MDA-MB-231, and mammary tumor virus-polyoma middle T-antigen (MMTV-PyMT) transgenic mice, a spontaneous BC model. Gamitrinib inhibited tumor growth significantly in both models (Supplementary Fig. 1a–h). To delineate whether these antitumor activities involved the tumor microenvironment (TME), we compared the antitumor activity of gamitrinib in orthotopic and subcutaneous allografts of EO771 mouse BC cells in syngeneic immunocompetent mice (Fig. 1a). The growth of orthotopic allografts, which include breast stroma, was faster, and gamitrinib exhibited greater inhibition in this model (51% reduction) than subcutaneous allografts (38% reduction), which lack breast stroma (Fig. 1b, c). This observation raises the intriguing possibility that TRAP1 may also exert pro-tumorigenic functions in non-cancerous cells within the BC TME.
Fig. 1
TRAP1 inhibition in adipocytes suppresses breast tumor growth. a Schematic of EO771 allograft tumor models. EO771 cells were injected subcutaneously (s.c.) into both flanks or orthotopically (o.t.) into the fourth mammary fat pad of C57BL/6 mice. When tumors reached approximately 100 mm³, mice received daily intraperitoneal injections of vehicle (DMSO) or gamitrinib (10 mg/kg). b. Tumor growth curves of s.c. and o.t. EO771 allografts (s.c., n = 8; o.t., n = 10 mice/group). c Tumor weights at the endpoint of (b). (o.t., n = 10, 10 mice/group; s.c., n = 8, 8 mice/group). d Tumor growth of o.t. EO771 allografts in Trap1 whole-body knockout (Trap1-/-) mice (n = 4 mice/group). e Tumor weights from (d) (n = 8, 4 mice/group). f Tumor growth of s.c. EO771 allografts in Trap1-/- mice (n = 6 mice/group). g Tumor weights from (f) (n = 12, 6 mice/group). h. Immunofluorescence analysis of TRAP1 in EO771 o.t. tumors. Non-tumor adipose tissue (NAT), cancer-associated adipose tissue (CAAT), and tumor tissues were stained for TRAP1 (green) and the adipocyte marker FABP4 (red) and analyzed by confocal microscopy. Nuclei were counterstained with DAPI (blue). Boxed regions indicate areas shown at higher magnification. Scale bars, 50 μm. i. Quantification of TRAP1 fluorescence intensity from (h) in FABP4-positive adipocyte areas (NAT and CAAT) and in FABP4-negative tumor regions (n = 6–8). j. Western blot analysis of TRAP1 expression. TRAP1 protein levels in NAT, CAAT (adipose tissues harvested 1–4 mm from the tumor margin), and tumor tissues were analyzed by western blotting. k. Quantification of TRAP1 band intensities in (j) was normalized to β-actin (n = 6). l Trap1 mRNA quantification in NAT, CAAT, and tumors by RT–qPCR (n = 6). m Histological and immunofluorescence analysis of TRAP1 in human breast cancer (BC) patient samples. Hematoxylin and eosin (H&E) were used to identify NAT, tumor, and CAAT regions. Boxed regions indicate areas shown at higher magnification. Immunofluorescence images show TRAP1 (green), FABP4 (red), and DAPI (blue). Scale bar, 100 μm. n Quantification of TRAP1 fluorescence intensity from (m) (n = 31). o Schematic illustration of adipocyte-specific Trap1 KO (Trap1 AKO) mouse generation by breeding Trap1 floxed (Trap1flox/flox) mice with Adiponectin-Cre (Adipoq-Cre+) mice, resulting in adipocyte-specific deletion of Trap1 exons 2 and 3. p EO771 tumor growth in Trap1 AKO mice. EO771 cells were injected o.t. into the fourth mammary fat pad of Trap1flox/floxAdipoq-Cre- (Trap1 WT) or Trap1flox/floxAdipoq-Cre+ (Trap1 AKO) mice, and tumor size was measured (Trap1 WT, n = 8 mice/group; Trap1 AKO, n = 7 mice/group). Data are expressed as the mean ± SEM. Student’s t-test, ***P < 0.001; **P < 0.01; *P < 0.05; ns, not significant
To address TRAP1 functions in stromal cells, we implanted EO771 cells either orthotopically or subcutaneously into Trap1 knockout (KO) mice. Orthotopic tumors in Trap1+/- mice showed a significant reduction in growth, which was more pronounced in Trap1-/- mice (Fig. 1d). Compared with Trap1+/+ mice (wild-type littermate controls on a C57BL/6 background), tumor weight decreased by 28% in Trap1+/- mice and 56% in Trap1-/- mice (Fig. 1e). In contrast, subcutaneous tumors, lacking breast stroma, showed slower growth than orthotopic tumors and exhibited no significant differences between wild-type and KO mice (Fig. 1f, g). These data suggest the stromal contribution of TRAP1 to breast tumor growth.
Upregulated TRAP1 in CAAs promotes BC progression
To explore which cell types may be involved in TRAP1 function, we performed histological analysis of TRAP1 expression in EO771 orthotopic tumors. TRAP1 expression was elevated in peri-tumoral tissues, particularly in adipocytes positive for fatty-acid binding protein 4 (FABP4) (Fig. 1h, i). These tissues comprise mainly CAAs, as indicated by their proximity to tumors and the presence of prominent lipid droplets, which were notably smaller than those in NAs. The peri-tumoral cancer-associated adipose tissue (CAAT) exhibited significantly higher TRAP1 protein and mRNA levels than adipose tissue (non-tumor adipose tissue, NAT) from tumor-free mammary fat pads (Fig. 1j–l). Similarly, TRAP1 was elevated in CAAT from MMTV-PyMT mice (Supplementary Fig. 1i). Furthermore, in BC specimens from 31 patients, TRAP1 expression in CAAT was 3.03-fold higher than that in NAT, regardless of disease stage or cancer subtype (Fig. 1m, n; Supplementary Fig. 1j–l).
To examine the contribution of TRAP1 in CAAs to pro-tumorigenic functions in vivo, the Trap1 gene was ablated specifically in adipocytes by crossing TRAP1-floxed mice (Trap1flox/flox)26 with transgenic mice expressing Cre recombinase under the control of the adiponectin promoter (Adipoq-Cre+) (Fig. 1o). Under tumor-free basal conditions, no significant differences were observed between adipocyte-specific Trap1 knockout (AKO; Trap1flox/floxAdipoq-Cre+) and wild-type (WT; Trap1flox/floxAdipoq-Cre-) mice in terms of body weight, major organ weights and adipose tissue masses, or adipocyte morphology (Supplementary Fig. 2a–d). Furthermore, whole-body metabolic parameters, including food intake, energy expenditure, respiratory exchange ratio (RER), locomotor activity, glucose tolerance, and insulin sensitivity, were comparable between Trap1 AKO and Trap1 WT mice (Supplementary Fig. 2e–n), indicating that Trap1 AKO mice do not exhibit metabolic abnormalities under either basal or metabolic stress conditions. However, consistent with the whole-body KO, the growth of EO771 orthotopic allografts was significantly slower in Trap1 AKO mice than in Trap1 WT mice (Fig. 1p). Importantly, tumors in Trap1 AKO mice were 51% smaller than those in Trap1 WT mice, comparable to the 56% reduction observed in whole-body Trap1 KO mice, suggesting that the stromal contribution of TRAP1 may arise largely from adipocytes. Collectively, our findings indicate that upregulated TRAP1 in adipocytes neighboring BC cells plays a critical role in driving tumor growth.
TRAP1 is required for CAA transdifferentiation in the BC TME
White adipocytes in the TME undergo cancer-induced transdifferentiation into CAAs, acquiring mitochondrial and morphological features that partially resemble brown or beige adipocytes under the influence of BC cells.12,13,14,30 Histologically, beige adipocytes contain multiple small lipid droplets, unlike white adipocytes with a single large lipid droplet in normal breast tissue.12,30 The cellular lipid droplet morphology in CAAT with upregulated TRAP1 expression resembled that of beige adipocytes in both mouse models and human BC patients (Fig. 1h, m; Supplementary Fig. 1i, j). In the EO771 orthotopic model, perilipin-1-defined lipid droplet profiling demonstrated a pronounced shift toward smaller droplets in CAATs, accompanied by a reduction in large droplets, with no corresponding change in NAT (Supplementary Fig. 3a). Consistently, canonical beige adipocyte markers were robustly upregulated in CAATs (Supplementary Fig. 3b).31
To further evaluate the role of TRAP1 in the acquisition of beige-like features, we traced this process through the expression of uncoupling protein 1 (UCP1), a well-established marker of beige and brown adipocytes.11 UCP1 levels were markedly elevated in CAAT from Trap1 WT mice but were significantly reduced in CAAT from Trap1 AKO mice (Fig. 2a–c). To corroborate the involvement of TRAP1 in cancer cell-induced adipocyte remodeling, primary white adipocytes isolated from inguinal white adipose tissue (WAT) of Trap1 WT and Trap1 AKO mice were co-cultured with EO771 or MDA-MB-231 cells using the membrane mature adipocyte aggregate culture (MAAC) system (Fig. 2d).32 Under these conditions, Trap1 WT adipocytes exhibited induction of various beige/brown-associated transcripts, including UCP1. In contrast, the acquisition of these beige-like features was markedly suppressed in Trap1 AKO adipocytes (Fig. 2e–i). These findings support a role for TRAP1 in facilitating BC cell-induced adipocyte remodeling associated with beige-like characteristics.
Fig. 2
CAA transdifferentiation triggered by cancer cells is dependent on TRAP1. a. UCP1 expression in CAAT. Left, EO771 orthotopic tumors were established in Trap1 WT or Trap1 AKO mice. NAT, CAAT, and tumor tissues were analyzed by immunohistochemistry for UCP1. Boxed regions indicate areas shown at higher magnification. Blue dashed lines indicate the tumor margin. Scale bars, 500 μm (low-magnification) and 50 μm (high- magnification). Right, quantification of UCP1 staining intensity (n = 12). b. UCP1 protein levels in CAAT. Peritumoral adipose tissues located 1–4 mm from the tumor margin were analyzed by western blotting. Top, NAT and CAAT from Trap1 WT or Trap1 AKO mice bearing EO771 orthotopic tumors. Bottom, quantification of UCP1 band intensities normalized to β-actin (n = 6). c Ucp1 mRNA levels in CAAT in vivo. Adipose tissues isolated from Trap1 WT or Trap1 AKO mice bearing EO771 orthotopic tumors were analyzed by RT–qPCR (n = 6). d Schematic representation of the co-culture system using the membrane mature adipocyte aggregate culture (MAAC) method. Primary mature adipocytes isolated from inguinal fat were placed onto the underside of the membrane. For non-tumor adipocytes (NAs), adipocytes were maintained under monoculture conditions, whereas for cancer-associated adipocytes (CAAs), BC cells were seeded in the upper chamber and co-cultured for 7 days. e Gene expression analysis of beige and brown adipocyte markers in CAAs compared with NAs. Adipocytes from Trap1 WT or Trap1 AKO mice were co-cultured with EO771 cells using the MAAC system and analyzed by RT–qPCR (n = 6). f-g. UCP1 protein levels in CAAs. Adipocytes from Trap1 WT or Trap1 AKO mice were co-cultured with EO771 (f) or MDA-MB-231 (g) cells using the MAAC system and then analyzed by western blotting. The samples used in (f) and (g) were also used in Fig. 3d, sharing the TRAP1 and β-actin blot. h-i. Ucp1 mRNA levels in CAAs. Adipocytes from Trap1 WT or Trap1 AKO mice were co-cultured with EO771 (h) or MDA-MB-231 (i) cells using the MAAC system and analyzed by RT–qPCR. Data are expressed as the mean ± SEM. Student’s t-test, ***P < 0.001; **P < 0.01; *P < 0.05; ns, not significant
To investigate whether TRAP1 is also required for the physiological beiging process of adipocytes under non-cancerous conditions, 3T3-L1 preadipocytes and isolated stromal vascular fraction (SVF) cells were differentiated into adipocytes, and rosiglitazone (Rosi), a peroxisome proliferator-activated receptor gamma (PPARγ) agonist, was added to promote adipogenesis and induce beige/brown-like characteristics, as previously described.33,34 Adipocyte differentiation increased the expression of TRAP1 and UCP1, which was further augmented upon Rosi treatment (Supplementary Fig. 4a–d). Pharmacological inhibition and genetic suppression of TRAP1 reduced UCP1 expression (Supplementary Fig. 4e–g). SVF-derived adipocytes from Trap1+/- and Trap1-/- mice displayed progressively diminished UCP1 levels compared with Trap1+/+ controls (Supplementary Fig. 4 h). Consistently, SVF-derived adipocytes from Trap1 AKO mice exhibited diminished UCP1 expression, which was restored by the re-expression of TRAP1 in Trap1-deficient SVF-derived adipocytes (Supplementary Fig. 4i). Together, these results indicate that TRAP1 is required to sustain a UCP1-positive adipocyte remodeling program, regardless of the presence or absence of tumor stimuli.
TRAP1 is required for thermogenic beiging and CAA transdifferentiation of white adipose tissue
Given that TRAP1 was required for the acquisition of beige-like features in CAAs, we further examined this in vivo by assessing whether TRAP1 is also required for cold-induced beiging under tumor-free conditions. Under cold exposure, indirect calorimetry demonstrated that food intake, RER, and locomotor activity were comparable between Trap1 WT and Trap1 AKO mice, indicating similar systemic substrate utilization and behavioral activity (Supplementary Fig. 5a–d). Notably, Trap1 AKO mice exhibited reduced energy expenditure following total body weight normalization by ANCOVA, reflecting impaired thermogenic adaptation (Supplementary Fig. 5e–g). In parallel, the transition of lipid droplet profiles toward a multilocular phenotype was attenuated in Trap1 AKO mice, accompanied by reduced UCP1 protein abundance (Supplementary Fig. 5h, i). In contrast, β-adrenergic non-shivering thermogenesis at thermoneutrality was comparable between Trap1 WT and Trap1 AKO mice, supporting preserved brown adipose tissue (BAT) thermogenic capacity in the absence of TRAP1 (Supplementary Fig. 5j). Together, these findings indicate that TRAP1 is required for adaptive WAT beiging during cold exposure.
Considering that TRAP1 regulates thermogenic beiging, we re-evaluated tumor progression and adipose phenotypes under thermoneutral conditions (30 °C), rather than at 22 °C, the standard housing temperature for laboratory mice, which imposes mild thermogenic stimulation. Under thermoneutral conditions, food intake, energy expenditure, and locomotor activity were comparable between Trap1 WT and Trap1 AKO mice in both tumor-free and tumor-bearing states, and tumor implantation reduced RER relative to tumor-free controls without divergence between Trap1 WT and Trap1 AKO mice (Supplementary Fig.6a–g).14,35 However, consistent with observations at 22 °C, UCP1 expression in CAATs and tumor growth were significantly reduced in Trap1 AKO mice relative to Trap1 WT mice at 30 °C (Supplementary Fig.6 h, i), demonstrating that TRAP1-dependent transdifferentiation within tumor-associated adipose tissue is not influenced by ambient thermogenic conditions.
Collectively, these results indicate that TRAP1 is required not only for CAA transdifferentiation but also for physiological thermogenic beiging of WAT.
TRAP1 is essential for increased mitochondrial abundance and activity in CAAs
It has been reported that beige adipocytes have more mitochondria and enhanced respiratory functions compared with white adipocytes.36,37 Thus, we examined changes in mitochondrial content and function, depending on TRAP1 function. WT CAAs showed increased membrane potential, mitochondrial abundance, and mtDNA content, whereas these features were significantly attenuated in Trap1 AKO CAAs (Fig.3a–c; Supplementary Fig.7a). Consistently, TRAP1 inhibition in 3T3-L1 cells differentiated into beige/brown-like adipocytes reduced mitochondrial membrane potential and abundance (Supplementary Fig.7b–g).
Fig. 3
TRAP1 is required to maintain mitochondrial function in CAAs. a Mitochondrial visualization and membrane potential measurement. Adipocytes from Trap1 WT or Trap1 AKO mice were co-cultured with or without EO771 cells using the MAAC system, stained with MitoTracker (green), TMRM (red), and DAPI (blue), and analyzed by confocal microscopy, as previously described.61 Scale bar, 20 μm. b-c. Quantification of TMRM (b) and MitoTracker (c) fluorescence intensities (n = 21, 38, 14, and 31) from (a). d ETC protein expression in CAAs. Adipocytes from Trap1 WT or Trap1 AKO mice were co-cultured with EO771 or MDA-MB-231 cells using the MAAC system and analyzed by western blotting. The samples used in (d) were also used in Fig. 2f and g, sharing the TRAP1 and β-actin blot. e-f. ETC mRNA expression in CAAs. Adipocytes co-cultured with EO771 (e) or MDA-MB-231 (f) cells using the MAAC system were analyzed by RT–qPCR (n = 4). g ETC protein expression in CAAs upon TRAP1 depletion. Adipocytes from Trap1 WT mice were transduced with lentiviral shControl or shTRAP1, co-cultured with EO771 or MDA-MB-231 cells using the MAAC system, and analyzed by western blotting. The samples used in (g) were also used in Fig. 5d, sharing the TRAP1 and β-actin blot. h. ETC protein expression in CAAT. Top, peritumoral adipose tissues located 1–4 mm from the tumor margin (CAAT) from Trap1 WT or Trap1 AKO mice bearing EO771 orthotopic tumors were analyzed by western blotting. Bottom, protein band intensities were quantified and normalized to β-actin (n = 6). The samples used in (h) were also used in Fig. 5e, sharing the β-actin blot. i ETC mRNA expression in CAAT. Adipose tissues isolated from Trap1 WT or Trap1 AKO mice bearing EO771 orthotopic tumors were analyzed by RT–qPCR (n = 6). j. TEM images of adipose tissues from the EO771 orthotopic tumor model. Adipose tissues from Trap1 WT or Trap1 AKO mice were analyzed by transmission electron microscopy (TEM). Representative mitochondria are indicated by black boxes and shown at higher magnification on the right. Scale bar, 1 μm. k-m. Quantification of mitochondrial ultrastructure from (j): (k, l) number of mitochondria per field and total mitochondrial area per field (n = 13, 26, 13, and 21); (m) number of cristae per mitochondrion area (n = 34, 256, 33, and 152). Data are expressed as the mean ± SEM. Student’s t-test, ***P < 0.001; *P < 0.05; ns, not significant
At the molecular level, electron transport chain (ETC) subunits, including NDUFA9 for Complex I (C-I), SDHB for Complex II (C-II), and COX IV for Complex IV (C-IV), were upregulated in Trap1 WT CAAs, but not in Trap1 AKO CAAs, despite unchanged mRNA levels (Fig. 3d–f). Genetic or pharmacologic inhibition of TRAP1 in Trap1 WT CAAs, 3T3-L1 adipocytes, and SVF-derived adipocytes similarly reduced C-I, C-II, and C-IV subunits, whereas UQCRC2 for Complex III (C-III) and ATP5B for Complex V (C-V) were marginally affected or comparatively preserved (Fig. 3g; Supplementary Fig. 7h, i). Accordingly, TRAP1 loss significantly impaired mitochondrial respiration, reducing the basal oxygen consumption rate (OCR) by 25–50% and the spare respiratory capacity (SRC) by 35–84% (Supplementary Fig. 7j–r).
Mechanistically, TRAP1 interacted strongly with the C-I, C-II, C-IV, and C-V subunits, but relatively weakly with C-III. These interactions were disrupted by the TRAP1 holdase inhibitor SB-U01517 (Supplementary Fig. 7s), as reported in cancer cells.23,38 Notably, prior studies have shown that TRAP1 does not affect C-V stability but instead inhibits its transition into the mitochondrial permeability transition pore.21,23 Restoration of TRAP1 rescued the reduced abundance of C-I, C-II, and C-IV without altering their transcript levels (Supplementary Fig. 7t, u), further in line with its proposed role as a mitochondrial chaperone.23,38 In contrast, mitochondrially encoded MT-ATP6 levels, normalized to mitochondrial protein content, as well as markers of mitochondrial fission and PINK1-Parkin-associated quality control, were unchanged between Trap1 WT and Trap1 AKO CAAs (Supplementary Fig. 7v), suggesting that ETC subunit loss in Trap1-deficient CAAs is not accompanied by overt alterations in mitochondrial dynamics or mitophagy.
To extend these findings in vivo, we examined CAAT from EO771-orthotopic tumors. In line with the co-culture results, C-I, C-II, and C-IV subunit proteins were higher in CAAT from Trap1 WT mice than in those from Trap1 AKO mice (Fig. 3h), despite indistinguishable mRNA levels between groups (Fig. 3i). Electron microscopic analysis revealed that CAAT adjacent to EO771 tumors in Trap1 WT mice exhibited a 5.3-fold increase in mitochondrial number, a 5.8-fold increase in total mitochondrial area, and a significant increase in cristae density compared with adipose tissue without tumors (NAT) (Fig. 3j–m). These mitochondrial changes were significantly reversed in Trap1 AKO mice (Fig. 3j–m). Similarly, gamitrinib-mediated TRAP1 inactivation in CAAT from MMTV-PyMT mice reduced mitochondrial abundance and cristae density more than vehicle treatment (Supplementary Fig. 8a–d).
Taken together, these results underscore TRAP1 as an essential regulator of mitochondrial integrity in CAAs, which is required for sustaining mitochondrial abundance and respiratory activity during cancer-induced adipocyte transdifferentiation.
TRAP1 is essential for adipokine secretion by CAAs
CAAs promote tumor growth by secreting various soluble factors.5,6 Accordingly, we analyzed adipokines in NAT and CAAT lysates from Trap1 WT and AKO mice bearing EO771 tumors using an antibody array (Fig. 4a). Of the 111 secretory proteins analyzed, 66 were upregulated by more than 1.2-fold in CAAT from Trap1 WT mice compared with NAT (Fig. 4b). In contrast, 86 proteins were downregulated by more than 1.2-fold in CAAT from Trap1 AKO mice compared with Trap1 WT mice, of which 57 overlapped with the 66 upregulated proteins (Fig. 4b, c; Supplementary Table 1). Notably, the 57 overlapping proteins included previously identified pro-tumorigenic adipokines such as PAI1, MMP9, MMP2, VEGF, CCL5, CCL2, HGF, IL6, TNFα, RETN, and ADIPOQ.5 Consistently, these pro-tumorigenic adipokine genes were markedly upregulated in CAAs derived from white adipocytes of Trap1 WT mice co-cultured with BC cells in the MAAC system, but were significantly downregulated in CAAs derived from Trap1 AKO mice (Fig. 4d). These data indicate that TRAP1 deficiency effectively suppresses the tumor-promoting secretory phenotype of CAAs.
Fig. 4
TRAP1 deficiency downregulates CFD expression in CAAs. a Mouse cytokine antibody array. NAT and CAAT from Trap1 WT or Trap1 AKO mice were analyzed using the Proteome Profiler Mouse XL Cytokine Array kit. The top six cytokines (ENG, SPP1, C1qR1, CFD, PCSK9, and ICAM1) are indicated by red and blue boxes. b Quantification of (a). Spot intensities were normalized to internal loading controls (at the three corners) and compared with Trap1 WT NAT. Left, eleven pro-tumorigenic adipokines are highlighted. Right, the top six cytokines are highlighted. c Venn diagrams show the number of cytokines upregulated (>1.2-fold) in Trap1 WT CAAT compared with Trap1 WT NAT, and downregulated (>1.2-fold) in Trap1 AKO CAAT compared with Trap1 WT CAAT. The specific cytokine list is provided in Supplementary Table 1. d Expression of pro-tumorigenic adipokines in CAAs. Adipocytes from Trap1 WT or Trap1 AKO mice were co-cultured with EO771 cells using the MAAC system, and mRNA levels of known pro-tumorigenic adipokines were analyzed by RT–qPCR (n = 3). e mRNA levels of the top six cytokines showing the greatest changes between groups of CAAs. Adipocytes from Trap1 WT or Trap1 AKO mice were co-cultured with EO771 cells using the MAAC system and analyzed by RT–qPCR (n = 6). f-g. CFD protein levels in CAAs. Adipocytes from Trap1 WT or Trap1 AKO mice were co-cultured with EO771 (f) or MDA-MB-231 (g) cells using the MAAC system and analyzed by western blotting. Quantification of protein band intensities was normalized to β-actin (n = 3). h Immunofluorescence analysis of CFD and TRAP1 in EO771 orthotopic tumors. Top, adipose tissues from Trap1 WT or Trap1 AKO mice were stained as indicated and analyzed by confocal microscopy. Boxed regions indicate areas shown at higher magnification. Scale bar, 50 μm. Bottom, quantification of CFD fluorescence intensity (NAT, n = 10; CAAT, n = 14). i Cfd mRNA levels in CAAT. Adipose tissues from Trap1 WT or Trap1 AKO mice bearing EO771 orthotopic tumors were analyzed by RT–qPCR (n = 8). j Immunofluorescence analysis of CFD and TRAP1 in human BC samples. Top, patient samples were immunostained as indicated and analyzed by confocal microscopy. Scale bar, 50 μm. H&E images were used to identify NAT and CAAT regions, and boxed regions were analyzed by immunofluorescence at high magnification. Scale bar, 50 μm. Bottom, quantification of CFD fluorescence intensity (n = 31). k Correlation between TRAP1 and CFD fluorescence intensity in patient samples from (j) (NAT, n = 31; CAAT, n = 31). Data are expressed as the mean ± SEM. Student’s t-test, ***P < 0.001; **P < 0.01; *P < 0.05; ns, not significant
Importantly, several TRAP1-dependent adipokines, including TNFα, IL6, and CCL2, are well-known mediators of inflammatory signaling. Consistently, macrophage infiltration was markedly reduced in tumors from Trap1 AKO mice relative to Trap1 WT tumors (Supplementary Fig. 9a). Notably, TRAP1 expression remained unchanged in bone marrow-derived macrophages (BMDMs) and primary SVF cells isolated from Trap1 AKO mice (Supplementary Fig. 9b, c). Similarly, immunohistochemical analysis revealed that TRAP1 expression within F4/80⁺ macrophages was comparable between Trap1 WT and AKO tumors (Supplementary Fig. 9d, e). These findings confirm that TRAP1 expression in immune cells remains intact in Trap1 AKO mice, suggesting that the reduced secretion of adipokines from TRAP1-deficient adipocytes contributes to the attenuation of inflammatory responses within the TME.
CFD expression is robustly regulated by TRAP1
To identify key factors that were consistently affected, we integrated secretome profiling with transcriptomic data and focused on candidates that were robustly regulated across independent datasets. Among the TRAP1-regulated adipokines, six (ENG, SPP1, C1qR1, CFD, ICAM-1, and PCSK9) were identified as the most strongly upregulated secreted proteins in CAAT from Trap1 WT mice compared with either NAT or CAAT from Trap1 AKO mice (Fig. 4a, b). Similarly, MAAC co-culture experiments further revealed that CFD, a key regulator of the alternative complement pathway,39 showed the greatest increase in mRNA levels in adipocytes derived from Trap1 WT mice, whereas its levels were reduced in adipocytes from Trap1 AKO mice (Fig. 4e). Similarly, RNA sequencing of differentiated 3T3-L1 adipocytes revealed that TRAP1 inhibition not only downregulated gene sets associated with adipocyte differentiation, but also led to the most pronounced reduction in CFD expression (Supplementary Fig. 10a–c; Supplementary Table 2). Consistent with the mRNA expression patterns, TRAP1 inactivation significantly reduced CFD protein levels in MAAC-derived CAAs as well as in transdifferentiated 3T3-L1 and SVF adipocytes (Fig. 4f, g; Supplementary Fig. 10d–g).
This reduction in CFD expression upon TRAP1 loss was further validated in vivo by immunohistochemical analysis of CAAT from Trap1 AKO mice bearing EO771 tumors. Baseline CFD expression in NAT remained comparable between Trap1 WT and Trap1 AKO mice under tumor-free conditions; however, the induction of CFD expression in CAAT was markedly suppressed in Trap1 AKO mice (Fig. 4h, i). Across multiple tissues, CFD expression was predominantly restricted to WAT and remained independent of TRAP1 status in tumor-free mice, whereas TRAP1-dependent regulation of CFD expression was confined to CAAT and specifically to adipocytes, as confirmed in primary CAAs freshly isolated from the CAAT (Supplementary Fig. 11a). Pharmacologic TRAP1 inhibition similarly decreased CFD levels in CAAT from MMTV-PyMT mice (Supplementary Fig. 11b).
To examine the clinical relevance of TRAP1 and CFD expression in CAAT, we analyzed specimens from human BC patients by immunohistochemistry. The expression of CFD was significantly higher in CAAT than in NAT, regardless of disease status and clinical BC subtype (Fig. 4j; Supplementary Fig. 11c, d). Dual immunofluorescence analysis revealed a strong positive correlation between TRAP1 and CFD expression in CAAT (Fig. 4k). These findings indicate that TRAP1 is required for maintaining the expression of adipokines, including CFD, in CAAs.
UCP1 functions as a mitochondrial protector independent of thermogenesis in CAAs
It has been shown that adipocyte transdifferentiation and subsequent cytokine secretion require mitochondrial metabolic reprogramming.40 Thus, we measured cellular ATP levels to investigate the potential energetic stress induced by TRAP1 deficiency during the transition of adipocytes into CAAs. White adipocytes co-cultured with BC cells, undergoing CAA transdifferentiation, exhibited significantly higher ATP levels than those cultured without cancer cells; however, this increase was abolished by Trap1 deletion and similarly attenuated by shRNA-mediated knockdown of TRAP1 (Fig. 5a, b). Consistently, mitochondrial membrane potential was also markedly reduced in CAAs from Trap1 AKO mice, while lactate secretion remained unaffected (Supplementary Fig. 12a, b), further underscoring the critical role of TRAP1 in mitochondrial bioenergetic regulation during CAA transdifferentiation.
Fig. 5
TRAP1 regulates PPARγ in CAAs through the AMPK-mTOR pathway. a-d. Analyses of ATP levels and protein expression in CAAs upon TRAP1 inhibition. Adipocytes derived from Trap1 WT or Trap1 AKO mice (a, c) or adipocytes transduced with lentiviral shControl or shTRAP1 (b, d) were co-cultured with MDA-MB-231 or EO771 cells using the MAAC system. Cellular ATP levels (a, b, normalized to NA; n = 3) and protein expression (c, d) were analyzed. Quantification of protein band intensities from (c) is shown (n = 3). Values were normalized as indicated. The samples used in (d) were also used in Fig. 3g, sharing the TRAP1 and β-actin blot. e TRAP1-regulated protein expression in vivo. Left, CAAT samples from EO771 orthotopic tumors were analyzed by western blotting. The samples used in (e) were also used in Fig. 3h, sharing the β-actin blot. Right, quantification of protein band intensities was normalized as indicated (n = 6). f Immunofluorescence analysis of PPARγ and p-AMPK in EO771 orthotopic tumors. Left, adipose tissues from Trap1 WT or Trap1 AKO mice were stained for PPARγ (green), p-AMPK (red), and DAPI (blue) and analyzed by confocal microscopy. Boxed regions indicate areas shown at higher magnification. Scale bars, 50 μm. Right, correlation between PPARγ and p-AMPK fluorescence intensities (Trap1 WT, n = 11; Trap1 AKO, n = 11). g Schematic illustration of TRAP1 functions in regulating CAA transdifferentiation. TRAP1 expression is upregulated during tumor-induced transdifferentiation of white adipocytes into CAAs in the BC TME compared with NAs. TRAP1 inhibition during this transition impairs mitochondrial energetics, leading to ATP depletion and subsequent AMPK activation, which in turn suppresses the mTOR-PPARγ pathway, thereby blocking adipocyte transdifferentiation and adipokine production. Data are expressed as the mean ± SEM. Student’s t-test, ***P < 0.001; **P < 0.01; *P < 0.05
Generally, UCP1 promotes thermogenesis by uncoupling oxidative phosphorylation, which typically leads to a reduction in ATP production.11 Intriguingly, however, we observed that ATP levels increased during CAA transdifferentiation despite the marked elevation of UCP1 expression. This paradox suggests that metabolic reprogramming in CAAs is fundamentally distinct from classical thermogenic beiging. Consistently, in mice exposed to cold (4 °C), NAT exhibited robust induction of p-AMPK together with strong UCP1 expression, reflecting classical thermogenic activation (Supplementary Fig. 13a). Similarly, β-adrenergic stimulation induced both UCP1 and p-AMPK (Supplementary Fig. 13b). In stark contrast, CAAT and CAAs failed to increase p-AMPK levels despite elevated UCP1 expression (Supplementary Fig. 13a, b). Furthermore, inhibition of UCP1 during CAA transdifferentiation resulted in increased ROS accumulation and reduced ATP levels (Supplementary Fig. 13c, d), suggesting that the primary function of UCP1 in CAAs is not to drive thermogenesis, but rather to preserve mitochondrial integrity by mitigating excessive mitochondrial membrane potential, thereby reducing ROS production and sustaining ATP production, as previously reported.41,42,43
TRAP1 regulates adipocyte transdifferentiation via the AMPK-mTOR-PPARγ pathway
The reduced ATP levels induced by TRAP1 deficiency activated AMPK, leading to mTORC1 inhibition, as evidenced by increased phosphorylation of AMPK (p-AMPK) and decreased phosphorylation of its downstream target, p70S6K, in CAAs (Fig. 5c, d). Consistent with previous reports identifying mTORC1 as a positive regulator of PPARγ, a key transcription factor governing adipocyte beiging,44,45 we found reduced expression of PPARγ and its downstream target genes, UCP1 and CFD (Fig. 5c, d). Similarly, TRAP1 inactivation by gamitrinib or siRNA reduced ATP levels in differentiated 3T3-L1 adipocytes (Supplementary Fig. 14a, b), triggering AMPK activation, mTORC1 inhibition, and a subsequent reduction in PPARγ (Supplementary Fig. 14c, d). Furthermore, AMPK inhibition by siRNA restored PPARγ, UCP1, and CFD expression (Supplementary Fig. 14e), confirming that the mechanism is mediated by the energy stress sensor AMPK.
Similarly, adipocytes differentiated from Trap1-deficient SVFs displayed reduced ATP levels that were restored by TRAP1 re-expression. This recovery was associated with increased cellular ATP levels, attenuation of AMPK activation, reactivation of mTOR signaling, and reinstatement of PPARγ, UCP1, and CFD expression (Supplementary Fig. 14f, g). Consistently, pharmacological inhibition of TRAP1 by gamitrinib recapitulated the effects of genetic TRAP1 deficiency but did not further exacerbate ATP depletion or AMPK activation in Trap1-deficient SVF adipocytes (Supplementary Fig. 14h, i), suggesting a TRAP1-specific mechanism of action.
We further analyzed the mTORC1–PPARγ axis in CAAs and found that pharmacologic inhibition of mTORC1 by rapamycin reduced the expression of PPARγ, UCP1, and CFD (Supplementary Fig. 14j). In parallel, activation of PPARγ by rosiglitazone enhanced UCP1 and CFD expression, whereas pharmacologic antagonism with GW9662 suppressed their expression (Supplementary Fig. 14k, l), supporting the notion that the mTORC1–PPARγ axis sustains the CAA-associated transcriptional program.
These findings were validated in vivo by assessing their expression in CAAT adjacent to EO771 tumors. The CAATs from Trap1 AKO mice exhibited significantly increased p-AMPK, reduced mTORC1-PPARγ signaling, and decreased expression of UCP1 and CFD, compared with the CAATs from Trap1 WT mice (Fig. 5e, f). Taken together, these findings substantiate that TRAP1 inactivation impairs adipocyte transdifferentiation by activating AMPK, which in turn inhibits the mTORC1-PPARγ pathway (Fig. 5g).
CAA-derived CFD promotes cancer cell survival via C3aR signaling in the TME
Complement activation in the TME, facilitated by elevated CFD, promotes the formation of C3 convertase, which mediates proteolytic processing of C3 into C3a, thereby contributing to tumor progression and drug resistance.46,47,48 Consistently, in plasma from EO771 orthotopic tumor–bearing mice, the levels of CFD and its cleavage product Bb increased by 1.3- and 4.6-fold, respectively, accompanied by a marked elevation of C3a (12.9-fold). In contrast, these increases were significantly attenuated in Trap1 AKO mice (Supplementary Fig. 15a–c). Notably, C4d, a marker specifically associated with the classical and lectin pathways, remained unchanged (Supplementary Fig. 15d). Similarly, gamitrinib treatment in MMTV-PyMT mice reduced circulating CFD, Bb, and C3a levels without altering C4d, collectively supporting the selective activation of the alternative complement pathway rather than the classical or lectin pathways (Supplementary Fig. 15e–h).
C3a activates the downstream effectors AKT and ERK through its receptor C3aR,49 and C3a stimulation concurrently enhances C3aR expression in cancer cells.50,51 BC cells co-cultured with Trap1 AKO adipocytes in vitro exhibited lower C3aR levels and reduced phosphorylation (activation) of AKT and ERK than those co-cultured with Trap1 WT adipocytes (Supplementary Fig. 15i). To determine the importance of adipocyte-derived secretory factors in modulating BC cell signaling, conditioned media were prepared from Trap1 WT or Trap1 AKO adipocytes stimulated by BC cells (AdipoWT-CM and AdipoAKO-CM, respectively). Only AdipoWT-CM significantly increased C3aR, p-AKT, and p-ERK expression in BC cells, whereas AdipoAKO-CM failed to elicit these effects (Supplementary Fig. 15j). Similarly, in tumor tissues collected from EO771 orthotopic Trap1 AKO mice and gamitrinib-treated MMTV-PyMT mice, both C3aR expression and activation of AKT and ERK were reduced significantly (Supplementary Fig. 15k, l). Consistently, subcutaneous xenografts from MDA-MB-231 cells co-injected with shTRAP1 3T3-L1 adipocytes exhibited a significant reduction in tumor growth, along with decreased expression of C3aR, p-AKT, and p-ERK (Supplementary Fig. 15m–o). Notably, while adipocyte differentiation was reduced by 47% following TRAP1 silencing, tumor growth declined much more substantially, by nearly 86%. Collectively, these findings indicate that TRAP1 inhibition in CAAs suppresses C3a-mediated activation of AKT and ERK signaling in BC cells across both immunocompetent allograft and immunodeficient xenograft models.
To isolate the effects of CFD from other adipocyte-derived signals, we overexpressed CFD in BC cells or treated them with recombinant CFD. These manipulations increased C3aR, p-AKT, and p-ERK expression (Supplementary Fig. 16a, b) and promoted cell proliferation (Supplementary Fig. 16c, d). However, the catalytically inactive CFD mutant failed to elicit these effects (Supplementary Fig. 16a–d).52 Similarly, the effect of AdipoWT-CM was inhibited by the CFD protease inhibitor danicopan (Supplementary Fig. 16e–h). Consistent with this, the proliferative response elicited by recombinant or overexpressed CFD was abrogated by pharmacologic inhibition of ERK (temuterkib) or AKT (capivasertib), indicating that ERK and AKT signaling function downstream of the CFD-C3a-C3aR axis to promote tumor cell proliferation (Supplementary Fig. 16i, j). Together, these findings suggest that the proteolytic activity of CFD plays a crucial role in promoting tumor progression among adipokines secreted by CAAs.
In BC patient specimens, CFD expression in adipocytes correlated positively with C3aR expression in cancer cells (R2 = 0.6136, P < 0.001; Supplementary Fig. 16k, l). Furthermore, TCGA data analysis using cBioPortal revealed that high C3aR levels in BC patients were associated with poor survival outcomes (Supplementary Fig. 16m). Collectively, these findings suggest that CFD is a key adipokine secreted by CAAs within the TME, promoting BC progression.
TRAP1 inhibition reduces chemoresistance in BC cells by suppressing adipokine expression in CAAs
Adipocytes in the TME have been reported to promote chemoresistance in cancer cells.5,51 Consistently, AdipoWT-CM rendered MDA-MB-231 and EO771 cells more resistant to both cisplatin and paclitaxel, whereas AdipoAKO-CM was significantly less effective (Supplementary Fig. 17a–d). In the orthotopic EO771 allograft model, cisplatin treatment in Trap1 WT mice resulted only in a slowing of tumor growth, whereas the same regimen in Trap1 AKO mice induced clear tumor regression (Fig. 6a, b). Consistent with this differential response, TUNEL assays revealed substantially increased tumor cell death in cisplatin-treated tumors from Trap1 AKO mice compared with Trap1 WT mice (Fig. 6c), highlighting the essential role of TRAP1 in CAAs in conferring chemoresistance in BC.
Fig. 6
TRAP1 inhibition enhances chemosensitivity in BC in vivo by modulating adipokine expression in CAAs. a Tumor growth in Trap1 AKO mice treated with cisplatin. Trap1 WT and Trap1 AKO mice bearing EO771 orthotopic tumors were treated intraperitoneally with vehicle (DMSO) or cisplatin (10 mg/kg daily) when tumors reached ~100 mm3 (n = 4 mice/group). b Tumor weights from (a) (n = 8, n = 4 mice/group). Fold change relative to baseline tumor size is shown on the right y-axis. c TUNEL assay. Left, tumors from (a) were subjected to TUNEL (green) and DAPI (blue) staining and analyzed by confocal microscopy. Scale bar, 20 μm. Right, quantification of TUNEL-positive cells per field (n = 6). d, e CFD-induced cisplatin resistance in BC cells. Left, MDA-MB-231 cells treated with wild-type recombinant human CFD (rhCFDWT) or its catalytically inactive mutant (rhCFDCI) and EO771 cells overexpressing wild-type (mCFDWT) or catalytically inactive mouse CFD (mCFDCI) were exposed to cisplatin (40 μM and 20 μM, respectively), stained with Annexin V and propidium iodide (PI), and analyzed by flow cytometry. Right, quantification of early (black) and late (red) apoptotic cells (n = 3). f-g. Expression of BCL-2 family proteins and cleaved caspase-3. MDA-MB-231 (f) cells treated with rhCFD and EO771 (g) cells overexpressing mCFD were treated with cisplatin (40 μM and 20 μM, respectively) and analyzed by western blotting. WT wild type, CI catalytically inactive. h–i mRNA expression of BCL-2 family genes. Cells from (f, g) were analyzed by RT–qPCR (n = 3). j In vivo effect of CFD on chemoresistance. Trap1 AKO mice bearing EO771 tumors with or without mCFDWT overexpression were treated intraperitoneally with vehicle (DMSO) or cisplatin (10 mg/kg daily) when tumors reached ~100 mm3 (n = 5 mice/group). k Tumor weights from (j) (n = 10, n = 5 mice/group). Fold change relative to baseline tumor size is shown on the right y-axis. l TUNEL assay. Left, tumors from (k) were subjected to TUNEL (green) and DAPI (blue) staining and analyzed by confocal microscopy. Scale bar, 20 μm. Right, quantification of TUNEL-positive cells per field (n = 6). m Combined treatment with SB-U015 and cisplatin or paclitaxel. C57BL/6 mice bearing EO771 tumors were injected intraperitoneally with cisplatin (5 mg/kg) or paclitaxel (5 mg/kg), followed by oral administration of SB-U015 (50 mg/kg daily) when tumors reached ~100 mm³ (n = 5–7 mice/group). n Tumor weights from (m) (n = 10–14). Fold change relative to baseline tumor size is shown on the right y-axis. o. TUNEL assay. Left, tumors from (m) were subjected to TUNEL (green) and DAPI (blue) staining and analyzed by confocal microscopy. Scale bar, 20 μm. Right, quantification of TUNEL-positive cells per field (n = 8). Data are expressed as the mean ± SEM. Student’s t-test, ***P < 0.001; **P < 0.01; *P < 0.05; ns, not significant
Among the factors secreted by CAAs, CFD was examined to evaluate its contribution to chemotherapy resistance. Recombinant CFD and overexpression of CFD conferred resistance to cisplatin and paclitaxel, which was reversed by the catalytically inactive form of CFD (Fig. 6d, e; Supplementary Fig. 17e, f). Similarly, danicopan significantly blocked the chemoresistance induced by AdipoWT-CM (Supplementary Fig. 17g–j). The BCL-2/BAX ratio was found to increase, and caspase activation was suppressed in BC cells by CFD overexpression or exogenous CFD treatment (Fig. 6f–i; Supplementary Fig. 17k–n), consistent with previous reports that AKT and ERK signaling mitigates apoptotic cell death by modulating BCL-2 family proteins.53 In line with this, both recombinant CFD treatment and enforced CFD expression enhanced resistance to cisplatin or paclitaxel, whereas ERK or AKT inhibition reinstated apoptotic sensitivity (Supplementary Fig. 17o–r), supporting ERK and AKT signaling as functional mediators of CFD-driven chemoresistance.
To further investigate the role of CFD in BC cell chemoresistance in vivo, we established orthotopic allografts in Trap1 AKO mice using EO771 cells overexpressing CFD. Enforced CFD expression restored tumor growth in Trap1 AKO mice and markedly attenuated the therapeutic response to cisplatin (Fig. 6j, k). Consistently, CFD expression reduced cisplatin-induced apoptosis in vivo (Fig. 6l).
Taken together, these findings demonstrate that TRAP1 in adipocytes plays a pivotal role in driving chemoresistance in BC cells by promoting the secretion of pro-tumorigenic adipokines such as CFD, which activate pro-survival signaling pathways.
Pharmacological targeting of TRAP1 sensitizes BC cells to chemotherapy in vivo
In vitro experiments using cancer cells alone showed no synergistic effect when the TRAP1 inhibitor gamitrinib was combined with cisplatin (combination index (CI) ≈ 1, indicative of an additive effect; Supplementary Table 3). In contrast, in the in vivo EO771 allograft model, combined administration of cisplatin and gamitrinib exhibited a substantially greater suppression of tumor growth than either monotherapy, reducing tumor weight by 76% compared with 29% and 35% reductions achieved by cisplatin or gamitrinib, respectively (Supplementary Fig. 18a, b). Consistently, TUNEL-positive cancer cells were substantially increased in the combination group, showing 3.2- and 3.9-fold higher levels than those in the cisplatin-alone and gamitrinib-alone groups, respectively (Supplementary Fig. 18c). These findings indicate that pharmacological TRAP1 inhibition significantly potentiates the antitumor efficacy of cisplatin, largely through suppression of the pro-tumorigenic functions of CAAs.
Among TRAP1 inhibitors, SB-U015, a client-mimic and orally available allosteric inhibitor, is the most potent in inactivating TRAP1 across several disease models,26,38 without noticeable toxicity (Supplementary Fig. 18d, e; Supplementary Tables 4, 5). Consistently, SB-U015 exerted greater cytotoxicity in BC cells, impaired CAA-derived pro-tumorigenic cytokine production, and reduced CFD expression more effectively than gamitrinib (Supplementary Fig. 18f–i). Oral administration of SB-U015 substantially enhanced the anticancer effects of cisplatin and paclitaxel, leading to greater tumor growth suppression and increased cancer cell death in vivo (Fig. 6m–o), without weight loss or histologic abnormalities (Supplementary Fig. 18j, k). Additionally, SB-U015 efficiently reduced plasma CFD to near-normal levels (approximately 3.2 μg/ml) in EO771 orthotopic tumor-bearing mice (Supplementary Fig. 18l), regardless of cisplatin or paclitaxel treatment, indicating that TRAP1 inhibitors are also able to suppress adipokine secretion by CAAs within the TME. Collectively, these data suggest that TRAP1 inhibitors represent a promising strategy to overcome chemoresistance and enhance therapeutic efficacy by targeting the tumor-supportive TME.
