


Plasma sample collection
Venous blood was collected in citrate monovettes (Sarstedt) from head and neck cancer patients (HNC, N = 50) as well as recovered patients (no evident disease, NED, N = 20) and healthy donors (HD, N = 22) at the Department of Otorhinolaryngology, Head and Neck Surgery of the University Hospital Mannheim from 2019 until 2023. The overall study sample size was determined by sample availability. Detailed information on clinicopathological characteristics is provided in Supplementary Table 1. Participant consent was obtained before study inclusion, and the Ethics Committee II of the University of Heidelberg (2021-552 and 2019-697 N) approved the study. For plasma separation, the blood samples were centrifuged at 2000 × g for 10 min at room temperature (RT), aliquoted, and stored at −80 °C.
sEV isolation
To isolate sEVs from patient plasma, size-exclusion chromatography (SEC) was performed as described previously [18]. Briefly, plasma samples were centrifuged at 2000 × g for 10 min at RT, followed by another centrifugation step at 14,000 × g for 30 min at 4 °C. Subsequently, the plasma was filtered through a 0.22 µm filter (Merck). SEC columns were self-made using 10 mL of cross-linked Sepharose CL-2B (Cytiva) and Econo-Pac columns (Bio-Rad). Next, 1 mL of pre-cleared plasma was applied onto the column bed, and the fourth fraction (1 mL) of PBS eluate was collected.
Physical characterisation of sEVs
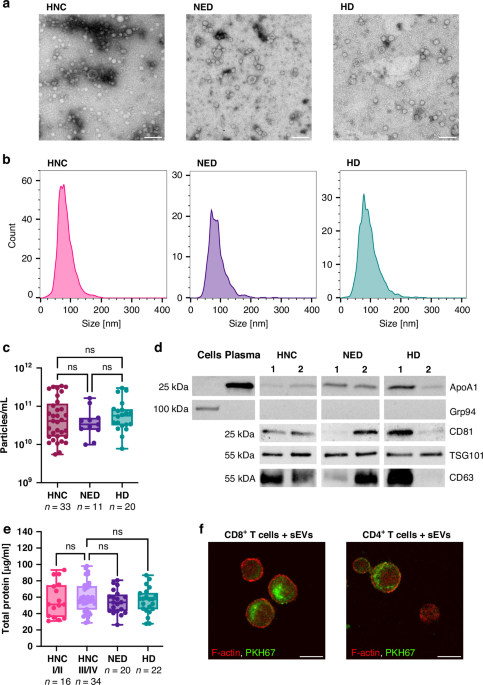
Transmission electron microscopy (TEM) of sEVs from two HNC patients, one NED and two HDs was performed at the Electron Microscopy Core Facility of Heidelberg University. Briefly, carbon-coated formvar grids were placed on a 20 μL drop of the freshly isolated undiluted sEV fractions. Briefly, after adsorption to the grid, the samples were washed and stained with 3% w/v aqueous uranyl acetate. Micrographs were recorded using a JEM1400 transmission electron microscope (JEOL Ltd, Tokyo, Japan) with a bottom-mounted 4K CMOS camera (TemCam F416; TVIPS GmbH, Gliching, Germany).
Nanoparticle tracking analysis (NTA) was performed on ZetaView® TWIN (Particle Metrix GmbH, Inning am Ammersee, Germany) to determine the size distribution and concentration of the isolated particles at the Department of Urology and Urosurgery of the University Hospital Mannheim. Freshly isolated plasma sEV samples from HNC patients (n = 33), NEDs (n = 11) and HDs (n = 20) were diluted and measured at eleven positions with two cycles at RT. Analysis parameters were set as follows: Max Area 1000, Min Area 10, Min Brightness 30, Sensitivity 80% and Shutter 100. The concentration and size ranges were calculated by ZetaView Software (8.05.11 SP4, Particle Metrix).
Protein analysis of sEVs
To examine the total protein amount of each plasma sEV sample, BCA protein assays (Thermo Scientific) were performed according to the manufacturer’s instructions. After 30 min at 37 °C, the absorbance was measured with a Tecan Infinite 200 Pro plate reader (Tecan Group Ltd, Männedorf, Switzerland).
To characterise the protein content of plasma sEV samples from HNC patients (n = 3), NEDs (n = 2–3) and HDs (n = 2–3), western blots were performed. Samples (10 μg) in non-reducing (for CD63 and CD81) or reducing sample buffer (Thermo Scientific) were separated on 4–20% polyacrylamide gels (Bio-Rad) and transferred onto nitrocellulose membranes (Bio-Rad). As controls pure plasma (10 μg) and PBMC lysates (10 μg) prepared with RIPA buffer were used. After blocking, the membrane was incubated with the following primary antibodies at 4 °C overnight: anti-CD63 (1:250, Invitrogen), anti-CD81 (1:250, Invitrogen), anti-TSG101 (1:500, Invitrogen), anti-Grp94 (1:1000 in 5% BSA in PBS, CST), and anti-ApoA1 (1:1000, CST). After washing, HRP-conjugated secondary antibodies (IgG Rabbit anti-Mouse, 1:10,000 or IgG Goat anti-Rabbit, 1:10,000, Thermo Scientific) were added and incubated for 1 h at RT. The chemiluminescence signal was elicited by SuperSignal™ West Dura™ Chemiluminescence Substrate (Thermo Scientific). Images were acquired with the iBright™ FL1000 imager (Thermo Fisher Scientific, Waltham, USA).
Immune cell culture
CD8+ Jurkat T cells were cultured in RPMI 1640 (Gibco) containing 10% FBS (Gibco) and 1% PenStrep (Sigma-Aldrich). Cells were seeded at a density of 1.5 × 10⁶ cells/mL and medium was added or changed every 2–3 days. For functional assays, EV-depleted FBS (Gibco) was used.
Primary T cells were isolated from chilled buffy coats obtained from day-before donations of the German Red Cross Blood Donation Service Baden-Württemberg-Hessen via density gradient centrifugation using Ficoll-Paque™ (Cytiva). To isolate CD4+ and CD8+ T cells, negative isolation kits (Miltenyi) were used according to the manufacturer’s instructions. Purity (≥95%) was checked at FlowCore Mannheim by staining with anti-CD4-APC (1:100) or anti-CD8-PE (1:100) antibodies from BioLegend for 30 min at 4 °C, followed by detection using the BD FACS Canto II. To activate the T cells, IL-2 (Peprotech; final concentration 150 U/mL) and CD3/CD28 T cell activator complex (Stemcell; 25 μL/mL) were added.
For functional assays, typically CD4+ or CD8+ T cells were incubated with 50 μL freshly isolated plasma sEVs derived from 6 to 10 different blood donors, e.g. 2–3 HNC patients, 2–3 NEDs and 2–3 HDs. PBS was always included as a control. Each independent experiment was performed with primary T cells isolated from different healthy donors.
Confocal microscopy
Mixed HNC sEVs were fluorescently labelled with 2 µM PKH67 (Sigma-Aldrich) for 5 min at RT. To eliminate excess dye, Invitrogen™ Exosome Spin Columns (MW 3000) were used according to the manufacturer’s instructions. Clean sEVs were subsequently incubated with recipient T cells for 18 h. As a negative control, PBS was used. After incubation, cells were washed and fixed with 4% PFA for 20 min at RT. T cells were cytospinned onto silanated glass slides at 750 rpm for 5 min and dried. Cells were permeabilized with 0.1% Triton X-100 (Sigma-Aldrich) for 3 min, followed by the addition of Phalloidin-iFluor647 (1:500, Abcam) for 1 h at RT. Images were acquired at a Leica SP5 MP (Leica Microsystems, Wetzlar, Germany) confocal microscope at LIMa Mannheim. This experiment was replicated twice.
CD69 activation assay
CD69 serves as an established marker of early T-cell activation and is rapidly upregulated on the surface of stimulated T cells. Primary CD4+ T cells were activated overnight as described above (CD3/CD28, IL-2). Afterward, 50 µL plasma sEVs from HNC patients (n = 11), NEDs (n = 9) and HDs (n = 6) were added to the cells and incubated for another 16 h. The cells were stained with anti-CD69-APC antibodies (BioLegend) for 30 min at 4 °C and measured at the BD FACSCanto II (BD Biosciences, San Jose, USA) and analysed with FlowJo (version 10.10.0). This experiment was replicated four times.
Proliferation analysis
To analyse the effect of sEVs on the proliferation of CD8+ and CD4+ T cells, CFSE proliferation assays (Invitrogen) were performed. Primary CD8+ or CD4+ T cells (106 cells/mL) were stained with 1.5 µM CFSE in 0.1% BSA in PBS for 10 min at 37 °C. T cells were activated (CD3/CD28, IL-2) and cultured overnight in 96-well plates (100,000 cells/well) in AIM-V medium, which improved primary cell growth compared to RPMI 1640 medium. CD4+ T cells were incubated for 4 days with 50 µL of sEVs from HNC patients (n = 31), NEDs (n = 12), and HDs (n = 17), or with PBS as a control. This experiment was performed more than 10 times. For some experiments, cells were pre-treated with or without 5 µg/mL anti-PD-1 antibodies (pembrolizumab) for 1 h before addition of HNC sEVs (n = 14). CD8+ T cells were also incubated for 4 days with 50 µL of sEVs from HNC patients (n = 16), NEDs (n = 9), and HDs (n = 8), or with PBS as a control. After incubation, cells were stained with SYTOX™ Red (1:4000, Invitrogen) and analysed with a BD FACS Canto II (BD Biosciences, San Jose, USA) and FlowJo (version 10.10.0). The proliferation index was calculated by dividing the total number of divisions by the cells that went into division.
TNF-α and IFN-γ ELISAs
Upon activation T cells produce various cytokines. Secreted pro-inflammatory tumour necrosis factor α (TNF-α) and interferon γ (IFN-γ) in the culture medium were measured using ELISA kits (Invitrogen). CD4+ and CD8+ T cells were activated (CD3/CD28; IL2) and incubated with sEVs from HNC patients, NEDs, or HDs, depending on the assay. After co-incubation for 16–20 h supernatants were collected, centrifuged, and stored at 20 °C. Samples were diluted at least 1:1 in assay buffer and incubated with the pre-coated plates overnight. The assays were performed according to the manufacturer’s instructions, and absorbance was measured with the Tecan Infinite 200 Pro plate reader (Tecan Group Ltd, Männedorf, Switzerland) at 450 nm. Exact sample numbers varied between assays and are therefore indicated in the corresponding figures.
Analysis of ATP metabolism
The metabolism of ATP to ADP, AMP, and adenosine by CD4+ T cells was analysed by HPLC-FL by Edwin K Jackson at the University of Pittsburgh, PA, USA. For this purpose, activated (CD3/CD28, IL-2) CD4+ T cells (50,000 cells/well) were seeded in 96-well plates in AIM-V. The next day, cells were incubated with 50 µl (4–5 µg) sEVs from HNC patients (n = 11), NEDs (n = 5) and HDs (n = 6) for 24 h. Before the addition of HNC sEVs, cells were pre-treated with or without 5 µg/mL anti-PD-1 antibodies (pembrolizumab) for 1 h. On the next day, cells were washed with PBS to remove sEVs and incubated with 20 µM N6-etheno-ATP (ε-ATP, BioLog) or N6-etheno-AMP (ε-AMP, BioLog) in PBS for 2 h and 4 h (CD4+ T cells). The supernatant was collected and centrifuged at 6000 × g for 2 min, boiled for 2 min at 95 °C, and stored at −20 °C. This experiment was performed 4 times. The ATP metabolites N6-etheno-ATP, N6-etheno-ADP, N6-etheno-AMP, and N6-etheno-adenosine were quantified as described before [19], using an Agilent Technologies 1100 series HPLC chromatograph (Agilent Technologies, Santa Clara, USA) with an Agilent 1260 Infinity fluorescence detector (G1321B). The samples were diluted 4 times with buffer A (0.2 M KH2PO4), and 6 μL were injected into a C-18 reverse phase column (Agilent Eclipse Plus C18, 5 μm, 4.6 × 250 mm).
Apoptosis analysis
Induction of apoptosis in CD8+ T cells was analysed with Annexin V apoptosis assays (eBioscience). CD8+ Jurkat were seeded in 96-well plates (100,000 cells/well) in AIMV medium (Gibco). After 24 h, cells were incubated with 50 µL sEVs from HNC patients (n = 30), NEDs (n = 11) and HDs (n = 15) for 24 h. This experiment was performed more than 10 times. For some experiments, cells were pre-treated with or without 5 µg/mL anti-PD-1 antibodies (pembrolizumab) for 1 h before addition of HNC sEVs (n = 7). As an Annexin V binding control, dead cells were used, which were boiled for 2 min in a 90 °C water bath. The cells were stained with Annexin V-FITC/-APC (1:100) for 15 min at RT, and afterwards, propidium iodide staining solution (1:200) was added. Cells were analysed with a BD FACS Canto II (BD Biosciences, San Jose, USA) and FlowJo (version 10.10.0).
Expression of immune checkpoint receptors
Changes of immune checkpoint (IC) expression levels, as well as ectonucleotidases CD39 and CD73, were detected on CD8+ and CD4+ primary T cells by flow cytometry after sEV co-incubation. Additionally, the effect of IC inhibitors was examined by treatment with pembrolizumab (Merck/MSD). Primary T cells were seeded at a density of 106 cells/mL in 96-well plates and activated as described above (CD3/CD28, IL-2). The next day, 50 µL plasma sEVs from HNC patients (n ≥ 9), NEDs (n ≥ 4) and HDs (n ≥ 5) were added to the cells and incubated for another 24 h. For some experiments, cells were pre-treated with or without 5 µg/mL anti-PD-1 antibodies (pembrolizumab) for 1 h before addition of HNC sEVs. This experiment was performed more than 4 times. Afterwards, T cells were blocked with FcR-blocking reagent (Miltenyi) followed by staining with antibody and corresponding isotype cocktails (Supplementary Table 2) for 30 min at 4 °C. Then, cells were analysed with a BD FACSCanto II (BD Biosciences, San Jose, USA) and FlowJo (version 10.10.0). Median fluorescence intensity (MFI) values were baseline-corrected using controls and normalised to PBS-treated samples to minimise batch effects. The number of samples analysed for each IC varied because of the two distinct antibody panels, panel optimisations and technical constraints. Exact sample sizes are shown in Supplementary Figs. 5 and 6.
Gene expression analysis
To analyse gene expression of T cells after sEV co-incubation, mRNA was analysed with the NanoString technology using the Human PanCancer Immune Profiling Panel for the nCounter instrument (NanoString Technologies, Bothell, USA). To obtain a high purity of isolated cells, primary CD4+ and CD8+ T cells were sorted using a BD FACSAria IIu. Therefore, cells were stained with anti-CD4-APC, anti-CD8-PE, and anti-CD3-FITC antibodies (BioLegend) for 30 min at 4 °C. Sorted cells were activated (CD3/CD28, IL-2) and seeded in AIM-V. After 24 h, plasma sEVs from HNC patients (n = 8), and HDs (n = 4) were added to the cells and incubated for another 24 h. Before the addition of HNC sEVs, cells were pre-treated with or without 5 µg/mL anti-PD-1 antibodies (pembrolizumab) for 1 h. Finally, T cells were harvested, and total RNA was isolated using the eRNA Micro Kit (Bioline) according to the manufacturer’s instructions. RNA sample quality was assessed using the NanoDrop™ spectrophotometer or Qubit™ fluorometer (Thermo Fisher Scientific, Waltham, USA). For mRNA analysis, 25 ng of total RNA was used. Data were analysed with the nSolver™ Analysis Software and normalised to stably expressed housekeeping genes identified using the NormFinder algorithm [20]. The panel contains a total of 40 housekeeping genes and 6 positive controls. Since no outliers were detected in NormFinder, all 40 housekeeping genes of the panel were used for normalisation of mRNA content in the nSolver software. The positive controls included in the Human PanCancer Immune Profiling Panel were used for lane-to-lane and cartridge-to-cartridge normalisation. mRNAs with overall counts below the threshold (calculated as the geometric mean of negative controls plus two standard deviations) were excluded. For statistical analysis, multiple Mann-Whitney U tests were performed. The volcano plots were generated using the log2 expression ratio of each mRNA and the negative log10 of the p-value. Because of feasibility, this experiment was performed once.
Statistics
For graphical presentation and statistical analysis, GraphPad Prism (9.4.1) was used. Normally distributed data was analysed using two-sided t-tests (two groups) or ANOVA (multiple groups). For comparisons involving normally distributed groups with unequal variances, statistical methods that do not assume homogeneity of variance, such as Welch’s t-test or Welch’s ANOVA were used. Non-normally distributed data were analysed with two-sided Mann-Whitney U-tests (two groups) or Kruskal-Wallis tests (multiple groups). For significant test results, post hoc tests have been conducted for pairwise comparisons. In case of small sample sizes, p-values have not been corrected for multiple testing (i.e. Bonferroni correction) as part of an exploratory study. In cases where the PBS control exhibited high variability, the data were normalised to the PBS condition prior to statistical analysis. Following normalisation, one-sample t-tests or Wilcoxon tests were performed to assess whether the observed values significantly differed from the normalised control reference. Quantitative data is presented as box plots displaying the median, interquartile range (25th–75th percentile), and minimum and maximum values (whiskers), or as bar graphs representing the mean ± standard deviation (SD) unless stated otherwise. These graphs show individual data points, with each dot representing one patient (biological replicate). A result was considered statistically significant for p < 0.05.
