


Culture of MCF10A cell line
MCF10A cells (#CRL-10317, ATCC, United States) were cultured in DMEM/F12 medium (#11330, Gibco, Thermo Fisher ScientificFootnote 1), enriched with 5% (v/v) horse serum (#16050122, Gibco), 20 ng/mL EGF (#PHG0311, Thermo Fisher Scientific), 250 ng/mL hydrocortisone (#H-0888, Sigma), 100 ng/mL cholera toxin (#C8052, Sigma), and 10 μg/mL human insulin (#I9278, Sigma), and incubated at 37 °C in a 5% CO2 atmosphere. Several MCF10A lots were evaluated for this study as a difference in colony formation efficiency was observed between lots (Table 1). The cells were cultured for at least four weeks after thawing before starting the experiments to ensure assay consistency (Supplementary Fig. S2A).
Electroporation of MCF10A cells with the ribonucleoprotein (RNP) complex
A 44 μM cr:trRNA working solution was prepared by combining 100 μM stock solutions of crRNA (custom, sequence in Table 2) and trRNA (#1072534) with nuclease-free duplex buffer (all Integrated DNA Technologies (IDT)) and heating at 95 °C for 5 min. Alt-R Streptococcus pyogenes Cas9 (#1081058, IDT) was diluted to 36 µM with buffer R of the Neon transfection system (#MPK1096 (kit), MPK5000 (transfection system), Thermo Fisher Scientific) and mixed with the cr:trRNA working solution to a final ribonucleoprotein complex (RNP) concentration of 18 µM (contains 18 µM Cas9 and 22 µM of the cr:trRNA duplex).
Table 1 Different MCF10A lots evaluated for this study.Table 2 CRISPR/Cas9 target sequence used in this study.
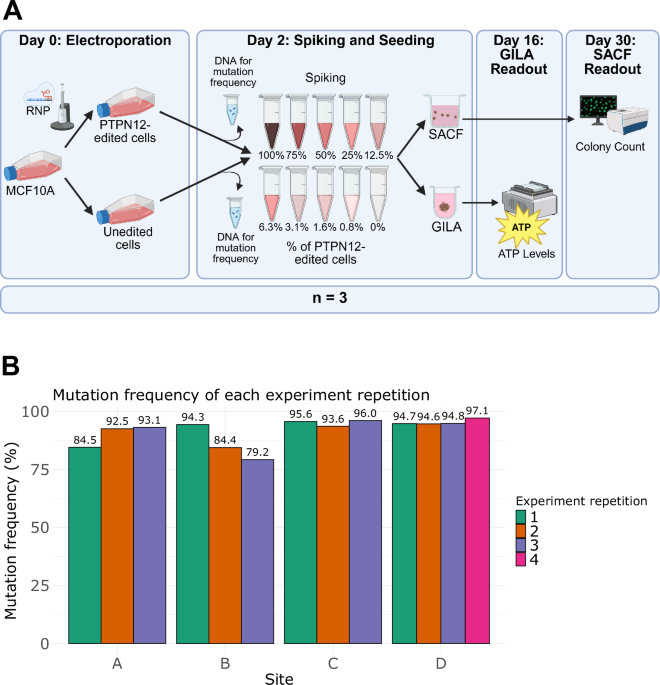
A total of 600,000 MCF10A cells in logarithmic growth phase were resuspended in buffer R. Electroporation was performed in batches of 150,000 cells, with each batch mixed with 9.5 pmol of the RNP complex. The electroporation was carried out with the Neon transfection system using 10-μL tips and applying a single pulse of 1700 V and a pulse width of 20 ms. Electroporated cells were pooled into 6 mL of MCF10A culture medium and evenly distributed across two wells of a 6-well plate. The cells were cultured for 48 h prior to proceeding with SACF, GILA, and cleavage analyses.
Spiking of PTPN12-edited with untreated MCF10A cells
48 h post electroporation, PTPN12-edited and untreated MCF10A cells were detached and resuspended in culture medium to 100,000 cells/mL, preparing 4 mL in total for edited cells and 10 mL for untreated cells. The cells were then mixed in different ratios to achieve final mixtures containing 100%, 75%, 50%, 25%, 12.5%, 6.3%, 3.1%, 1.6%, 0.8%, and 0% PTPN12-edited cells in a total volume of 1 mL. From each mixture, 200 μL was used for SACF and 250 μL for GILA.
SACF
SACF was conducted as described previously [18]. Briefly, a 1.2% agarose solution was prepared by dissolving SeaPlaque agarose (#50101, Lonza) in Ultra-pure DNase/RNase-free distilled water, and mixed in a 1:1 ratio with 2× MCF10A culture media containing 2× DMEM/F12 medium (diluted from 10× DMEM/F12, #CAM17-005, GenDEPOT, Katy, TX, USA), 20% horse serum (v/v), 40 ng/mL EGF, 200 ng/mL cholera toxin, 20 μg/mL human insulin, and 500 ng/mL hydrocortisone. 50 μL of this solution was added to each well of a black 96-well flat and clear-bottom plate with a cell-repellent surface (655976-SIN, Greiner Bio-one), excluding the well on the edges, and incubated at 4 °C for 30 min. For the cell layer, a cell suspension of 100 000 cells/mL was combined with 2× MCF10A culture medium, and 1.2% agarose solution in a 1:1:1 ratio. 75 μL of this suspension was added on top of the agar base layer (resulting 2500 cells per well) and solidified at 4 °C for 20 min. Subsequently, 100 μL of MCF10A culture medium was added to each well as top layer. Plates were incubated for four weeks at 37 °C in a 5% CO2 atmosphere, with MCF10A culture medium changes twice per week.
For imaging, the top layer medium was carefully removed without disrupting the cell suspension layer, and 50 μL of culture medium containing 25 nM MitoTracker Red CMXRos (#M7512, Thermo Fisher Scientific) and 1 μg/mL Hoechst 33342 (#62249, Thermo Fisher Scientific) was added to each well. The plate was incubated for 1 h at 37 °C and, subsequently, 125 μL of 4.8% Paraformaldehyde solution (#28908, Thermo Fisher Scientific) in PBS were added to each well resulting in a final concentration of 2%. After a 30-minute incubation at room temperature, the wells were washed twice with 100 μL of PBS. Finally, 75 μL of buffer QG (#19063, QIAGEN) was added to each well to solubilize the agar at 37 °C for 1 h. QG buffer incubation was limited to 3 h to prevent the solution from becoming cloudy.
SACF image acquisition
Imaging was performed with the ImageXpress Micro Confocal instrument (Molecular Devices) with a 2× or 5× magnification objective in widefield imaging mode, taking one or four images covering the whole surface of the wells depending on the objective. Analysis was conducted using the MetaXpress cell analysis software (Molecular Devices), with colonies identified based on Hoechst 33342 signal and contaminants excluded using MitoTracker Red CMXRos. First, Hoechst images were slightly blurred to increase the signal homogeneity of the objects and prevent inaccurate object segmentation using the “Open/Close” feature with a circle size value of 5 pixels. The resulting image was then subjected to the “Find Round Objects” algorithm with minimum and maximum width values of 40 and 900 micrometers, respectively, and an intensity above 1500 relative fluorescence units. As the obtained mask recovered not only the colonies of interest but also some artefacts of different shapes and signal intensities (e.g. cell debris and fibers), additional filters were applied. A maximum Ellipse Form Factor of 1.4, a minimum Shape Factor of 0.75 and a maximum length of 1000 µm were used to remove elongated shape artefacts not in accordance with the expected roundness of colonies. To exclude artefacts of small size and showing Hoechst intensities out of the expected range for colonies, a minimum object area of 3600 µm2 and an average Hoechst intensity between 1000 and 15,000 relative fluorescence units were applied as additional filters. To ensure that the colonies consisted of living cells (i.e. cells with functional mitochondria), objects below a MitoTracker average intensity of 1800 relative fluorescence units were excluded. The whole colony population was divided into 3 subpopulations based on their size: small (below 25,000 µm2), medium (between 25,001 and 125,000 µm2) and large (above 125,001 µm2). Of note, all fluorescence intensity thresholds or filters may vary depending on the imaging device and the selected acquisition settings, for example objective, light source intensity and exposure time. Therefore, those parameters were checked and adapted within each lab.
For Supplementary Fig. S2C, plates were additionally imaged using the Scientific CellInsight CX7 High Content Screening (HCS) Platform (Thermo Fisher Scientific) with 10× magnification in widefield imaging mode. A well with the highest expected fluorescence intensity was selected, and images were acquired in channel 1 (Ex/Em 386/440) for the Hoechst signal and channel 2 (Ex/Em 549/600) for the MitoTracker signal, respectively, using laser autofocus. The pixel intensity histogram was reviewed to confirm the signal was within the camera’s dynamic range; if out of range, the exposure time was adjusted, and imaging was repeated. Once the exposure time was confirmed, 25 images were captured per well, covering the entire well. Image analysis was performed using Thermo Scientific HCS Studio Cell Analysis Software. Background correction over 255 pixels was applied, followed by signal smoothing and object selection based on size (approximately >1300 pixels²). Artifacts were excluded based on criteria such as shape, average intensity, and signal variation. SACF raw data is available in Supplementary Table 1.
GILA
GILA was performed as described previously [18]. Briefly, 2500 cells in 100 μL culture medium were seeded in U-bottom, ultra-low attachment plates (#7007, Corning Life Sciences) and incubated for two weeks at 37 °C with 5% CO2. Subsequently, ATP levels were assessed using the ViaLight Plus cell proliferation and cytotoxicity bioassay kit (#LT07-221, Lonza) according to the manufacturer’s instructions. The following plate readers were used across different participating sites: CLARIOstar (BMG Labtech, site A), SpectraMAx i3x (Molecular Devices, site B), EnVision 2104 multilabel reader (Revity, site C), and the Infinite M1000 (Tecan, site D). Wells containing contaminant objects such as plastic fibers were excluded from further analysis as these objects could alter the results. GILA raw data is available in Supplementary Table 1.
Statistical analyses
P-values were determined using mixed effects models for negative binomial distribution (SACF) or Gaussian distribution (GILA) with post-hoc Holm–Bonferroni adjustment as described previously [18]. These models included the concentration as a fixed effect and the experiment repetition as a random effect. The 0% samples served as the reference condition. Script for the analysis used in this study is available in Supplementary File 1.
To evaluate the variability of the SACF and GILA within and between laboratories, a Spearman’s rank correlation coefficient analysis was performed. This method assesses the relative agreement of the mean values for each treatment between sites or between assay repetitions within sites. This non-parametric method determines the strength of the monotonic relationship between different measurements without considering the agreement in absolute values. This is relevant as the GILA assay produces arbitrary values that could differ between measurements and instruments. Moreover, for both GILA and SACF, it is of importance to detect a positive signal as compared to the negative control rather than a certain absolute value. The technical replicates were averaged over the assay repetition for the within-site analysis and overall replicates for the between-site analysis. Treatment concentration was used as the unit of analysis, and Spearman’s rank correlation coefficient was determined to assess the correlations. To account for multiple testing, p-values were adjusted using the Holm method (Supplementary File 2).
Determination of mutation/cleavage efficiency via Sanger sequencing and TIDE
DNA was isolated from the cells remaining after SACF and GILA preparation, which included ~120,000 edited cells and 270,000 untreated cells. Isolation was performed using the PureLink Genomic DNA Kit (#K1820, Thermo Fisher Scientific) according to the manufacturer’s protocol, with DNA eluted in 30 μL of elution buffer.
PCR amplification of the target region was performed using Q5 High-Fidelity 2× Master Mix (#M0492S, New England Biolabs), 1 μM primers (Microsynth, see Table 3 for sequence), and 10–100 ng total DNA in a 25-μL reaction. PCR conditions included 30 s at 98 °C, 35 cycles of 5 s at 98 °C, 30 s at the primer annealing temperature of 65 °C, 20 s at 72 °C, and a final extension for 2 min at 72 °C. The PCR product was purified using the GeneJET PCR purification kit (#K0702, Thermo Fisher Scientific) according to the manufacturer’s instructions.
Table 3 Primers used in this study.
For Sanger sequencing, purified DNA was diluted to 18 ng/100 bp in 12 μL elution buffer and mixed with 3 μL of 100 μM forward primer. Sanger sequencing was carried out at Azenta Genewiz (site A), Psomagen (site B), Microsynth (site C and D). Chromatograms were analyzed for mutation frequency using Tracking Indels by Decomposition (TIDE) software [21] using the default parameters and the largest possible indel size range to calculate the on-target editing efficiency.
