


Materials
Paclitaxel (PTX), Human Serum Albumin (HSA), transferrin, Cy5-NHS, FITC-SA, plastic cell culture dishes and plates, trypsin, Dulbecco’s modified Eagle medium (DMEM) were obtained from Meilun Biotech (Dalian, China). DCF-DA Staining Kit was obtained from Solarbio Corporation (Beijing, China). Anti-PD-L1 was purchased from Proteintech (Wuhan, China). Hoechst 33,342 and MTT were provided by Beijing Solarbio Technology Co., Ltd. (Beijing, China). All of immunity antibody used in flow cytometry, such as Anti-CD45, Anti-CD3, anti-CD4, anti-CD8, anti-Foxp3, anti-CD80 and anti-CD86 antibodies were obtained from BioLegend.
Animals and cells
GL261 cells was obtained from Meilun Biotech (Dalian, China). The GL261 cell line was incubated in DMEM with 10% FBS. Ethics approval was obtained from the Institutional Animal Ethical Care Committee (IAEC) of the Second Affiliated Hospital, Zhejiang University School of Medicine (Approval No. 341 (2024)). All animal experiments were performed in accordance with the Guide for the Care and Use of Laboratory Animals. We ensured that all animal experiments in this study complied with the ARRIVE guidelines for reporting animal research, and that no issues or disputes related to animal ethics were involved. The anesthetic agents in this study is isoflurane.
The mice used in the experiments were obtained from Liaoning Changsheng Biotechnology Co., Ltd., and quality testing was performed by Suzhou Xishan Biotechnology Co., Ltd.
Preparation of SA-PTX and Fe3+@SA-PTX
SA was dissolved in ultrapure water to prepare a 10 mg/mL aqueous solution (A) PTX was dissolved in dichloromethane (DCM) to prepare a 10 mg/mL organic solution (B) 1 mL of solution A was aliquoted into a glass vial and placed on a magnetic stirrer. While stirring, 0.125 mL of solution B was added dropwise, after which stirring was immediately stopped. DCM was removed by rotary evaporation, followed by reconstitution with water to achieve a final PTX concentration of 0.5 mg/mL (SA-PTX).
Solution C: 0.8 mg/mL ferric chloride (FeCl₃) aqueous solution was prepared. Solution D: 0.8 mg/mL tannic acid (TA) aqueous solution was prepared. 1 mL of SA-PTX solution was placed under magnetic stirring. Then, 0.1 mL of Solution C (FeCl₃) and 0.2 mL of Solution D (TA) were added dropwise sequentially. Stir for 15 min. The nanoparticles were centrifuged at 50,000 ×g, and the supernatant was carefully removed. The pellet was then resuspended in PBS to achieve a final PTX concentration of 0.5 mg/mL (Fe3+@SA-PTX).
Fe³⁺@SA-PTX was prepared by a one-step nano-precipitation method rather than by nab manufacturing. nab is an equipment-driven, high-pressure homogenization process, whereas one-step nano-precipitation is a solvent-exchange-driven assembly process. The latter is more suitable for integrating coordination chemistry during nanoparticle formation in our system.
Size and zeta potential of Fe3+@SA-PTX
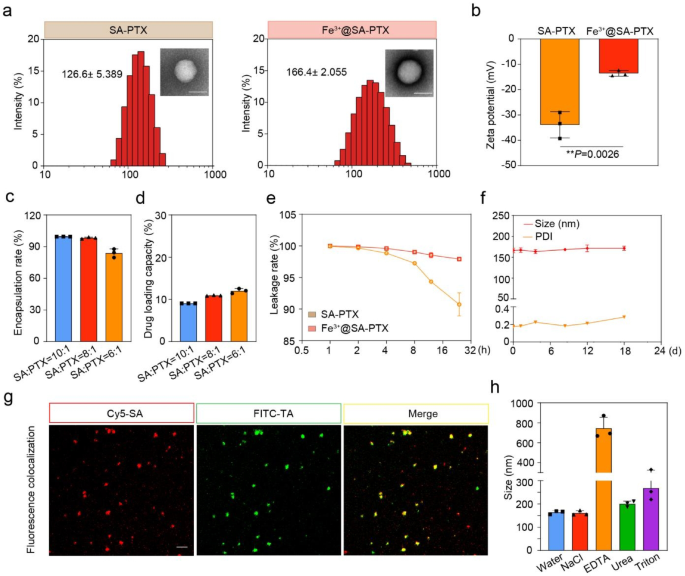
Dilute the SA-PTX and Fe3+@SA-PTX complex to 0.5 mg/mL using ultrapure water or PBS buffer to ensure the sample is uniformly dispersed without aggregation. Calibrate the Malvern particle size analyzer according to the operation manual, using standard particles to ensure the instrument is in optimal working condition.
Encapsulation rate and drug loading capacity of Fe3+@SA-PTX
Accurately measure 1 mL of the formulation, add 19 volumes of methanol to break the emulsion, sonicate for 5 min, then transfer 1 mL of the disrupted solution into a centrifuge tube, centrifuge at 15,000 rpm for 10 min, collect the supernatant, and determine the PTX concentration (C₁) by HPLC. Separately, accurately measure 1 mL of the formulation, centrifuge at 17,800 rpm for 60 min, collect 100 µL of the upper supernatant, dilute it with 9 volumes of methanol, sonicate for 5 min, centrifuge at 15,000 rpm for 10 min, collect the supernatant, and determine the PTX concentration (C₂) by HPLC. Encapsulation rate (%)=(2C1-C2)*100%/2C1. Drug loading capacity (%)=Encapsulation rate *mPTX*100%/mSA+mPTX.
Leakage rate of Fe3+@SA-PTX
The formulation was allowed to stand for 24 h. At the 2nd, 4th, 8th, 12th, and 24th h timepoints, aliquots were centrifuged at 5,000 ×g to collect supernatant for PTX concentration quantification.
Fluorescence colocalization experiment of preparation
Prepare SA-PTX as described in Sect. 3.3. Dissolve Cy5-NHS in DMSO to prepare a 1 mg/mL stock solution. Add an appropriate amount of Cy5-NHS stock solution to the SA-PTX solution to achieve a final Cy5-NHS concentration of 5–10 µg/mL. Gently mix. Incubate in the dark at room temperature for 30 min with gentle shaking. Centrifuge at 50,000 × g for 60 min to remove unbound FITC-NHS. Obtain Cy5-fluorescently labeled SA-PTX.
Prepare Fe3+@SA-PTX as described in Sect. 3.3. Dissolve FITC-SA in water to prepare a 1 mg/mL stock solution to mark TA-Fe3+. Apply the prepared Fe3+@SA-PTX solution onto glass slides, cover with coverslips. Use CLSM to excite the fluorescence of Cy5 and FITC separately, observe and capture fluorescence colocalization images.
Investigation of the types of intermolecular forces
Five aliquots of Fe³⁺@SA-PTX solution (labeled A-E) were treated as follows: Sample A received pure water (control), B received 200 mM NaCl (ionic bond disruption), C received 100 mM EDTA (coordination bond disruption), D received 100 mM urea (hydrogen bond disruption), and E received 10 mM Triton X-100 (hydrophobic interaction disruption). After 72-hour incubation at 25 °C (Samples A-D) or immediate testing (Sample E), all samples were analyzed for particle size and distribution changes using dynamic light scattering (Malvern Zetasizer) to evaluate the formulation’s stability and identify the dominant intermolecular forces between albumin and the prodrug molecules.
Cytotoxicity assay
Take a 96-well plate and culture GL261 cells in DMEM medium containing 10% FBS in an incubator at 37 °C with 5% CO₂ until they reach 80% confluence. Treat the cells with PBS, PTX, Abraxane, SA-PTX, Fe³⁺@SA, and Fe3+@SA-PTX for 24 h. After incubation, add 10 µL of 5 mg/mL MTT solution to each well. Continue to incubate for 4 h. After the incubation, remove the supernatant and add 100 µL of DMSO to each well to dissolve the purple formazan crystals. Gently shake the 96-well plate to ensure complete dissolution of the formazan. Measure the absorbance (OD value) of each well at 570 nm using a microplate reader.
ROS detection
GL261 cells were cultured in DMEM medium supplemented with 10% FBS, penicillin (100 U mL–1), and streptomycin (100 µg mL–1). The cells were maintained in a humidified atmosphere of 5% CO2 at 37 °C. GL261 cells were cultured and divided into three groups (PBS, Abraxane and Fe3+@SA-PTX). After the cells occupied 80% of the bottom, the medium was discarded, and the cells were rinsed twice using PBS. DCFH-DA fluorescent dye (10 µM, 1 mL) (Meilun ROS Assay Kit MA0219) was added to the blank medium working solution. The cells were then incubated at 37 ℃ for 1 h in the dark. Next, the medium was discarded, and the cells were rinsed with PBS again. Add PBS, Abraxane, and Fe3+@SA-PTX in upper layer and incubate at 37 °C for 6 h. Wash the cells with PBS, then stain the cell nuclei with PADI. Subsequently, use CLSM and flow cytometry to assess the ROS levels in each group of cells.
Simulated BBB in vitro
Place the Transwell inserts into a 24-well plate. Add BMECs cell suspension (1 × 10⁵ cells/mL) to the upper chamber (inner well) of the inserts to allow the cells to adhere and grow into a monolayer, simulating the BBB. Culture GL261 cells in the lower chamber. Once the upper chamber cells have formed a confluent monolayer, add PBS, Abraxane, SA-PTX, Fe3+@SA, and Fe3+@SA-PTX to the upper chamber. After 2 h of incubation, remove the drug solutions and add fresh medium. Assess the cytotoxicity of the drugs on the lower chamber cells using the MTT assay.
In vivo tissue distribution assay
A cell suspension containing 5 × 10⁵ cells was subcutaneously injected into the abdominal flanks of mice. Mark SA with Cy5-NHS to prepare Fe3+@SA-PTX. Mark Abraxane with Cy5-NHS in the same way. After intravenous injection into mice, measure the fluorescence intensity distribution in the mice using IVIS at 2 h, 6 h, and 12 h. At 24 h, harvest the main tissues and organs of the mice to measure fluorescence intensity, assessing the tissue distribution and tumor targeting of Abraxane and Fe3+@SA-PTX.
Inject 5 × 10⁴ GL261-luc cells into the brain of C57 mice at coordinates 2 mm posterior to the Bregma, 2 mm right lateral, and 3 mm depth to establish an orthotopic glioma model. Ten days later, intravenously inject Cy5-labeled Abraxane and Fe3+@SA-PTX into the different groups of mice. After 24 h, sacrifice the mice and measure the fluorescence intensity in their major organs.
Immunofluorescence section
A cell suspension containing 5 × 10⁵ cells was subcutaneously injected into the abdominal flanks of mice, which were then randomized into three treatment groups (PBS, Abraxane and Fe³⁺@SA-PTX). When tumor volumes reached 150 mm³, treatments were initiated. After 7 days of therapy, mice were euthanized by cervical dislocation, and tumors were excised for subsequent analysis. The tumor tissues underwent paraffin embedding, sectioning, primary antibody incubation (e.g., anti-Ki67 for proliferation), secondary antibody incubation (e.g., Alexa Fluor 488-conjugated), and fluorescence imaging. Quantitative analysis of fluorescence intensity was performed to compare treatment effects across groups.
Pharmacodynamic research
Inject 5 × 10⁴ GL261-luc cells into the brain of C57 mice at coordinates 2 mm posterior to the Bregma, 2 mm right lateral, and 3 mm depth. Divide the mice into five groups (n = 8). According to the administration strategy on days 10, 12, 14, 16 and 18, inject PBS, SA-PTX, Abraxane (i.v.), Abraxane (i.c.) and Fe3+@SA-PTX. Tumor progression was monitored by measuring bioluminescence intensity (using small-animal in vivo imaging) on days 10, 13, 16, and 20 post-treatment, with daily body weight recordings to assess systemic toxicity. On day 23, mice were sacrificed for necropsy, and major organs (brain, heart, liver, spleen, lungs, and kidneys) were harvested for histopathological analysis (H&E staining) to evaluate the safety profile of each formulation.
In vivo immunoactivation evaluation
Inject 5 × 10⁴ GL261-luc cells into the brain of C57 mice at coordinates 2 mm posterior to the Bregma, 2 mm right lateral, and 3 mm depth. Divide the mice into four groups (n = 8). According to the administration strategy on days 8, 10, 12, 14, and 16, inject PBS, Fe3+@SA-PTX, anti-PDL1, and Fe3+@SA-PTX+anti-PDL1. On day 21, sacrifice 3 mice from each group to analyze the proportions of various immune cells in the tumor site and spleen using flow cytometry. Use the remaining 5 mice in each group to assess the survival rate.
Statistical analysis
Data are showed as mean ± SD, and statistical significance was conducted using two-tailed Student’s t-test (*p < 0.05, **p < 0.01, ***p < 0.001, and ****p < 0.0001; n.s. denotes not significant). All data were analyzed using GraphPad Prism 8 and Microsoft Excel software version 2019.
Statement
We confirm that all experiments were performed in accordance with relevant guidelines and regulations.
We confirm that all experimental protocols were approved by The Second Affiliated Hospital Zhejiang University School of Medicine.
