


Ethics statements
All experiments involving human samples and animals were carried out in accordance with ethical guidelines and approved by the corresponding institutional committees. Use of human samples was approved by the Ethics Committee of the University Hospital of Salamanca (Approval protocol: PI 2019 04 297). Informed consent was obtained from all patients before their participation in the study, in accordance with the Declaration of Helsinki. Animal handling was performed at the animal facility of the University of Salamanca in accordance with European Directive 2010/63/EU and Spanish Law 6/2013 regarding the protection of animals used in scientific research. The use of animals in experimental research was granted by the Junta de Castilla y León (Department of Agriculture and Livestock), under reference number 844.
Reagents and antibodies
The reagents, antibodies, materials, and equipment employed in the present study are detailed in Supplementary Table 1.
Cell extracts preparation, immunoprecipitation and Western blot
Cell extracts for protein analyses, immunoprecipitation and western blot procedures were performed as previously described.47,48 Data used for the quantitation of western signals are provided as Supplementary Table 2. For patient samples (normal and tumor ovarian tissue), a piece of tissue was weighed and homogenized using a Dispomix homogenizer in ice-cold lysis buffer (2 mL per 100 mg of tissue) composed of 20 mM Tris-HCl pH 7.0, 140 mM NaCl, 50 mM EDTA, 10% glycerol, 1% Nonidet P-40, 10 µM pepstatin, 10 µg/ml aprotinin, 10 µg/ml leupeptin, 25 mM β-glycerol phosphate, 50 mM sodium fluoride, 1 mM phenylmethylsulfonyl fluoride, 1 mM sodium orthovanadate. The homogenates were then centrifuged at 10,000 × g for 20 min at 4 °C, and the supernatants were transferred to new tubes.
β-actin, GAPDH, calnexin or stain-free blots were used as protein loading controls, according to the molecular weight of the proteins under study. Band intensities were quantified by densitometry using Image Lab™ Software Version 6.0.1, provided with a ChemiDoc imaging system. For the preparation of stain-free gels, 50 µL of 2,2,2-trichloroethanol were added to 10 mL of SDS-PAGE gel solution. Total protein detection was performed using the ChemiDoc apparatus according to the manufacturer’s instructions.
Preparation of antibody-drug conjugates
For the preparation of the CD98hc-directed ADCs, we used an antibody that recognizes the ectodomain of CD98 (anti-CD98hcECTO, also generically termed in this work as anti-CD98hc) together with different linker-payload combinations. The selected payloads were Mertansine (DM1), Deruxtecan (DXd), and Monomethyl Auristatin F (MMAF). For in vivo experiments, we used a humanized anti-CD98hc antibody (IGN523) that was coupled to MMAF.
For the preparation of the anti-CD98hc-DM1, an Amicon Ultra-0.5 mL Centrifugal Filter 100 K was used to exchange the antibody buffer to Conjugation Buffer 1 (50 mM potassium phosphate/50 mM sodium chloride, pH 6.5, 2 mM EDTA). A 10 mM SMCC-DM1 solution in dimethylacetamide (DMA) was freshly prepared, and 7 molar equivalents were added to the antibody. The conjugation reaction proceeded for 16 h at room temperature. Following the reaction, the immunoconjugate was buffer exchanged into Conjugation Buffer 2 (50 mM sodium succinate, pH 5) using a PD-10 column.
The preparation of anti-CD98hc-DXd and anti-CD98hc-MMAF was conducted by cysteine-based reactions. The buffer containing the antibody was changed to PBS, pH 7.4 using a PD-10 column and then heated to 37 °C for 10 min in a Thermoblock. Subsequently, 8 molar equivalents of freshly prepared tris(2-carboxyethyl)phosphine (TCEP) were added to reduce disulfide bonds to free thiol groups on the antibodies. This reaction mixture was incubated for 2 h at 37 °C. Subsequently, 20 molar equivalents of MC-Val-Cit-PAB-MMAF or Maleimide-GGFG-DXd were added to the reduced antibodies, and the conjugation reaction was incubated at room temperature for 1 h. Finally, the immunoconjugates were buffer-exchanged using PD-10 columns to remove unconjugated linker-payloads.
After the ADCs were prepared, they were sterilized using a 0.22 μm filter, and their concentrations were measured by absorbance at 280 nm with a NanoDrop 2000 spectrophotometer. The conjugation of the payloads to the antibody was assessed by western using antibodies that recognize the payloads. The integrity of the heavy and light chains of the antibodies was evaluated using stain-free blots, visualized on a ChemiDoc imaging system. The Drug-to-Antibody Ratio (DAR) of the different anti-CD98hc ADCs was estimated by UV-Vis spectroscopy using a NanoDrop 2000 spectrophotometer. Absorbance was measured at 280 nm to quantify the antibody, and at 248 nm (for anti-CD98hc-MMAF), 252 nm (for anti-CD98hc-DM1), or 380 nm (for anti-CD98hc-DXd) to quantify the respective drug payloads. DAR values were calculated using the following formulas obtained from CellMosaic® (https://www.cellmosaic.com/):
$${{\rm{DAR}}}_{{\rm{anti}}-{\rm{CD}}98{\rm{hc}}-{\rm{DM}}1}=\frac{21{\rm{X}}\left(\frac{{\rm{A}}252}{{\rm{A}}280}\right)-8.74}{2.8-0.57{\rm{X}}\left(\frac{{\rm{A}}252}{{\rm{A}}280}\right)}$$
$${{\rm{DAR}}}_{{\rm{anti}}-{\rm{CD}}98{\rm{hc}}-{\rm{DXd}}}=\frac{34{\rm{X}}\left(\frac{{\rm{A}}380}{{\rm{A}}280}\right)}{3.44-\left(\frac{{\rm{A}}380}{{\rm{A}}280}\right)}$$
$${{\rm{DAR}}}_{{\rm{anti}}-{\rm{CD}}98{\rm{hc}}-{\rm{MMAF}}}=\frac{21{\rm{X}}\left(\frac{{\rm{A}}248}{{\rm{A}}280}\right)-9}{1.615-0.1425{\rm{X}}\left(\frac{{\rm{A}}248}{{\rm{A}}280}\right)}$$
Cell culture and cell proliferation
Cell lines were grown in Dulbecco’s modified Eagle’s medium (DMEM) (OVCAR3, OVCAR8, luciferized OVCAR8, SKOV3, HT29, MDA-MB231) or in RPMI 1640 medium (A2780 and IGROV1) supplemented with 10% fetal bovine serum (FBS), containing high glucose (4500 mg/L) and antibiotics (penicillin 100 U/mL, streptomycin 100 μg/mL). Cell lines were cultured at 37 °C in a humidified atmosphere in the presence of 5% CO2 and 95% air. Authentication of the cell lines was performed by the Hematology Service of the University Hospital of Salamanca. The OVCAR8 luciferase-expressing cells were kindly provided by Drs. S. Matilla-Almazán and A. Esparís-Ogando. HT29 CD98hc CRISPR #5 and MDA-MB231 CD98hc CRISPR #G3 cells were generated as previously reported.25,35
Cell proliferation was assessed using the MTT metabolization assay.48 Cells were seeded into 24-well plates at densities ranging from 3000 to 16,000 cells per well. The following day the cells were treated with the drugs and 4 days later the MTT solution was added to each well (final concentration 0.5 μg/μL) and incubated at 37 °C for 1 h. The medium was then removed and 500 μL of dimethyl sulfoxide (DMSO) were added to each well to solubilize the formazan crystals. Plates were gently agitated in the dark for 10 min to ensure complete dissolution. Absorbance of the samples was measured at 570 nm in a Tecan ULTRA Evolution multiwell plate reader.
Immunofluorescence microscopy
For immunofluorescence experiments, cells were seeded onto glass coverslips placed in 35 mm dishes and treated with 10 nM of anti-CD98hcECTO or anti-CD98hc-MMAF for the indicated times. After treatment, the cells were rinsed with PBS/CM (PBS supplemented with 1 mM CaCl2, 0.5 mM MgCl2), fixed using 2% paraformaldehyde for 30 min, and subsequently washed again with PBS/CM. To quench non-specific fluorescence, the monolayers were incubated with 50 mM NH₄Cl for 10 min. Cells were subsequently permeabilized using PBS supplemented with 0.1% Triton X-100 and 0.2% BSA. Afterward, the cell-containing coverslips were incubated for 1 h in a blocking buffer consisting of PBS/CM with 0.2% BSA.
Primary antibodies (anti-LAMP1, anti-β-tubulin, or anti-nucleoporin) were diluted in blocking buffer, added to the cells and incubated for 1 h at room temperature. Subsequently, samples were washed three times for 10 min each with PBS containing 0.2% BSA. Coverslips were then incubated in the dark with the corresponding secondary antibodies conjugated to Cy3 or Cy2 in blocking buffer for 30 min at room temperature. After three additional 10-min washes in PBS containing 0.2% BSA, cells were stained with DAPI (1 μg/mL), and mounted in gelvatol solution. Samples were examined by confocal immunofluorescence microscopy on a Leica TCS SP5 instrument.
Cell cycle and apoptosis assays
For cell cycle assessment, IGROV1 and OVCAR8 cells were cultured in 6-well plates and treated with 2.5 or 5 nM of anti-CD98hc-MMAF for 24 h. Following treatment, both adherent and floating cells were collected together. The cells were washed with PBS and then fixed and permeabilized with ice-cold 70% ethanol by overnight incubation. The following day, the cells were centrifuged and the resulting pellets were resuspended in 500 μL of PBS containing 250 μg of DNase-free RNAase A, and then incubated at 37 °C for 1 h. Subsequently, 2.5 μg of propidium iodide (PI) were added and the cells were incubated for 15 min at room temperature. DNA content and cell cycle distribution were analyzed using a BD Accuri C6 flow cytometer with C6 software.
For assessing apoptosis, IGROV1 and OVCAR8 cells were treated with 5 nM of anti-CD98hc-MMAF for 48 h. After treatment, both adherent and non-adherent cells were pooled. The collected cells were washed with PBS and resuspended in 100 μL of binding buffer (10 mM HEPES/NaOH [pH 7.4], 140 mM NaCl, 2.5 mM CaCl2) containing 5 μL of Annexin V-fluorescein isothiocyanate (FITC) and 5 μL of 50 μg/mL PI. Samples were incubated for 15 min in the dark, followed by the addition of 400 μL of binding buffer. Finally, the labeled cells were assessed using a BD Accuri C6 flow cytometer.
Cell surface staining of CD98hc
A previously described protocol was used to perform CD98hc staining on the surface of the cell lines.35 In summary, cells were treated with anti-CD98hc (anti-CD98hcECTO or humanized anti-CD98hc) or anti-CD98hc-MMAF (prepared with anti-CD98hcECTO antibody) at a concentration of 10 nM for 15 or 30 min at 37 °C. After treatment, cells were trypsinized, collected in culture medium, and centrifuged at 1200 rpm for 5 min. The cell pellets were resuspended in PBS containing 2% BSA and incubated with anti-mouse FITC or anti-human Alexa-488 secondary antibodies for 30 min at room temperature with agitation. After two washes with PBS + 2% BSA, CD98hc cell surface expression was analyzed by flow cytometry using an Accuri C6 flow cytometer. A total of 50,000 events were acquired per sample.
Human-derived specimens
Fresh human tissue specimens from patients with OC who underwent surgical procedures were obtained through the biobank of PMC-BEOCyL (Comparative Molecular Pathology – Biobank Network of Oncological Diseases of Castilla y León, Salamanca, Spain), member of the Spanish Biobank Network (www.redbiobancos.es). Normal tissue samples were collected from tumor-adjacent regions and were confirmed as normal following assessment by expert pathologists. Ascitic fluids were collected from OC patients at the University Hospital of Salamanca. Human samples were collected following established ethical standards and received approval from the Ethics Committee of the University Hospital of Salamanca (PI 2019 04 297). All participants gave written informed consent prior to enrollment, in line with the principles outlined in the Declaration of Helsinki.
Freshly isolated ascitic fluid was obtained in sterile vacuum containers and processed in a biosafety cabinet to ensure aseptic conditions. A volume of 12.5 mL of ascitic fluid was transferred into T-75 cm2 tissue culture flasks with 0.2 μm vented caps and supplemented with an equal volume (12.5 mL) of complete DMEM medium (10% FBS, penicillin 100 U/mL, streptomycin 100 μg/mL and amphotericin B 5 μg/mL). The flasks were incubated at 37 °C in a 5% CO₂ atmosphere. Upon reaching confluence, the cells were washed once with PBS and trypsinized using 0.05% trypsin-EDTA for 5 min at 37 °C. The cells were counted, and 20,000 cells per well were seeded in a 24-well plate to evaluate the antiproliferative action of anti-CD98hc-MMAF by MTT assay. The remaining cells were embedded in agarose, fixed with formalin, and included in paraffin to characterize the presence of tumor cells in the culture by immunohistochemistry. Specifically, antibodies against PAX8, WT1, and Calretinin were used, along with an anti-CD98hcV509 antibody to assess the expression of this protein in the ascites-derived cells.
In vivo studies
The animals were maintained in the institution’s animal facility, and all procedures followed the applicable legal and institutional regulations. Seven-week-old female BALB/c nude mice were acquired from Charles River Laboratories.
For xenograft studies, 2 × 10⁶ A2780 cells suspended in a 1:1 mixture of RPMI + 10% FBS and Matrigel (50 μL each) were subcutaneously implanted into the right flank of the mice. Once tumors reached a volume of approximately 100 mm3, the animals were randomly assigned into two groups (n = 6 per group), and treatments were initiated. Mice received weekly intraperitoneal injections of anti-CD98hc-MMAF at a dose of 5 mg/kg, for a total of three administrations, whereas the control group received the vehicle (PBS). Tumor size was monitored every 3–4 days (twice per week) using digital calipers, and tumor volume was estimated using the formula: V = (L × W2)/2, where V represents volume (mm³), L is length (mm), and W is width (mm). The animals were sacrificed when tumors approached 2000 mm3 or at the end of the experiment. Following euthanasia by CO₂ inhalation, tumor tissues were collected, one portion was snap-frozen in liquid nitrogen, and another piece was fixed in 10% formol and paraffin embedded. Frozen tumor samples were then minced, washed with PBS, and homogenized as described in the cell extracts preparation section.
For orthotopic studies, a total of 5 × 10⁵ OVCAR8-luciferase cells diluted in 100 μL of PBS were injected intraperitoneally into each mouse (day 0). Three days later, luciferase activity (bioluminescence) was measured (day 3) using an IVIS Lumina S5 imaging system. To that end, mice were anesthetized by isoflurane inhalation after intraperitoneal administration of 100 µL of luciferin at a concentration of 13.5 mg/mL in PBS. IVIS® images were acquired with the following parameters: 1 min exposure time and binning factor of 8. For the bioluminescence analyses, the size of the region of interest (ROI) was kept constant across all images, and the total flux (expressed as photons per second, p/s) was measured for each mouse. The animals were then randomized into five groups (n = 6 per group). Two days later (day 5), treatments were initiated and administered weekly (three doses in total) by intraperitoneal injection at a dose of 5 mg/kg for humanized anti-CD98hc-MMAF, humanized anti-CD98hc, humanized IgG1-MMAF and 0.195 mg/kg of MMAF, whereas the control group received the vehicle (PBS). Luciferase activity (bioluminescence) and body weight were measured twice weekly. At the end of the experiment (1 week after the last treatment, day 21 after initiation of the treatments), the mice were anesthetized with isoflurane and sacrificed by cervical dislocation. Necroptic analyses were performed to assess the presence of peritoneal tumor implants. Representative photos of the peritoneal cavities were taken using a mobile phone.
Immunohistochemical analyses
Three-micrometer sections of paraffin-embedded samples (patients’ tissue, xenograft tissue, or cells from ascitic fluid cultures) were cut using a microtome and mounted onto slides. Immunohistochemical staining was performed using a Leica BOND-III Fully Automated IHC and ISH Staining System following the manufacturer’s instructions.
Caspase 3 activity assay
Fifty micrograms of cell extract from tumor samples of mice untreated or treated with anti-CD98hc-MMAF were added to 96-well plates in triplicate. Volumes were adjusted to 100 μL using 1x Caspase buffer (25 mM HEPES [pH 7.4], 150 mM NaCl, 1 mM EDTA, 0.1% CHAPS, 10% sucrose). Next, 100 μL of 2x Caspase reaction buffer (50 mM HEPES [pH 7.4], 300 mM NaCl, 2 mM EDTA, 0.2% CHAPS, 20% sucrose, 20 mM DTT, and 10 μM fluorescently labeled caspase 3 substrate Ac-DEVD-AFC) were added to each well containing the cell lysates. After gentle shaking, the plate was incubated at 37 °C for 1 h. Fluorescent signals were then recorded at 400/505 nm using a Tecan Infinite M200 Pro plate reader.
ELISA for IgG-MMAF detection
IgG-MMAF levels in organs and tumors from mice were quantified using a sandwich ELISA. High-binding 96-well plates were coated with 50 µL per well of an anti-human IgG antibody diluted to 5 µg/mL in PBS and incubated overnight at 4 °C. The next day, plates were washed twice with 200 µL PBS and blocked with 200 µL PBS + 3% BSA for 2 h at room temperature. After two PBS washes, 100 µg of tissue lysate per well (in 100 µL blocking buffer) were added in duplicate. For quantification, a standard curve of belantamab mafodotin was prepared at concentrations of 100, 50, 25, 12.5, 6.25, 3.12, and 1.3 ng/mL also in blocking buffer. Two wells containing only blocking buffer were included as blanks. After 2 h of incubation at room temperature, plates were washed four times with PBS. Next, wells were incubated for 1 h with 50 µL of anti-MMAF antibody (20 µg/mL), washed four times, and incubated with HRP-conjugated anti-mouse IgG (1:500) for another hour. After four final washes, 50 µL of TMB substrate were added and incubated for 15 min in the dark. The reaction was stopped with 50 µL of H₃PO₄ 1 M, and absorbance was read at 450 nm in a Tecan ULTRA Evolution multiwell plate reader.
Statistical analyses and in silico studies
Statistical analyses were conducted using either SPSS version 15.0 or GraphPad Prism version 8.0. Comparison of continuous variables between two groups were performed using a Student’s t test, unless otherwise indicated. A p value below 0.05 was used as the threshold for statistical significance. Each experiment was repeated at least twice, and representative data are presented.
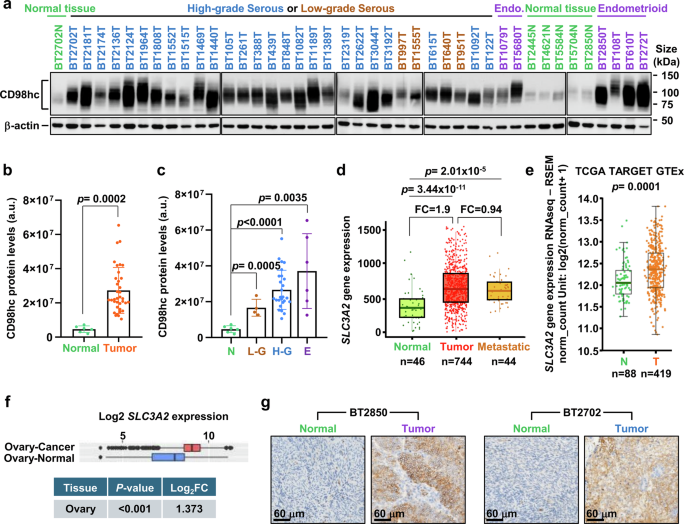
In silico evaluation of CD98hc expression in human samples was conducted using the TNMplot (https://tnmplot.com/analysis/), GENT2 (http://gent2.appex.kr/gent2/), UCSC Xena (https://xena.ucsc.edu/) and GTEx (https://www.gtexportal.org.home) online databases, accessed in July 2025 and January 2026 (GTEx data). Expression units and p-values are automatically given in those databases. Studies on the potential relationship between SLC3A2 expression and patient outcome or response to therapy, were evaluated using the GEPIA3 (https://gepia3.bioinfoliu.com/) and ROCplotter (https://rocplot.com/) online tools, respectively.
