


Pattern-based clinical reasoning
This section analyses the performance of the AI tool for BCC detection in conjunction with the labels provided to explain this classification. Table 3 presents metrics that summarise this performance. The metrics are averaged over all folds. This table has three parts. The first part shows the performance of the AI tool in binary classification. The second part shows its performance in detecting BCC dermoscopic patterns. Finally, the third part represents the accuracy of the labels that provide the clinical explanation.
In general, the diagnostic performance of BCC / non-BCC is high, around 0.9 for all metrics. However, the BCC pattern detection performance needs to be analysed with a deeper insight. Minority classes tend to achieve low recall because the AI tool trained with unbalanced databases tends to favour majority classes. As shown in Sect. Database, SW, MG and ML are underrepresented classes. Strategies such as data augmentation and advanced sampling, a one-vs-all strategy combined with stratified k-fold cross-validation helped to achieve a more balanced classification across patterns, thereby improving overall model performance. However, the metrics achieved should not be analysed in the same way as BCC/non-BCC performance. They should only be evaluated to the extent that they provide a correct explanation for binary classification. For the specialist, a tool that perfectly classifies all BCC patterns within a lesion is not particularly useful, as identifying even a single pattern can already indicate a positive BCC diagnosis. Therefore, the third section of Table 3 provides information relevant to the clinician by assessing the model’s ability to detect at least one of the BCC patterns annotated by specialists, which is sufficient for a positive BCC diagnosis according to clinical criteria. Furthermore, this information is further supported by Table 4, which, as will be discussed later, shows whether the classification of each pattern is being extracted from the same region as identified by the dermatologist. This additional evaluation is summarised in the third section of Table 3, titled “Clinically-inspired XAI”. The table demonstrates that 73% of non-BCC lesions without any BCC patterns, 95% of non-BCC lesions with PN, and 99% of BCC lesions with at least one BCC pattern are correctly labelled as such.
Table 3 Evaluation using binary, multilabel classification metrics and physician-guided analysis.
Clinically-inspired visual XAI
Clinical validation framework
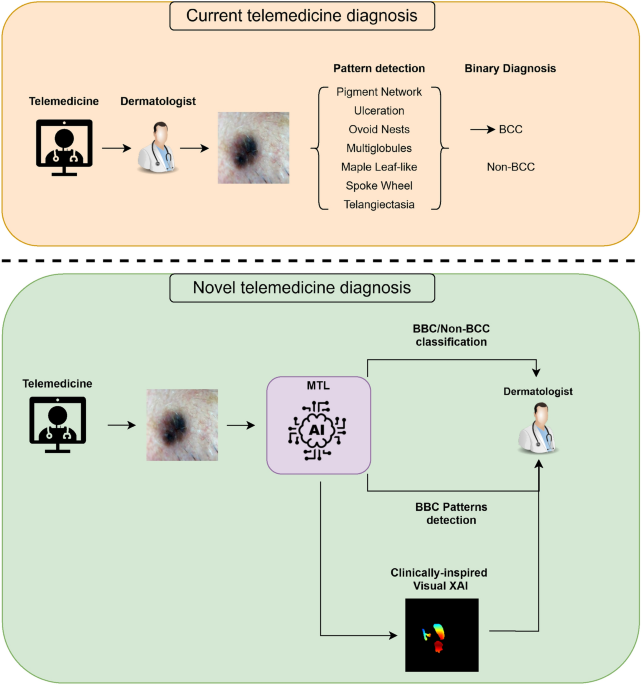
This section refers to the AI model at the top of Novel telemedicine diagnosis in Fig. 1 (BCC/Non-BCC classification). From a clinical perspective, the utility of an XAI system extends beyond simple visualization of model attention–it must demonstrate that the model’s focus aligns with the diagnostic criteria used by dermatologists. To address this requirement, we quantify the accuracy of the AI tool in focusing on the correct part of the lesion, specifically the BCC dermoscopic patterns identified by clinicians. To this end, the areas of the BCC pattern delineated by dermatologists are compared with the activated areas of the model, providing a quantitative measure of the model’s agreement with human diagnostic criteria and demonstrating its ability to accurately identify critical features of BCC lesions.
To develop this concept, expert-generated segmentations are used. As detailed in Sect. Database, a subset of 334 samples was segmented by a specialist. A dermatologist performed an individual segmentation of each BCC pattern for each image (Fig. 4). These expert annotations serve as the clinical ground truth against which the model’s attention mechanisms are validated, ensuring that XAI methods are not only technically robust but also tailored to clinical reasoning processes.
Expert-model agreement assessment
To complement visual inspection, we quantify the spatial agreement between Grad-CAM activations and expert segmentations using conditional probability density functions, as described below.
To quantify the accuracy of the model activation areas with respect to the areas of clinical interest, the conditional probability density functions of the normalised Grad-CAM values within and outside the area segmented by dermatologist were estimated. Let z(x, y) the Grad-CAM value at position (x, y). Denote Fg the area segmented by the dermatologist and Bg the background. \(P\left( z\left( x,y\right) \mid \text {Fg}\right)\) is the probability density function of the Grad-CAM values for pixels \((x,y) \in \text {Fg}\) and \(P\left( z\left( x,y\right) \mid \text {Bg}\right)\) is the probability density function of Grad-CAM values for pixels \((x,y) \in \text {Bg}\).
Figure 3 illustrates this analysis. Figure 3a shows the original BCC lesion. Figure 3b shows the Grad-CAM map. Figure 3c shows the dermatologist’s segmentation overlaid on the Grad-CAM map. Figure 3d shows an example of the two conditional probability density functions. The orange curve represents \(P\left( z\left( x,y\right) \mid \text {Bg}\right)\), and the blue curve represents \(P\left( z\left( x,y\right) \mid \text {Fg}\right)\). The orange curve is centred near 0, indicating low activation outside the mask, while the blue curve shows significant Grad-CAM information within the clinical segmentation, indicating that the model extracts features from the same region as the specialist.
Table 4 summarises the information extracted from these probability density functions. Specifically, the mean, standard deviation of \(z\left( x,y\right)\) for \((x,y) \in Fg\) and \((x,y) \in \text {Bg}\) respectively, and the intersection area between \(P\left( z\left( x,y\right) \mid \text {Fg}\right)\) and \(P\left( z\left( x,y\right) \mid \text {Bg}\right)\) are shown. This table highlights that correctly predicted samples exhibit a higher average \(P\left( z\left( x,y\right) \mid \text {Fg}\right)\) value compared to misclassified samples. In addition, they display a lower average \(P\left( z\left( x,y\right) \mid \text {Bg}\right)\) value, which suggests that the model is focusing on regions akin to those a dermatologist would examine when diagnosing the lesion.
To complement the descriptive analysis of Grad-CAM conditional distributions for correctly and incorrectly classified cases (upper part of Table 4), we performed an image-wise statistical comparison between activations inside and outside the dermatologists’ masks in the energy domain \(z^2(x,y)\). As reported in the lower part of Table 4, statistically significant differences between foreground and background energy were observed in 328/334 images (98.2 %) at \(\alpha = 0.05\), with 322/334 images (96.5 %) remaining significant after Bonferroni correction and 328/334 images (98.2 %) after FDR (Benjamini–Hochberg) correction. The corresponding mean Cohen’s d of 1.972 indicates a very large effect size, confirming that Grad-CAM concentrates substantially more energy within the region of clinical interest than in the surrounding background and providing strong statistical evidence for the foreground–background activation contrast.
The DICE and Jaccard coefficients are commonly used to evaluate accuracy. However, in this study, these metrics were not applicable due to the significant difference in detail between manual segmentations by specialists and the more generalized regions highlighted by Grad-CAM (Fig. 4). Activation maps tend to cover larger areas than the precise segmentations, making these coefficients less representative for assessing model performance.
Fig. 3The alternative text for this image may have been generated using AI.
Multi-panel visualization demonstrating the clinical validation of Grad-CAM activations against expert segmentations. (a) displays the original dermoscopic image with the expert segmentation boundary (red contour) delineating the clinically relevant lesion region; (b) shows the corresponding Grad-CAM heatmap indicating regions of highest model activation (intensity scale from low to high); (c) overlays the dermatologist’s manual segmentation on the Grad-CAM heatmap to assess spatial alignment; panel (d) presents the conditional probability density functions comparing Grad-CAM activation distributions inside (blue curve) versus outside (orange curve) the clinically relevant regions. The clear separation between distributions demonstrates that the model’s attention is appropriately focused on dermoscopically significant areas identified by clinical experts. This example illustrates a correctly predicted BCC case where the model’s decision-making aligns with clinical diagnostic criteria.
Table 4 Summary of Grad-CAM descriptive statistics and energy-based validation inside and outside the region of clinical interest.
However, additional information for validation is provided. For this study, the segmentations of individual BCC patterns (see Database) were combined into a single segmented image, as shown in Fig. 4. The manual segmentations were then overlayed with activation maps to validate the clinical information provided by Grad-CAM. This not only confirmed whether the network is correctly trained in BCC/non-BCC detection, allowing us to use that spine for pattern detection as previously explained, but also identified the dermoscopic pattern of that region verifying if indeed clinical XAI is working correctly.
Fig. 4The alternative text for this image may have been generated using AI.
Comprehensive example of the specialist segmentation process for pattern-based clinical validation. (a) shows the original dermoscopic image with multiple BCC patterns present; (b) displays the complete integrated segmentation combining all clinically relevant patterns identified by the dermatologist; (c)–(f) show individual pattern segmentations for Maple Leaf-like appearance (two instances), Ovoid Nests, and Multiglobules. This systematic segmentation approach enables pixel-level validation of the model’s attention mechanisms against clinically defined regions, ensuring that the AI tool’s visual explanations align with expert dermatological knowledge. The red contours indicate manually segmented regions of clinical interest used for quantitative comparison with Grad-CAM activation maps.
The conditional-PDF analysis shows that correctly classified lesions exhibit significantly higher activation inside clinically relevant regions than outside, reinforcing Grad-CAM as a trustworthy, clinically aligned explanation tool for BCC detection.
Model selection and deployment considerations
A critical consideration in developing AI tools for clinical deployment is the balance between model performance and computational efficiency. In the context of teledermatology for primary care settings in Andalusia, where hardware resources are often limited and real-time inference is essential, we selected MobileNet-V2 as the backbone architecture. To validate this architectural choice, we compared its performance against more complex state-of-the-art architectures, specifically ConvNext Tiny and Vision Transformer (ViT-Base B/16), using the same training protocol and dataset.
Table 5 presents a comparative analysis of these architectures. While ConvNext Tiny and ViT-Base contain 8x and 25x more parameters respectively, and require 15x and 59x more computational operations (FLOPs), they do not provide meaningful improvements in pattern detection performance–the most challenging aspect of our task given the limited samples for minority BCC patterns. In fact, MobileNet-V2 achieves comparable or superior pattern detection accuracy (0.82) compared to ConvNext Tiny (0.77) and ViT-Base (0.78), despite being significantly more lightweight.
Table 5 Comparison of model architectures for BCC pattern detection and computational efficiency.
This finding is particularly significant for clinical deployment: MobileNet-V2’s compact size (14 MB) and minimal computational requirements enable rapid inference on standard clinical workstations without requiring specialized GPU hardware, making it practical for integration into primary care workflows. The ability to deploy an effective diagnostic aid system without substantial infrastructure investment is essential for widespread adoption in resource-constrained healthcare settings. Our results demonstrate that architectural efficiency and clinical deployability need not come at the cost of diagnostic performance, particularly when the model is designed with domain-specific considerations such as pattern-based reasoning and clinical validation.
