


The research presented here complies with all relevant ethical regulations; human and animal study protocols were approved by the Queen’s University Belfast (QUB) Faculty Research Ethics Committee or the Animal Welfare and Ethical Review Body.
Cell culture
The HCT116 CRC cell line was obtained from ATCC. Other cells were provided by co-authors or collaborators (SW480 and HT29 were provided by McDade and Longley (QUB); U2OS was provided by Butterworth (QUB); hMSC was provided by Ryan (University of Galway); and 143B mitochondrial cybrids were provided by Greaves (University of Newcastle)). Cells were maintained in DMEM (HCT116, SW480, U2OS), MEM-α with 1 ng ml−1 fibroblast growth factor 2 (Peprotech, hMSC) or DMEM with 1% non-essential amino acid (Gibco) and 50 μg ml−1 uridine (Sigma-Aldrich) supplementation (143B), with 10% dialysed foetal bovine serum (dFBS), 50 U ml−1 penicillin and streptomycin (ThermoFisher, 15070063) and 1 mM sodium pyruvate (ThermoFisher, 11360070). Cell lines were maintained at 37 °C in a humidified incubator with 5% CO2 and routinely tested for mycoplasma using MycoAlert Kit (Lonza). 5FU-resistant HCT116 cells were generated by chronic exposure to 5FU. Glucose/galactose adapted cells were cultured in DMEM containing 10% dFBS, 100 U ml−1 penicillin and 100 μg ml−1 streptomycin, 1 mM sodium pyruvate and 25 mM glucose (Sigma-Aldrich, G7021-1KG) or 25 mM galactose (Sigma-Aldrich, G5388-500G) for a minimum of 1 month before being used experimentally. siRNA transfections were performed using Lipofectamine 2000 and ON-TARGETplus Human SMARTpool siRNAs (Dharmacon) against TYMS and a scrambled control pool, according to the manufacturer’s instructions.
Organoid culture
Organoid lines were generated by Sansom (CRUK Scotland Institute) and Kerr (QUB) labs from AKP mice (Villin-CreERT2; Apcfl/fl; KrasG12D/+; Trp53fl/fl) as previously described20,91 3 days post i.p. administration of tamoxifen (80 mg kg−1). Organoids were resuspended in Matrigel (Corning), plated in six-well plates and supplemented with Advanced DMEM/F-12 medium (ADF; ThermoFisher, 11320033) with 2 mM L-glutamine, 10 mM HEPES (Sigma-Aldrich, H3375-25g), 50 U ml−1 penicillin–streptomycin, 1× B27 (ThermoFisher, 12587-010), 1× N-2 (ThermoFisher, 17502-048), 50 ng ml−1 EGF (Peprotech, AF-100-15) and 100 ng ml−1 Noggin (Peprotech, 250-38). 5FU-resistant organoids were generated through chronic exposure to 5FU. To evaluate the effect of CI inhibition on growth, organoids were seeded as fragments in Matrigel and treated the following day with water (CTRL), 5 μM 5FU, 3 mM metformin or a combination of 5FU and metformin for 72 h. Organoid diameter was measured using ImageJ, and the average was calculated.
2D CRC cell line was obtained by dissociating organoids cultured in Matrigel on a six-well plate. Organoids were incubated in Cell Recovery solution (354253) for 30 min at 4 °C. The recovered organoids were incubated in a 1:1 ratio with TypLE Express (1×; 12605-010) at 37 °C for 5 min after vigorous pipetting. This solution was neutralized with ADF supplemented with 2 mM L-glutamine, 20% FCS and 50 U ml−1 penicillin and streptomycin. After more vigorous pipetting, cells were pelleted by centrifugation at 400 RCF for 5 min and seeded onto a 24-well plate. Media (ADF plus 20% FCS) was changed every 2 days, and cells were split twice a week. Once cells were proliferating, they were moved up to higher cell volumes and adapted to DMEM cell culture media with 20% dFBS, 50 U ml−1 penicillin and streptomycin and 1 mM sodium pyruvate for at least 1 week before experimental setup.
Cell reagents
Cells and organoids were treated with the following compounds as indicated: 5FU (Abcam, ab142387-5g; 0.5–5 µM), metformin (Cayman Chemicals, 13118; 0-50 mM), IACS-10759 (Selleckchem, S8731; 0–50 μM), zVAD-fmk (Sigma-Aldrich, 627610; 10 µM), siTYMS, siUCK2 and siSC siRNA SMARTpools (L-004717-00-0005, Horizon Discovery; 10 nM), oxaliplatin (Belfast City Hospital, 1 µM), SN38 (Selleckchem, S4908; 5 nM), methotrexate (Merck, M1000000, Batch 8.0; 15 nM), pemetrexed (Merck, PHR1596, lot LRAC1932; 0.5 µM), raltitrexed (Selleckchem, S1192, lot S119204; 5 nM), BAY-2402234 (Cambridge Bioscience, CAY33259-1mg; 20 nM), rapamycin (Sigma-Aldrich, 553210; 10 µM), Torin1 (100 nM, kindly gifted by the Jafarnejad lab at QUB) and uridine (Merck, U3003; 30 µM).
Cell viability by SRB
Cell viability was measured using sulforhodamine B (SRB; Sigma-Aldrich, S1402-5G)92. For the SRB assay, cells were seeded (5,000 cells per well) in a 96-well plate and then treated with the indicated drugs. At the experimental endpoint, the cells were fixed with 10% trichloroacetic acid (Sigma-Aldrich, T6399-500G) and stained with 0.05% SRB for 1 h and then washed repeatedly with 1% acetic acid. The protein-bound dye was dissolved in 10 mM Tris base solution (ThermoFisher, 15504-020) to obtain a reading at 510 nm. The effect on cell growth was assessed as a percentage of cell viability, with vehicle-treated cells considered 100% viable. The IC50 of each drug was calculated using GraphPad software.
High-content fluorescent microscopy
This method was used to assess concurrent growth arrest and apoptotic cell death in response to mitochondrial inhibitors with or without 5FU. Cells were seeded into a 384-well glass-bottom black plate (IBL, P384-1.5H-N) and left to adhere overnight. After 72 h treatments, 0.5 μg ml−1 propidium iodide (Sigma-Aldrich, P4864) and 1.4 μg ml−1 Hoechst 33342 (Invitrogen, H3570) were added to cells. Images were then taken on the ArrayScan XTI Live High Content Platform (ThermoFisher). Drugs were normalized to paired vehicle controls, followed by 0 µM 5FU. GraphPad Prism was used to calculate the area under the curve (AUC) for both parameters with or without 5FU, and then the difference in AUC was calculated as (AUC +5FU) − (AUC −5FU). A negative value for the valid object count signifies synergism of the CI inhibitors and 5FU, with the opposite true for per cent propidium iodide. Growth arrest was determined as 1 − average fraction of control.
Mitochondrial profiling
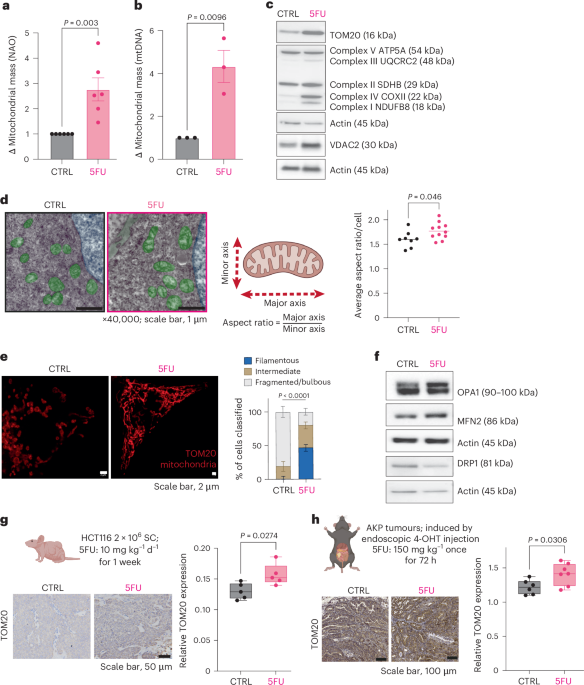
Cells were stained with NAO (ThermoFisher, A1372), tetramethylrhodamine, ethyl ester perchlorate (TMRE; Sigma-Aldrich, 87917) and MitoSOX Red (ThermoFisher, M36008). NAO (200 nM) or TMRE (25 nM) was added to the culture medium and incubated for 1 h at 37 °C in 5% CO2. MitoSOX Red (5 µM) was added to the medium and incubated for 30 min at 37 °C in 5% CO2. Cells were washed, collected and resuspended in 0.3 ml of PBS. Cells were analysed by flow cytometry using a BD LSR II instrument. Cells were gated for singlets, and the GeoMean NAO, TMRE or MitoSOX Red fluorescence was evaluated using FlowJo software.
Genomic DNA was isolated using buffer (100 mM Tris-HCl, 5 mM EDTA, 0.2% SDS, 200 mM NaCl + proteinase K) and precipitation with isopropanol. Real-time PCR was conducted to quantify the mitochondrial DNA relative to nuclear DNA as previously reported. A total of 250 ng of target DNA was used per reaction. Primer sequences are available in the Supplementary Table 2).
Extracellular flux analysis in NDI1 overexpressing cells
The Agilent Seahorse XF96 system was used to assess extracellular flux. Overexpression of NDI1 in HCT116 was achieved by transfecting 1 × 10⁶ cells with plasmid PXMS-NDI1 DNA (PMXS-NDI1 was a gift from D. Sabatini (Addgene, plasmid 72876; http://n2t.net/addgene:72876; RRID:Addgene_72876)) for 48 h before seeding for flux analysis at 10,000 cells per well and allowed to adhere overnight in full culture media under normal conditions. Probe plates were prepared by adding 200 μl of PCR-grade H2O, and calibration buffer was added to a 50 ml Falcon tube. Both were incubated overnight at 37 °C, without CO2. The following day, assay media was prepared by supplementing specialized DMEM pH 7.4 (Agilent, 103575-100) with 10% dFBS, 1% penicillin–streptomycin, 25 mM glucose and 2 mM L-glutamine. The 96-well assay plate media was then replaced with 180 μl per well of freshly prepared assay media, and the plate was incubated at 37 °C, no CO2, for 1 h to eliminate residues of carbonic acid. The H2O was replaced with 200 μl XF calibrant in the probe plate, and it was incubated at 37 °C, no CO2, for 1 h. The probe plate was then prepared with mitochondrial inhibitors: 25 μl 5 μM rotenone (Sigma-Aldrich, 45656) and 5 μM antimycin A (Sigma-Aldrich, A0149). The probe plate was then inserted into the Seahorse XF analyser and, after 15 min of calibration, the cell plate was inserted into the analyser. OCR was determined by six measurement cycles before and after injection: 3 min mixing, 3 min waiting and 3 min measuring. Results were normalized to SRB.
Mitochondrial complex activity
The enzyme activity of CI was determined by a colourimetric analysis following the manufacturer’s protocol (Abcam, ab109721). A Seahorse XFe96 Analyser (Agilent Technologies) was used to assess mitochondrial complex-specific OCR of HCT116 CRC cells. In brief, 3,000 cells were seeded in a 96-well Seahorse culture plate, with six wells included per biological replicate. These were allowed to adhere overnight in full culture media (DMEM (41965039) with 4 mM L-glutamine, 10% dFBS (26400044), 1 mM sodium pyruvate (11360039) and 50 U ml−1 penicillin–streptomycin (15070063)) under normal cell culture conditions. After 24 h, fresh cell media with or without 5FU was applied to the cells and the cells were treated for a further 72 h. The day before the assay, Seahorse probe plates were prepared by adding 200 μl distilled water, and calibration buffer was added to a 50 ml Falcon tube. Both were incubated overnight at 37 °C, without CO2. On the day of assay, the mannitol and sucrose (MAS) buffer (1×) was prepared by diluting sterile-filtered MAS 3× in distilled water, resulting in a solution with the following final concentrations: 220 mM mannitol, 70 mM sucrose, 10 mM KH2PO4, 5 mM MgCl2, 2 mM HEPES, 1 mM EGTA and 0.2% w/v fatty-acid free BSA (3117057001) (pH 7.2), and warmed to 37 °C. Approximately 45 min before running the assay, the distilled water in the probe plate was replaced with 200 μl XF calibrant and incubated at 37 °C, no CO2. The probe plate was then prepared with the substrates and mitochondrial inhibitors to probe the OCR driven by specific ETC complexes. For CI assessment, 20 μl pyruvate (107360; 50 mM), malate (M0875; 25 mM), ADP (A5285; 10 mM) and plasma membrane permeabilizer (102504-100; 10 nM) were added to port A, 22 µl oligomycin (O4876; 10 µg ml−1) was added to port B and 25 µl rotenone (10 µM) was added to port C. For CII assessment, 20 µl succinate (100 mM), ADP (10 mM), rotenone (10 µM) and plasma membrane permeabilizer (10 nM) were added to port A, 22 µl oligomycin (10 µg ml−1) was added to port B and 25 µl antimycin A (A0149; 200 µM) was added to port C.
The probe plate was inserted into the Seahorse XF analyser to begin assay calibration. To minimize the time that cells are kept in MAS buffer, just before calibration finished, the cell media was removed, and the cells were washed once with MAS (1×) buffer before addition of 180 µl MAS (1×) buffer. Once calibration had finished, the cell plate was inserted into the analyser, and OCR was determined at basal and mitochondrial stress conditions by triplicate measurement cycles of 0.5 min mixing, 0.5 min waiting and 2 min measuring, carried out at baseline and after each port injection. No equilibration step was included before measurements. Results were normalized to either average SRB staining on a surrogate cell culture plate or to cell confluency measurements obtained on the Incucyte (Sartorius). State 3 respiration was calculated as the first OCR measurement after substrate injection minus the first OCR measurement after rotenone (for CI) or antimycin A (for CII) injection (measurement 4 − measurement 10).
Cytochrome c release assay
Cells were fractionated to obtain cytoplasmic and mitochondria-enriched fractions using Dounce homogenization and differential centrifugation as per the Abcam cytochrome c release kit (ab65311). Immunoblotting was performed with 10 µg of cytoplasmic and mitochondrial-enriched lysate as per the immunoblotting methods described below relative to whole-cell lysates.
Immunoblotting
Cells were washed with PBS and lysed with lysis buffer (150 mM NaCl, 20 mM EDTA, 50 mM Tris-HCl, 0.5% NP-40) containing protease and phosphatase inhibitors. Protein concentration was determined by BCA assay (ThermoFisher). After addition of loading buffer, lysates were vortexed, and supernatants were heated to 95 °C for 5 min. Equal amounts of protein lysates were loaded on Novex WedgeWell Tris-glycine or Bis-Tris gels (ThermoFisher) and blotted onto nitrocellulose or PVDF Trans-Blot Turbo membrane (0.2 µm, Bio-Rad) according to standard protocols. Membranes were incubated with the appropriate primary antibody overnight at 4 °C. Antibody details can be found in the Supplementary Table 1. Membranes were washed three times with PBS-T and incubated for 1 h at 20–22 °C with the corresponding horseradish peroxidase-labelled secondary antibodies: goat anti-rabbit IgG (H + L) (Vector Laboratories, BA-1000; 1:2,000) and rabbit anti-rat IgG (H + L) (Vector Laboratories, BA-4000; 1:2,000). Protein expression was analysed and detected using the Western Lightning Plus-ECL, Enhanced Chemiluminescence Substrate (PerkinElmer, NEL105001EA) and G:BOX ChemiXX6 gel doc system with GeneSys image software (Syngene). A representative loading control (actin/vinculin) is shown in each figure, with panels from Figs. 3g and 8f generated concurrently. Densitometry was completed using ImageJ/FIJI. Blots shown are representative of three or more independent experiments, with specific repeats detailed in each figure legend and shown and quantified in the Source data file.
LC–MS metabolomics analysis
Sample preparation
HCT116s cells (1 × 10⁵) treated with or without 5 μM 5FU were cultured in DMEM for 24 h and 72 h or supplemented with media containing uniformly labelled 13C6-glucose (25 mM) for 6 h before sampling. At room temperature, media was removed, and cells were washed twice with 0.9% NaCl (aq). On ice, cells were scraped and collected in extraction buffer containing methanol:acetonitrile:H2O (4:4:2), 15 µM glutaric acid and 0.5% formic acid. This mixture was left on ice for 5 min before addition of neutralization buffer (final concentration, 0.17 mM ammonium carbonate (5330050050) in LC–MS-grade H2O) and gently mixed before being incubated on dry ice for 15 min. The samples were thawed on ice, centrifuged at 15,700 RCF for 5 min at 4 °C and the supernatant was collected for downstream processing. Samples were dried using an Eppendorf Concentrator Plus at 30 °C for up to 7 h. Samples were reconstituted in 100 μl 50% acetonitrile (aq) before centrifugation at 300g. The supernatant was transferred to vials for MS analysis.
Targeted LC–MS analysis
Samples were analysed using an Agilent Infinity II HPLC and an Agilent G6545A quadrupole time-of-flight mass spectrometer. Separation was achieved on a Waters Premier BEH Z-HILIC column (1.7 µm, 2.1 ×150 mm) using 20 mM ammonium bicarbonate solution with 0.1% ammonium hydroxide and 0.1% InfinityLab deactivator as mobile phase A and H2O/ACN (1:9 ratio) with 0.1% InfinityLab deactivator as mobile phase B. The LC flow was set at 0.2 ml min−1, and the gradient was as follows: 10% A held for 2 min, 35% A at 18 min, 70% A at 22 min, 90% A at 22.1 min and held for 2.9 min, 10 % A at 25.1 min and held for 5 min. Data were post-processed using Agilent MassHunter Profinder 10. Normalization of data to an internal standard was performed using an in-house R script, then values were normalized to protein content per treatment condition. Retention times for non-natural metabolites, including 5FU, were determined by single compound reference sample analyses, and both molecular weight and retention times were used for analysis in larger LC–MS experiments.
13C6-glucose labelling analysis
LC separation was performed using an Agilent InfinityLab Poroshell 120 HILIC-Z (2.1 ×100 mm, 2.7 μm), PEEK-lined column on an Agilent G7167B and G7120A multisampler and pump, respectively. Separation was achieved using a gradient of 10 mM ammonium acetate in water (mobile phase A; pH 9.0) and 10 mM ammonium acetate in 90% acetonitrile (aq) (mobile phase B (MPB); pH 9.0). The flow rate was maintained at 0.5 ml min−1, and the gradient was as follows: 0.0 min 100% of MPB, 0.0–11.5 min 70% of MPB, 11.5–12.5 min 60% of MPB and 12.5–15.5 min 100% of MPB. The mass spectrometer (Agilent Dual ESI G6545B quadrupole time-of-flight) was operated in negative ion mode. Spectra were analysed using Agilent MassHunter Qualitative Analysis and Agilent MassHunter Profinder software by referencing to an internal library of compounds. Relative metabolite abundance was calculated as the percentage of the total metabolite pool.
Mitochondrial imaging
Immunofluorescence
Imaging was performed on a STED-capable Stellaris DMI8 platform (Leica). Cells were prepared and stained as per the Leica protocol (https://www.leica-microsystems.com/science-lab/life-science/the-guide-to-sted-sample-preparation). In brief, cells were plated onto coverslips and treated with or without 5FU at the indicated doses for 72 h. Cells were fixed with 2% paraformaldehyde (15 min), permeabilized with 0.1% Triton X-100 (10 min) and blocked with 2% BSA (1 h). Primary antibody rabbit anti-TOM20 (Abcam, ab186734; 1:500) or mouse anti-DNA (Progen, 61014; 1:500) was incubated overnight at 4 °C. Secondary antibody donkey anti-rabbit Alexa Fluor 555 (Invitrogen, A31572; 1:500) or goat anti-mouse Alexa Fluor 488 (Invitrogen, A11001; 1:500) was incubated for 1 h at room temperature. Coverslips were mounted onto glass slides using ProLong Gold anti-fade mountant (Invitrogen, P36930). Imaging took place at least 24 h after mounting.
Transmission electron microscopy
HCT116 cells were treated with 5 µM 5FU for 72 h before being pelleted and fixed with 3% glutaraldehyde (Agar Scientific) in cacodylate (CACO). Cells were then washed three times for 10 min each in CACO buffer. Cells were post-fixed for 1 h with 1% osmium tetroxide (Agar Scientific) in CACO buffer, dehydrated in a graded series of methanol and embedded in LR white resin. Samples were sectioned using an ultramicrotome (Leica EM UC6) to 60–90 nm, transferred to copper grids and left to dry before imaging. Electron micrographs were obtained using a transmission electron microscope (Hitachi) at ×40,000 magnification. Analysis was carried out using ImageJ software. Images with fewer than five mitochondria were discounted. The number of cristae was manually counted. The aspect ratio was calculated as major axis/minor axis.
BH3 profiling
HCT116 cells were treated with 5 µM 5FU for 24 h. BH3 profiling was then performed using whole-cell (JC-1) plate-based fluorimetry. BH3 peptides/mimetics in DTEP buffer (300 mM trehalose, 10 mM HEPES-KOH, 0.1% w/v BSA, 1 mM EDTA, 1 mM EGTA, 80 mM KCl, 5 mM succinate, final pH 7.4) were plated at 70 μM l−1 (unless otherwise stated) in triplicate in a black 384-well plate. The sequence of the BH3 peptides has been previously reported93,94. HCT116 cell lines were collected, washed and resuspended in DTEP buffer. An equal volume of dye Mastermix (1 μM JC-1, 0.005% digitonin, 10 μg ul−1 oligomycin, 5 mM β-mercaptoethanol in DTEP buffer) was added, and after 10 min at room temperature, the cells were added on top of the peptide template at a concentration of 40,000 cells per well. Mitochondrial potential loss was measured using the Varioskan kinetic plate reader at excitation 545 nm and emission 590 nm for 3 h at 21 °C (kinetic measurements every 5 min). Mitochondrial depolarization was normalized to dimethyl sulfoxide control (0%) and positive control FCCP (carbonyl cyanide 4-(trifluoromethoxy)phenylhydrazone; 100%).
Gene expression profiling
Sample preparation and RNA-seq
Total RNA was extracted from HCT116 cells and AKP organoids using the Roche KAPA RNA HyperPrep kit with RiboErase, according to the manufacturer’s protocol. The kit is designed for NGS library construction from 25 ng to 1 μg of total RNA and depletes both cytoplasmic (5S, 5.8S, 18S and 28S) and mitochondrial (12S and 16S) ribosomal RNA species. Library quality control was performed on the fragment analyser (HS NGS kit) and Qubit. Finally, the libraries were sequenced using the Illumina NovaSeq 6000 sequencing system. The indexes used for these libraries were from the KAPA Unique Dual-Indexed Adapter kit.
Data analysis
RNA-seq reads were aligned to the human genome (hg37) using the STAR aligner, and the number of reads mapping to genes annotated in Gencode build 37 (v22) was calculated using HTseq. DEGs were identified using the DESeq2 R package, and results were visualized as a volcano plot using the ggplot2 R package (https://ggplot2.tidyverse.org). Metabolic genes were defined based on a curated list6,40. GSEA was performed using the clusterProfiler and msigdbr R packages (https://CRAN.R-project.org/package=msigdbr). Heatmaps were generated using Morpheus (Broad Institute). All data were generated from at least two pseudo-biological replicates per timepoint.
Taxonomy cohort
The gene expression series matrix was downloaded directly from GEO using accession number GSE103479. The datasets had already been robust multi-array average-normalized in batches using the makecdfenv, affy and limma R packages, and batch-corrected using the ComBat method in the sva R package. Patients were subdivided by whether they received surgery alone or adjuvant 5FU-based chemotherapy and subsequently grouped based on the median overall survival into either ‘good outcome’ or ‘poor outcome’. Overall survival comparisons were performed by Kaplan–Meier analysis using log-rank testing for patients separated based on the mean OxPhos score generated using single-sample GSEA. Both cohorts (surgery or surgery + adjuvant 5FU-based chemotherapy) used patient data from males and females.
Real-time PCR
Total RNA was isolated from the cells using the Roche High Pure RNA isolation kit (Roche Life Science, 11828665001) and reverse transcription was performed using the iScript cDNA synthesis kit (Bio-Rad, 1708891) according to the manufacturer’s instructions. Quantitative PCR assays were performed using 480 SYBR Green Master reagent mix (Roche Life Science, 4707516001, murine probes) or TaqMan assays (human ETC genes) on a real-time fluorescence qPCR instrument (LightCycler 480II, Roche Life Science). The expression of relative mRNA was normalized to that of the housekeeping gene 18S.Primer sequences used are provided in Supplementary Table 2.
In vivo studies
Experimental work
Animals were maintained under specific-pathogen-free conditions and in compliance with the Northern Ireland Department of Health (under PPL 2874 and 2960) regulations with approval from the QUB Animal Welfare and Ethical Review Body. Mice were housed with no more than five animals per cage and were kept on an ad libitum diet. Husbandry conditions included a temperature of 21–23 °C; humidity in, between 43% and 48%; humidity out, between 50% and 59%; light cycle of 12 h light to 12 h dark; and chow diet T.2918.4x5R sourced from Inotiv. Sample sizes are shown in the figures or legends, based on power calculations for output measurement to detect P < 0.05 with 80% power. Data were assumed to be normally distributed. GEMM studies used both male and female mice induced at 8–10 weeks old, but xenograft studies used only females, transplanted at 8 weeks old.
For human xenograft studies, 2 × 10⁶ HCT116 cells were transplanted 1:1 in Growth Factor Reduced Matrigel (Corning, CLS356231) into athymic nude mice (purchased from Inotiv), and the volume was calculated using the formula ½(a × b2). When tumours reached ~100 mm3 on average per genotype, animals were randomized by ranked allocation across all groups and given 5FU (10 mg kg−1), metformin (250 mg kg−1) or vehicle (PBS) daily by i.p. injection (5FU) and oral gavage (o.g.) administration (metformin) for 11 days. The growth limit was tumour Geometric Mean Diameter of <10, and no tumour exceeded this measurement. Data collection and analysis were not performed blind to the conditions of the experiments, given the expertise required and the number of operators. Digital pathology analysis was completed by two independent researchers to ensure consistency.
For GEMM studies, intestinal tumours were generated through i.p. injection of 80 mg kg−1 tamoxifen in 8–10-week-old A(Het)KP mice (Villin-CreERT2; Apcfl/+; KrasG12D/+; Trp53fl/fl) or intracolonic induction of colon tumours by submucosal injection of 100 μM 4-hydroxytamoxifen (Sigma-Aldrich) in 8–10-week-old AKP mice (Villin-CreERT2; Apcfl/fl; KrasG12D/+; Trp53fl/fl). Treatment was initiated in mice when they displayed clinical signs characteristic of intestinal tumour burden as defined in the relevant licensing documents (for example, hunching, bloody stools). Mice of both sexes were randomly assigned to cohorts and received a single dose of indicated compounds: vehicle (PBS) by i.p. and/or o.g.; 250 mg kg−1 metformin (o.g.) alone; and 150 mg kg−1 5FU (i.p.) alone or in combination with metformin. After 72 h, mice were killed, and tissue was collected. Only animals with no tumours at endpoint were excluded from analysis. For survival analysis, AKP tumour-bearing mice were generated as above, and 26 days after induction, they were treated with 150 mg kg−1 5FU (i.p.) ± 250 mg kg−1 metformin (o.g.) three times weekly. Animals were killed at the clinical endpoint, and survival was analysed by the Kaplan–Meier method.
Tissue preparation, staining and analysis
Intestinal tissues were flushed with PBS and fixed as a Swiss roll in 10% buffered formalin overnight. The tissues were then transferred to 70% ethanol before processing for embedding. All haematoxylin and eosin and immunohistochemistry staining was performed on 5 μm formalin-fixed, paraffin-embedded sections that had previously been heated at 55 °C for 45 min.
Standard protocols were used for haematoxylin and eosin staining. Slides were deparaffinized and dehydrated, and antigen retrieval was performed using either Tris-EDTA or sodium citrate buffer as recommended by the antibody supplier. The slides were then stained with a standard tertiary method: incubated with indicated primary antibodies (TOM20 (Abcam, ab186734; 1:200), VDAC2 (ThermoFisher, PA5-28106; 1:500) and CC3 (Cell Signaling Technology, 9661L; 1:200)) at 4 °C overnight, followed by goat anti-rabbit IgG (H + L) (Vector Laboratories, BA-1000; 1:200) for 1 h and then streptavidin–horseradish peroxidase tertiary antibody (Vector Laboratories, SA-5004; 1:200) for 30 min. Samples were further stained with a DAB kit (Abcam, ab64238) and counterstained with haematoxylin. Images were acquired using brightfield microscopy with a ×20 or ×40 objective lens and analysed using QuPath (v0.5.1). For TOM20/VDAC2 quantification, stain vectors were established for each image, and the mean DAB intensity was calculated for each tumour and mouse. To assess tumour and stroma staining, pixel classification was carried out on each sample to identify tumour and stroma regions. Positive cell detection was used to quantify CC3 staining in tumour samples, calculated from DAB optical density mean.
CRISPR
GeCKO Library V1 single-guide (sgRNA) library/pool targeting 17,419 genes was a kind gift from the Zhang laboratory. The library was amplified, and lentivirus was produced and titred with adaptations as described previously95. In brief, HCT116 cells were infected with the GeCKO v1 human CRISPR knockout pooled library using lentiviral transduction at a multiplicity of infection of 0.3, and populations stably expressing gRNAs were selected for using puromycin and expanded for 8 days to allow for essential gene drop-out. Then, 30 × 106 cells were collected (representing an estimated coverage of 300×), and 30 × 106 cells were plated for treatment the next day with either 5 μM 5FU or media only for a further 11 days. Cells were passaged when they reached 70–80% confluence, again maintaining 30 × 106 cells at each serial passage, with 5FU added in fresh media every 3 days. DNA was extracted and sgRNA inserts amplified as previously described95. Adaptors were trimmed from de-multiplexed FASTQ files using Cutadapt (https://pypi.python.org/pypi/cutadapt), aligned to the Gecko V1 design file, and count tables were generated with MAGeCK software V5. Positively and negatively selected sgRNAs were identified at sgRNA, gene and pathway levels using the MAGeCK RRA algorithm.
Statistical analysis
Data were visualized and statistical analyses performed using Prism 9.5.1 software (Graph Pad). P < 0.05 was considered statistically significant. In all cases, experimental groups showed comparable variance. P values for unpaired comparisons between two groups with comparable variance were calculated by two-tailed Student’s t-test. One-way ANOVA with Dunnett’s, Šídák’s or Tukey’s multiple comparisons was used for analysis between datasets with one independent variable. Ordinary two-way ANOVA was used for analysis that involved two independent variables, followed by Šídák’s or Tukey’s post hoc test for individual comparisons. Kaplan–Meier comparison was used for analysis of survival cohorts. RNA-seq gene expression data were analysed using a negative binomial generalized linear model (DESeq2). On the figures, asterisks indicate significance (*P < 0.05, **P < 0.01, ***P < 0.001, ****P < 0.0001); error bars indicate s.d. or s.e.m., as indicated.
Reporting summary
Further information on research design is available in the Nature Portfolio Reporting Summary linked to this article.
