


Study design
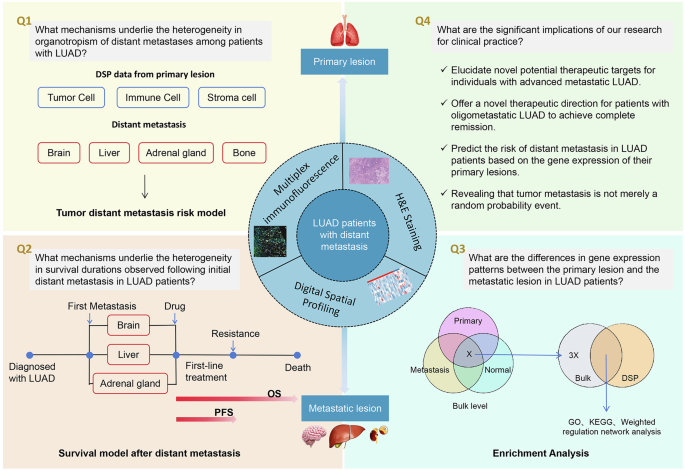
This study included a total of 52 LUAD patients. Matched samples were collected from 23 pairs of brain metastases and corresponding primary tumors, 26 pairs of liver metastases and primary tumors, and 3 pairs of adrenal metastases and primary tumors. Sufficient adjacent normal tissue samples were also collected from each metastatic group to serve as controls. Multiplex immunofluorescence (mIF) staining was performed on each sample, and three distinct regions of interest (ROIs)—tumor, immune, and stromal compartments—were defined for each sample prior to DSP analysis. The data obtained were compiled into an expression matrix for subsequent analysis.
Clinically, for patients without distant metastasis, only primary tumor samples are available for predicting the risk of future metastasis. On the basis of these observations, we hypothesized that the transcriptomic profile of the primary tumor encodes organotropism for metastasis. By integrating transcriptomic data from the primary tumors of all 52 patients with corresponding clinical information, we constructed random forest models to predict the risk of metastasis to the brain, liver, bones, and adrenal glands. We subsequently investigated the key differentially expressed genes (DEGs) and their interrelationships between metastatic and primary foci through the integration of DSP platform data.
Postmetastatic survival represents another critical clinical concern. We hypothesized that genes influencing postmetastatic survival are not randomly distributed but rather are enriched among the DEGs between primary and metastatic tumors. Potential key genes were identified through paired Wilcoxon test analysis of DSP data from matched tumor samples and were further validated using random forest survival models.
Furthermore, on the basis of the results of mIF staining, this study analyzed the correlation between the proportions of various immune cell types within the tumor immune microenvironment (TIME) and the risk scores generated by the predictive models.
Finally, we proposed a novel metric termed the HEindex, derived from H&E staining, defined as the average proportion of nontumor cells surrounding each tumor cell. The association between the HEindex and the model-derived risk scores was also evaluated.
A flowchart summarizing the study design is presented in Fig. 1.
Fig. 1
Risk model and identification of key signatures for brain metastasis in LUAD
Using a random forest model, we identified the genes most strongly associated with the risk of brain metastasis in LUAD and determined their cellular localization within the tumor microenvironment. These key genes include FKBP1A and MRPS33, which are expressed in tumor cells; AFAP1L1, ELP6, REC8, PRRG4, MS4A15, CCDC92, and CDCA8, which are expressed in immune cells; and CKAP2, which is expressed in stromal cells. The importance rankings of these genes in the random forest model and their differential expression between the brain metastasis and nonmetastasis groups are presented in Fig. 2a. The brain metastasis risk prediction model based on these genes showed excellent performance in the test cohort, with an area under the curve (AUC) of 0.974 (95%CI: 0.903–1.000), indicating strong discriminative ability (Fig. 2b and Table S1).
Fig. 2
Brain metastasis risk model and differential gene expression between brain metastases and primary lung tumors. a Feature importance heatmap of the brain metastasis risk model. b ROC curve of the brain metastasis risk model. c GSEA1350 pathway enrichment analysis based on all genes ranked by log2FC between the metastatic and nonmetastatic groups or on all genes ranked by Spearman correlation with the model score. d Comparison of immune cell infiltration proportions in primary lung tumors between the brain metastasis group and the nonmetastasis group (Wilcoxon rank-sum test). e Immune cell subsets in primary lung tumors associated with the model risk score. f Spearman correlation analysis between the HEindex and the model risk score. g Venn diagram identifying key overlapping genes. h Enrichment analysis of key genes using the STRING database. i Validation and spatial localization of key genes using DSP data. j Gene regulatory network. Meta metastasis, NA not available
Next, we conducted gene set enrichment analysis (GSEA) on DSP data from different ROIs in primary lung lesions. GSEA based on actual metastasis status revealed that in the tumor and stromal compartments of patients with brain metastasis, pathways related to ECM and metastasis (47/129, 36.4% in tumor; 40/129, 31.0% in stroma), cell death (21/72, 29.2% in tumor; 19/72, 26.4% in stroma), and immunity (111/418, 26.6% in tumor; 76/418, 18.2% in stroma) were significantly enriched. Significant enrichment of cell death (23/72, 31.9%) and immunity (54/418, 12.9%) was also observed in the immune compartment. Further GSEA based on model prediction scores revealed that a high risk of brain metastasis was significantly associated with enrichment of cell death (41/72, 56.9%) pathways in tumor cells and enrichment of cell death (39/72, 54.2%), immune (154/418, 36.8%), genetic and epigenetic information (104/286, 36.4%), and cell cycle (39/127, 30.7%) pathways in the immune compartment and enrichment of cell death (38/72, 52.8%) and immune (127/418, 30.4%) pathways in the stromal compartment (Fig. 2c).
Using mIF staining of primary tumor samples from patients with and without brain metastasis, we compared the infiltration levels of various immune cells between the two groups. Wilcoxon rank-sum tests revealed no significant differences in immune cell infiltration proportions between the two groups (Fig. 2d). Further correlation analysis revealed that the proportions of cancer-associated fibroblast type I (CAFI) and normal fibroblasts (NF) were significantly positively correlated with the model risk score (Fig. 2e). However, no significant correlation was observed between the HEindex derived from H&E staining and the model risk score (Fig. 2f).
To gain deeper insights into the core molecular differences between brain metastases and primary lung tumors, we applied a multitiered screening strategy. First, by integrating differential gene expression from three bulk-level comparisons—metastatic brain tumor vs. normal brain tissue, primary lung tumor vs. normal lung tissue, and metastatic brain tumor vs. primary lung tumor—and taking their intersection, we identified a core set of 78 DEGs (Fig. 2g). Enrichment analysis was subsequently conducted on these 78 genes through the Search Tool for the Retrieval of Interacting Genes/Proteins (STRING) website (https://cn.string-db.org/), and pathways related to protein folding and cell signal transduction were significantly enriched (Fig. 2h). To further understand the function of the 78 DEGs, spatial information from the DSP platform data was introduced into the analysis, ultimately identifying 100 key DEGs with precise spatial localization (Fig. 2i), and the results of pathway enrichment analysis based on the upregulated and downregulated key DEGs of the tumor, immune and stromal compartments are listed in the Supplementary Material (Comprehensive Data and Analysis Results). In the tumor compartment, pathways related to protein folding were upregulated, and pathways related to interferon were downregulated. In the immune compartment, pathways related to protein folding were also upregulated, and pathways related to ribosomes were downregulated. In the stromal compartment, pathways related to neural development were upregulated, and pathways related to collagen were downregulated. On the basis of this set, we constructed a Spearman correlation coefficient-weighted gene regulatory network to explore the interactions among these key genes during brain metastasis (Fig. 2j). This network elucidates potential gene regulatory interactions across distinct tumor compartments, with altered expression levels observed for key regulatory genes as follows: tumor cells exhibited key changes, such as upregulation of HNRNPA2B1, H3C13 and CYCS and downregulation of BST2 and COL3A1; immune cells exhibited upregulation of HSPA8, HSP90AA1, HNRNPA2B1 and HSP90AB1 and downregulation of RPL37, COL3A1, and RPS2; and stromal cells primarily showed downregulation of RPS2, COL3A1, COL5A2, SERPINH1, RPL37, and IFITM1 and upregulation of CCT6A.
Risk model and identification of key signatures for liver metastasis in LUAD
The genes most strongly linked to liver metastasis risk in LUAD are MOCOS, PDGFRB, PDLIM1, HSPA6, RNF11, and LCN2 (tumor cell-specific), along with ADAMTSL2, SPCS1, IGLL5, and CASZ1 (mainly expressed in immune cells). The importance rankings of these key genes in the random forest model and their differential expression between the liver metastasis group and nonliver metastasis group are presented in Fig. 3a. A liver metastasis risk prediction model based on these genes exhibited excellent performance in the test cohort, with an AUC of 0.975 (95%CI: 0.906–1.000), indicating a high level of discriminative accuracy (Fig. 3b and Table S2).
Fig. 3
Liver metastasis risk model and differential gene expression between liver metastases and primary lung tumors. a Feature importance heatmap of the liver metastasis risk model. b ROC curve of the liver metastasis risk model. c GSEA1350 pathway enrichment analysis based on all genes ranked by log2FC between the metastatic and nonmetastatic groups or on all genes ranked by Spearman correlation with the model score. d Comparison of immune cell infiltration proportions in primary lung tumors between the liver metastasis group and the nonmetastasis group (Wilcoxon rank-sum test). e Immune cell subsets in primary lung tumors associated with the model risk score. f Spearman correlation analysis between the HEindex and the model risk score. g Venn diagram identifying key overlapping genes. h Enrichment analysis of key genes using the STRING database. i Validation and spatial localization of key genes using DSP data. j Gene regulatory network. Meta metastasis, NA not available
GSEA results of transcriptomic data from primary tumors of patients without liver metastasis revealed significant enrichment of pathways related to cell death (39/72, 54.2%), metabolism and energy (65/315, 20.6%), and genetic and epigenetic information (59/286, 20.6%) within tumor cells. In the immune compartment, pathways associated with cell death (26/72, 36.1%), immunity (81/418, 19.4%), and genetic and epigenetic information (43/286, 15.0%) were notably enriched. Within the stromal compartment, pathways related to cell death (26/72, 36.1%) and immunity (74/418, 17.7%) were most prominently enriched. Further GSEA based on model prediction scores revealed that a low risk of liver metastasis was significantly associated with the enrichment of cell death pathways in all compartments (21/72, 29.2% in tumors; 29/72, 40.3% in the stroma; and 33/72, 45.8% in the immune cells) (Fig. 3c).
mIF revealed that the proportions of M1 macrophages and myeloid dendritic cells (mDCs) in the primary lung lesions of patients with liver metastasis were significantly greater than those in patients without liver metastasis (Fig. 3d). Correlation analysis further revealed that the proportions of both M1 macrophages and mDCs were significantly and positively correlated with the model risk score (Fig. 3e). However, no significant correlation was observed between the HEindex and the model risk score (Fig. 3f).
By integrating DEGs from three bulk-level comparison sets (metastatic liver tumor vs. normal liver tissue, primary lung tumor vs. normal lung tissue, and metastatic liver tumor vs. primary lung tumor) and identifying their intersection, we identified a core set of 72 DEGs (Fig. 3g). Enrichment analysis was subsequently conducted on these 72 genes through the STRING website, and pathways related to DNA replication-dependent chromatin assembly and nucleosomes were significantly enriched (Fig. 3h). To further understand the function of the 72 DEGs, spatial information from the DSP platform data was introduced into the analysis, ultimately identifying 133 key DEGs with precise spatial localization information (Fig. 3i), and the results of pathway enrichment analysis based on the upregulated and downregulated key DEGs in the tumor, immune and stromal compartments are listed in the Supplementary Material (Comprehensive Data and Analysis Results). In the tumor compartment, pathways related to nucleosomes were upregulated, and pathways related to organic acid binding were downregulated. In the immune compartment, pathways related to apoptosis were also upregulated, and pathways related to angiogenesis were downregulated. In the stromal compartment, pathways related to nucleosomes were also upregulated, and pathways related to angiogenesis were also downregulated. Finally, we constructed a Spearman correlation coefficient-weighted gene regulatory network to explore the interactions among these key genes during liver metastasis (Fig. 3j), revealing the mutual regulatory relationships among different compartments. In tumor cells, genes such as H3C15, H2AC19, H3C2, H4C12, H3C13, RPL36A, RPL38, and CCT5 were upregulated following liver metastasis, whereas genes such as LCN12 and SERPINA5 were downregulated. In the immune compartment, characteristic gene expression changes included the upregulation of RPL36A, NPM1, GSTP1, RPL38, UQCRHL, H3C13, and LDHB, whereas genes such as ECSCR and SERPINF1 were downregulated. In the stromal compartment, notable upregulation was observed for NPM1, H3C2, H3C13, H3C15, RPL38, RPL36A, H4C12, GSTP1, and SLC3A2, whereas genes such as RAMP2, ECSCR and SERPINF1 were downregulated.
Risk model for adrenal gland metastasis in LUAD
The genes most strongly associated with the risk of adrenal metastasis in LUAD include PTGR2 and IGKC, which are localized to tumor cells; ADIG, ASB3, SP5, and MLLT1, which are expressed in immune cells; and IRF3, MSLN, RPS26 and C19orf33, which are present in the stromal compartment. The importance rankings of these key genes in the random forest model and their differential expression between the adrenal metastasis and nonmetastatic groups are summarized in Fig. 4a. An adrenal metastasis risk prediction model constructed on the basis of these genes demonstrated excellent performance in the test cohort, with an AUC value of 0.929 (95%CI: 0.789–1.000), indicating high discriminative ability (Fig. 4b and Table S3).
Fig. 4
Adrenal metastasis risk model and differential gene expression between adrenal metastases and primary lung tumors. a Feature importance heatmap of the adrenal metastasis risk model. b ROC curve of the adrenal metastasis risk model. c GSEA1350 pathway enrichment analysis based on all genes ranked by log2FC between the metastatic and nonmetastatic groups or on all genes ranked by Spearman correlation with the model score. d Comparison of immune cell infiltration proportions in primary lung tumors between the adrenal metastasis group and the nonmetastasis group (Wilcoxon rank-sum test). e Immune cell subsets in primary lung tumors associated with the model risk score. f Spearman correlation analysis between the HEindex and the model risk score. g Venn diagram identifying key overlapping genes. h Enrichment analysis of key genes using the STRING database. i Validation and spatial localization of key genes using DSP data. Meta metastasis, NA not available
The results of the GSEA of the transcriptomic data from the primary tumors of patients with adrenal metastasis revealed no significantly enriched pathways in tumor cells or immune compartments. However, within the stromal compartment of the metastasis group, pathways related to cell death (11/72, 15.3%) were notably enriched. Further GSEA based on model prediction scores also revealed that a high risk of adrenal metastasis was significantly associated with the enrichment of cell death (29/72, 40.3%)-related pathways in the stroma (Fig. 4c).
mIF analysis revealed that the proportion of mDCs in the primary lung lesions of patients with adrenal metastasis was significantly greater than that in patients without metastasis (Fig. 4d). Subsequent correlation analysis revealed that the proportion of plasmacytoid dendritic cells (pDCs) was significantly negatively correlated with the model risk score (Fig. 4e). Moreover, a significant positive correlation was observed between the HEindex and the model risk score (Fig. 4f).
Owing to the unavailability of normal lung tissue from patients with adrenal metastasis, we focused on the intersection of the two gene sets, which yielded 296 key DEGs (Fig. 4g). Enrichment analysis was subsequently conducted on these 296 genes through the STRING website, which revealed that pathways related to apoptosis and oxidoreductase were significantly enriched (Fig. 4h). Although DSP data were incorporated, resulting in the identification of 318 genes with precise spatial mapping (Fig. 4i), the small sample size prevented us from performing weighted regulatory network analysis.
Risk model for bone metastasis in LUAD
The genes most strongly associated with the risk of bone metastasis in LUAD include ARMCX6 and PLPP1, which are localized to tumor cells; DDIAS, POLE, C2CD5, and THAP7, which are expressed in immune cells; and B3GNT5, which is present in the stromal compartment. The importance rankings of these key genes in the random forest model and their differential expression between the bone metastasis and nonmetastasis groups are summarized in Fig. 5a. A bone metastasis risk prediction model constructed on the basis of these genes demonstrated excellent performance in the test cohort, with an AUC value of 0.907 (95%CI: 0.755–1.000), indicating strong discriminative ability (Fig. 5b and Table S4).
Fig. 5
Bone metastasis risk model. a Feature importance heatmap of the bone metastasis risk model. b ROC curve of the bone metastasis risk model. c GSEA1350 pathway enrichment analysis based on all genes ranked by log2FC between the metastatic and nonmetastatic groups or on all genes ranked by Spearman correlation with the model score. d Comparison of immune cell infiltration proportions in primary lung tumors between the bone metastasis group and the nonmetastasis group (Wilcoxon rank-sum test). e Immune cell subsets in primary lung tumors associated with the model risk score. f Spearman correlation analysis between the HEindex and the model risk score. Meta metastasis, NA not available
GSEA of transcriptomic data from primary tumors revealed no significant differences in pathway enrichment between the bone metastasis group and the nonmetastasis group (Fig. 5c). These findings suggest that the propensity for bone metastasis may not be driven by the activation of specific pathways but rather by broader, more fundamental biological processes.
The mIF results revealed that the proportion of M1 macrophages in the primary lung lesions of patients in the bone metastasis group was significantly greater than that in the nonmetastasis group (Fig. 5d). However, subsequent correlation analysis revealed no significant association between the proportion of M1 macrophages and the model risk index score (Fig. 5e). Similarly, the HEindex was not significantly correlated with the model risk score (Fig. 5f).
Owing to the unavailability of bone metastasis lesion tissues from patients, we were unable to investigate differences in gene expression between metastatic and primary lesions.
Survival prediction models for LUAD patients following metastasis
Distant metastasis is often associated with a shorter survival period in LUAD patients; however, effective postmetastatic survival prediction models are lacking. We hypothesize that the key genes determining postmetastasis survival must be enriched among the DEGs between primary and metastatic lesions, as this would provide a biological explanation for how the metastatic event influences patient survival. Using the Wilcoxon signed-rank test on transcriptomic data from matched primary and metastatic tumor samples, we identified dysregulated genes whose expression significantly changed during metastatic transition and generated a corresponding volcano plot (Fig. 6a). The top 50 genes with the most statistically pronounced expression changes after metastasis are summarized in Fig. 6b.
Fig. 6
Differential gene expression between paired primary and metastatic tumors and survival prediction models for LUAD patients after distant metastasis. a Wilcoxon signed-rank test results for paired comparisons of gene expression levels between metastatic and matched primary tumors. b Bar plot of the top 50 significant DEGs. c GSEA1350 pathway enrichment analysis based on all genes ranked by lnHR from univariate Cox regression for PFS and OS or on all genes ranked by Spearman correlation with the model score. d Immune cell subsets in metastatic tumors significantly associated with OS following the first distant metastasis. e Immune cell subsets in metastatic tumors significantly associated with PFS following the first distant metastasis. f Spearman correlation analysis between the HEindex and the survival model risk score. Note: For correlation analyses, “yes” indicates patients who reached the PFS or OS endpoint, “no” indicates patients who did not reach the endpoint, and “NA” indicates patients who were lost to follow-up
DEGs for which the raw P value was < 0.05 and the FDR was < 0.01 were considered to be statistically significant and were selected to construct subsequent random forest survival models. Next, we performed univariate Cox regression analysis to evaluate the association of each DEG with survival outcomes. We then constructed separate random forest models to predict overall survival (OS) and progression-free survival (PFS) in LUAD patients from the initiation of first-line therapy after distant metastasis. Ultimately, we identified key genes significantly associated with OS and PFS. The genes significantly linked to OS included ATP8A1_Immune, EPC1_Stroma, PKM_Stroma, DYNLL1_Stroma, FAM83H_Stroma, and EIF4H_Stroma. Those significantly associated with PFS included MDH1_Tumor, PSMA2_Tumor, RIPOR2_Tumor, VCAM1_Stroma, CYCS_Stroma, EPRS1_Stroma, TCF21_Stroma, and MFAP4_Stroma (Tables S5 and S6).
We subsequently conducted GSEA on the basis of the lnHR rankings of all genes in the Cox regression analysis to explore the relevant pathways that affect prognosis (Fig. 6c). GSEA based on OS revealed that pathways related to cell cycle regulation (55/127, 43.3% in tumors; 51/127, 40.2% in stroma) and genetic and epigenetic information (57/286, 19.9% in tumors; 89/286, 31.1% in stroma) in both tumor and stromal compartments were more enriched in patients with poor prognosis. Further GSEA using the OS risk model prediction score indicated that worse OS outcomes were significantly associated with the upregulation of pathways related to the cell cycle (82/127, 64.6% in tumor; 73/127, 57.5% in stroma) and genetic and epigenetic information (130/286, 45.5% in tumor; 139/286, 48.6% in stroma) in both tumor and stromal compartments.
Similarly, GSEA based on PFS revealed that pathways related to genetic and epigenetic information (42/286, 14.7%) in the stromal compartment were more enriched in patients with worse PFS. Further GSEA based on the PFS risk model prediction score revealed that worse PFS outcomes were significantly associated with the upregulation of pathways related to the cell cycle (64/127, 50.4% in tumor; 50/127, 39.4% in stroma), genetic and epigenetic information (103/286, 36.0% in tumor; 119/286, 41.6% in stroma), and cell death (19/72, 26.4% in tumor; 29/72, 40.3% in stroma) in both tumor cells and stromal compartments, as well as with the upregulation of pathways related to cell death (18/72, 25.0%), metabolism and energy (66/315, 21.0%), and genetic and epigenetic information (54/286, 18.9%) in immune compartments.
Furthermore, using mIF staining of metastatic lesions, we investigated the correlation between the infiltration of various immune cell types in the metastatic TIME and survival risk in LUAD patients. Correlation analysis revealed that the risk score of OS from the initiation of first-line therapy after distant metastasis was negatively correlated with the infiltration of M2 macrophages and effector T cells in metastatic lesions (Fig. 6d). The PFS risk score of the first-line treatment after metastasis was negatively correlated with the infiltration of M2 macrophages, effector T cells, and regulatory T cells in metastatic lesions (Fig. 6e). Additionally, the HEindex was negatively correlated with the risk scores derived from both the OS and PFS models (Fig. 6f).
