


Study population analysis
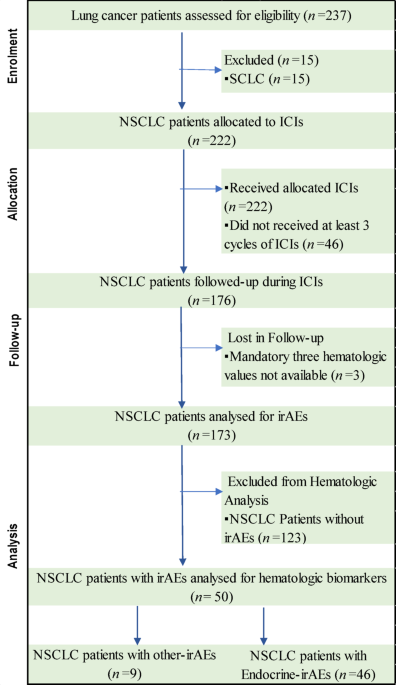
Of 237 lung cancer patients treated with ICIs in our retrospective study, we excluded patients according to pre-specified exclusion criteria and a first cohort of 173 NSCLC patients was analyzed. The flowchart of the study cohorts and exclusion criteria are described in Fig. 1.
Fig. 1
Flowchart of the study cohort.
Firstly, the research focused on 173 NSCLC patients, who were evaluated from different perspectives, at baseline and during ICI therapy, to identify variables influencing ICIs efficacy. Before the initiation of ICI therapy, we assessed age, sex, body mass index (BMI), Eastern Cooperative Oncology Group (ECOG) performance status, histological features, number and sites of metastasis at baseline, presence of EGFR mutations or ALK rearrangements, and PD-L1 status, as shown in Table 1. Most NSCLC patients were in metastatic stage, with a good performance status. Brain and bone metastasis were present in 50% of patients. We identified 10 oncogene-addicted patients that were treated in second line with immunotherapy after completion of targeted therapies and progression over them.
Table 1 Demographic and clinical characteristics of NSCLC Patients treated with ICIs, assessed at baseline.
During ICI therapy, we registered all co-medication’s data. Almost half of the patients were treated with steroids for different purposes, such as co-medication in chemotherapy protocols or for symptomatic brain or bone metastases, as specified in Table 2. Not all 82 NSCLC patients treated with ICI and chemotherapy in first line setting also received steroid emesis prophylaxis. Ninety-five patients were treated with PPIs and 30.6% had a symptomatic pain, controlled by minor or major opioids. Thyroid functional tests (TFTs) were assessed at baseline and before each cycle of immunotherapy plus at least one follow-up value. Endocrinologist specialist consultation was required for any doubt of endocrine dysfunction and specific tests were used to diagnose immune mediated adverse events, such as, thyroid disorders, hypophysitis, primary adrenal insufficiency or diabetes mellitus. Fifty NSCLC patients experienced Endocrine and other-irAEs during immunotherapy. Five patients developed both endocrine and non-endocrine irAEs. The synchronous and metachronous metaplasia during the study were represented by: head and neck cancer (H&N), (nine cases), NSCLC (four cases), ovarian (one case), prostate (one case), skin cancer (three cases), breast cancer (two cases), cervical cancer (four cases), hematologic diseases (four cases), digestive cancers (four cases), renal cell carcinoma (one case) and urothelial cancer (two cases). One female patient experienced four neoplasia types during the study: synchronous CRC, NSCLC, metachronous breast and cervical cancer. Clinical features and co-medications of NSCLC patients during ICI therapy are detailed in Table 2.
Table 2 Clinical Features of NSCLC Patients treated with ICIs and evaluated for Hematologic Biomarkers and Endocrine-irAEs, during Immunotherapy.
Treatment characteristics of NSCLC patients treated with ICIs and evaluated for hematologic biomarkers and Endocrine-irAEs are systematically presented in Table 3. ICI’s efficacy was evaluated by RECIST criteria and 112 patients achieved partial response.
Table 3 Treatment characteristics of NSCLC Patients treated with ICIs, evaluated for Hematologic Biomarkers and Endocrine-irAEs.
Fifty NSCLC patients experienced fifty-nine irAES, as five patients developed both endocrine and non-endocrine irAEs and four patients experienced more than one affected gland. The most frequently reported irAEs were autoimmune endocrinopathies, and thyroiditis was the most prevalent one. The average time till Endocrine-irAEs was 6.3 months and the average time on ICIs for NSCLC patients experiencing irAEs was 15.1 months. The summary of Endocrine and non-endocrine-irAEs are thoroughly presented in Table 4 and Table A1 in the Appendix section. Only five irAEs were classified as moderate to severe (Grade ≥ 3). All other-irAEs were treated with methylprednisolone, according to the guidelines. Patients who had subclinical hypothyroidism did not need therapy. One patient experienced hypophysitis involving thyroid, adrenal and gonadotropic deficiencies, and needed hormonal replacement therapy for all three glands.
Table 4 Summary of irAEs of NSCLC Patients treated with ICIs.
Descriptive statistics of predictive hematological biomarkers, absolute neutrophils count (ANC), absolute lymphocytes count (ALC) and absolute eosinophiles count (AEC) values were recorded at baseline, before ICI treatment for the entire cohort (T1). For NSCLC patients experiencing irAEs, these hematologic biomarkers were also registered at the onset of irAEs (T2) and at the last ICI cycle or the last available hematological sampling (T3). All these data are exemplified in Table A2 and Table A3 in the Appendix Section.
Statistical Results
The primary endpoint of the study was the influence of NLR at baseline, before the initiation of immunotherapy in NSCLC patients who experienced Endocrine-irAEs. We performed a logistic regression in order to assess the influence of NLR on developing all irAEs before starting ICI treatment. While the likelihood ratio of the model was statistically significant, the initial odds ratio was crossing 1. This happened because the odds ratio was calculated based on an insignificant Wald statistic. As likelihood ratio and Wald statistic tests should be asymptotically equivalent and we had a finite sample, we performed an empirical bootstrapped model (10000 trials) in order to re-calculate the confidence intervals (Table 5). Therefore, by increasing the NLR with one unit, the probability of developing an irAE was reduced to 87.5%. We identify a statistically significant correspondence between NLR value before ICIs initiation and all-irAEs [odds ratio (OR) 0.877, 95% confidence interval (CI) 0.763–0.979, p = 0.036], but not for Endocrine-irAEs (OR 0.898, 95% CI 0.781–1.031, p = 0.081).
Table 5 Logistic regression and bootstrap odds ratio. Relationship between all irAEs and NLR at treatment start.
We also investigated the role of NLR and ANC, ALC, AEC values at the start of ICI treatment on Endocrine-irAEs, co-medication and rate of infections during ICI treatment. The influence of hematological variables at the start of ICI treatment on all irAEs, Endocrine-irAEs, the use of steroids during ICI treatment, infections during ICI, and response to ICI were assessed using univariate logistic regressions, as shown in Table 6. ANC levels were significant in predicting an increase in steroid use and AEC levels were significant in predicting a greater rate of infections.
Table 6 Logistic regression investigating the influence of hematological predictors on treatment-related variables.
Factors that influence NLR and ANC, ALC and AEC values have been tested. Mann-Whitney U tests were used to assess if the variables listed in Table 7 influenced hematological values at the start of ICI treatment. Squamous cell carcinoma was associated with statistically significant lower levels of ALC values (leading to higher NLR) and lower AEC levels, while PD-L1 > 50% was associated with higher AEC levels. Any type of prior treatment (radiotherapy/chemotherapy) was associated with lower ALC, ANC and AEC levels, while NLR was significantly higher. In patients that had started ICI treatment as first line therapy, ALC and ANC values were significantly higher, while NLR was not influenced.
Table 7 Mann-Whitney U-tests comparing hematological values between baseline characteristics.
To explore the variation of NLR, ANC, ALC and AEC values during ICI treatment in patients that developed an Endocrine-irAE and other-irAE, we employed repeated measures ANOVA and used Friedman’s test because the data were not normally distributed, as shown in Table 8.
Table 8 Friedman tests assessing the differences between hematological biomarkers values in patients with irAEs (n = 50) at different times during ICI treatment.
NLR values did not significantly differ, but seemed to have a rising trend from treatment start to finish (Fig. 2A). ANC values decreased at the onset of irAE, without any statistical significance, although the p-value indicated in Table 8 might suggest that a more powerful study could provide a higher level of significance (Fig. 2B). ALC values decreased at the onset of irAE with significance indicated both over the whole model, and in post hoc tests comparing them with baseline and endpoint levels (Fig. 2C). No significant change was found in AEC levels (Fig. 2D).
Fig. 2
Evolution of hematological biomarkers during ICI treatment for fifty NSCLC patients experiencing irAEs: (A) NLR (neutrophil-to-lymphocyte ratio); (B) ANC (absolute neutrophils count) mean level; (C) ALC (absolute lymphocytes count) mean level); (D) AEC (absolute eosinophils count) mean level. T1, baseline hematological evaluation before ICI’s initiation; T2, hematological evaluation at the onset of irAEs; T3, last available hematological blood sampling.
Dendrogram analysis
The employed hierarchical clustering method organized the abstracts of the retrieved references into distinct categories merging them into larger groups, based on the matches observed between the abstracts. This is illustrated in the original BERT-based dendrogram in Figure A1 from the Appendix Section. This analysis was performed based on the titles and abstracts of the articles, not on the full version of the papers. This BERT model limitation42 allowed only 512 tokens (words) per article as input. We highlight that this limitation did not majorly impact the results, as abstracts should accurately represent the content of articles, as Soviany et al.43 showed in their survey.
The BERT-based dendrogram shown in Figure A1 is the result of an unsupervised algorithm that clustered the abstracts based on the similarity among BERT embeddings. Since the BERT model is a pre-trained language model, it can accurately represent the global similarity of any two text samples. Meanwhile, the BERT model was not particularly trained on medical data, and this analysis might generate non-specialized clusters of the studied domain. To overcome this limitation, the validity of the BERT-based dendrogram was manually verified by all authors. Subsequently, three independent authors conducted a manual analysis of all the abstracts, in the specific order given by the dendrogram. We identified the keywords used by the AI algorithm to cluster the abstracts, and we manually exemplified them in Fig. 3. We observed that NLR was the main biomarker identified in all the abstracts. The algorithm clustered the abstracts according to other hematologic, inflammatory or nutritional scores. For example, abstracts were related to other hematologic scores, platelet-to-lymphocyte ratio (PLR), lymphocyte-to-monocyte ratio (LMR), ANC, ALC, AEC or inflammatory indexes, such as systemic immune-inflammation index (SII), inflammatory index (II), lung immune prognostic index (LIPI), CPLAN or nutritional scores, such as prognostic nutritional index (PNI), body mass index (BMI), Glasgow prognostic score (GPS), HALP as shown in Fig. 3. NLR is the keyword that characterizes the first (light blue) cluster40,44,45,46,47,48 and NLR associated with SII and PNI are grouped in the second (yellow) one49,50,51,52,53,54,55. The third (grey) group matched LIPI index with NLR36,37,56,57,58. The fourth (pink) cluster comprised several other prognostic scores. The first three articles in the pink cluster investigated how fluorodeoxyglucose Positron Emission Tomography and Computed Tomography (FDG-PET/CT) scan standardized uptake values (SUV) might correlate with NLR59,60,61. The second subgroup in the pink cluster gathers abstracts that examined NLR and PLR values62,63,64. The following ten abstracts inside the pink cluster include articles about the correlation between NLR and nutritional indexes39,41,65,66,67,68,69,70,71,72. The last two articles in the pink cluster evaluated ANC and AEC values besides NLR73,74. The fifth (brown) cluster connected abstracts whose keywords are NLR, LMR and PLR75,76,77,78,79,80. The clustering algorithm separated an article combining hematologic biomarkers, ANC, ALC and absolute platelet count (APT) values81. In the first high-level branch, the AI system mostly gathered hematologic prognostic scores and combined them into a larger cluster. The seventh (purple) set of abstracts paired NLR with LIPI or PLR82,83,84,85,86. The eight (red) group combines NLR with nutritional indexes, such as BMI or GPS87,88,89,90,91,92. The large nineth (green) cluster mostly gathered abstracts based on CPLAN index (constructed on C-reactive protein, performance status, lactate dehydrogenase, albumin, and derived neutrophil-to-lymphocyte ratio)40,93,94,95,96,97,98,99,100,101,102,103,104,105. The second high-level branch (comprising purple, red and green clusters) covers a larger collection of abstracts which represented combined systemic inflammatory scores. Finally, the last (orange) group harmonizes assorted immune inflammatory scores38,106,107,108,109,110,111,112,113,114,115,116,117,118,119.
Fig. 3
Dendrogram produced by an agglomerative clustering technique based on Ward linkage, applied on BERT-based embeddings – Human correlation by keywords from abstracts. Legend: NLR, neutrophil-to-lymphocyte ratio; SII, systemic immune-inflammation index; PNI, prognostic nutritional index; LIPI, lung immune prognostic index; LIPS, lung immune prognostic score; FDG-PET/CT, fluorodeoxyglucose Positron Emission Tomography and Computed Tomography; PLR, platelet-to-lymphocyte ratio; II, inflammatory index; Nutritional Index; ANC, absolute neutrophiles count; AEC, absolute eosinophiles count; ALC, absolute lymphocytes count; APC, absolute platelets count; LMR, lymphocyte-to-monocyte ration; PLR, platelet-to-lymphocyte ratio; BMI, body mass index; GPS, Glasgow prognostic score; CPLAN; Hg, hemoglobin; Alb, albumin.
For more trustworthy and substantial understanding of the AI dendrogram, we thoroughly reviewed the 83 abstracts of the retrieved references. It is imperative to notice the hierarchical structure of the retrieved abstracts. The authors would like to emphasize that 56 abstracts (67,5%) were retrospective studies37,39,40,45,49,50,52,53,54,55,59,60,63,65,66,67,68,69,70,72,75,76,77,78,79,80,82,83,87,88,89,90,91,92,94,95,96,97,99,100,101,102,103,104,106,108,109,111,112,113,114,115,116,118,119, only 15 articles were prospective41,44,46,47,48,51,61,62,71,73,74,98,107,110,117, and the remaining 12 were reviews or meta-analysis36,38,56,57,58,64,81,84,85,86,93,105. The retrospective cohorts rarely exceeded 200 patients, and just 31 studies (37.3%) investigated NLR and other indexes in first line ICI40,49,50,51,52,53,54,55,56,59,60,62,63,64,76,77,78,79,89,90,91,92,97,101,106,107,109,110,111,116. All the studies examined hematologic, inflammatory or nutritional scores at baseline and just 34 studies (41%) dynamically analyzed the same indexes, but in fact a short period of at least three different values for at longest three months of immunotherapy was truly investigated39,40,41,44,45,46,47,48,49,50,55,61,62,64,66,67,68,69,75,78,80,84,85,89,98,104,112,113,114,115,116,117,118,119. Just 12 studies investigated the correlation between NLR and the onset and severity of irAEs39,40,44,45,47,48,49,67,99,100,101,116 revealing a thought-provoking future research approach as predictive biomarker for irAEs. No more than four studies reported data about co-medication, meaning the use of antibiotics and steroids during ICIs50,57,87,97 and highlighted their negative impact upon efficacy and how NLR values have been influenced. Experienced physicians revealed deeper significances of the article’s clusters. The main deduction of this revision was that NLR might be the most crucial predictive factor for efficacy, converted into PFS and OS. Additionally, NLR might anticipate the onset of irAEs, and correlate with their severity. Index dynamics were better predictors than baseline values in foreseeing survival, onset of irAEs, especially in first line immunotherapy.
