


Elevated MDM2 levels suppress the expression of Pol III–transcribed genes
To investigate whether MDM2 modulates RNA polymerase III (Pol III) activity, we manipulated cellular MDM2 levels using two previously described small molecules with matched scaffolds [30,31,32]. MI-1061 is a Nutlin-like compound that binds the p53-interacting pocket of MDM2, thereby displacing p53 and allowing p53 to activate transcription of its target genes. MD-224 contains the same MDM2-binding moiety that inhibits p53 interaction but is additionally linked to a Cereblon-binding group, converting it into a PROTAC that promotes MDM2 ubiquitination and degradation (Fig. 1A). Recent literature suggests that MD-224 can also destabilize the nuclear receptor PXR [33], but the gene encoding PXR is not detectably expressed in any of the cell lines under study here, according to proteinatlas.org [34].
Fig. 1: MDM2 accumulation inhibits RNA Pol III activity.
A Schematic representation of the proteolysis targeting chimera (PROTAC) MD-224 used in this study. The MDM2-binding moiety MI-1061 is linked to a ligand of the E3 ligase Cereblon to form a PROTAC, which mediates MDM2 ubiquitination and subsequent proteasomal degradation. B Immunoblot analysis of whole-cell lysates from SJSA-1 cells treated with the MDM2-binding antagonists Nutlin (20 μΜ) or MI-1061 (1 μM), or with the PROTAC MD-224 (1 μM), for 12 h, reflecting the accumulation of p53 and its target gene products upon treatment with MDM2 antagonists. Of note, the accumulation of MDM2 was reduced in the presence of the PROTAC MD-224. Replicates and quantification of the protein levels are shown in Supplementary Fig. 1A. C Expression of the p53 target genes MDM2 and CDKN1A in SJSA-1 cells treated as in (B). Transcript levels were quantified by RT-qPCR, normalized to 36B4 mRNA and depicted relative to the control; n = 4. D Top: Metabolic pulse-labeling of nascent RNAs at multiple time points following the addition of Nutlin (20 µM), MI-1061 (1 µM) or MD-244 (1 µM). Bottom: Quantification of nascent 5S rRNA and tRNA levels shown as mean ± SEM. a.u., arbitrary units; n = 3. Replicates are shown in Supplementary Fig. 1B. E Expression of RNA Pol III target genes in SJSA-1 cells. Levels of total and non-spliced tRNAs for Leu and Tyr were quantified by RT-qPCR upon treatments as in (B) and shown as means of five independent replicates ± SEM. Supplementary Fig. 1C presents the sequences of tRNAs and corresponding primers. F H1299 cells were co-transfected with expression plasmids for MDM2 and/or GFP at a 9:1 ratio for 36 h. GFP-positive cells were subsequently collected by fluorescence-activated cell sorting (FACS) and subjected to RT–qPCR analysis as in panel (E). Graphs are shown as means of three independent replicates ± SEM. For primer sequences, cf. Supplementary Fig. 1C. G Reduction in nascent 5S rRNA and tRNA levels in response to MDM2 overexpression. H1299 cells were co-transfected to express MDM2 and/or GFP, followed by FACS as in (F). GFP-positive cells were re-seeded and subjected to metabolic pulse-labeling of nascent RNAs. Quantification of the signals corresponding to 5S rRNA and tRNA is shown as means of three independent replicates ± SEM. H Volcano plots showing differential expression of nuclear encoded tRNAs, as determined by deep sequencing. SJSA-1 cells were treated with MI-1061, MD-224, or Nutlin, in comparison to the DMSO control as in (B). The plots reflect log2(fold change) vs –log10(p-value) for all quantified tRNAs. Differentially expressed tRNAs (p-value < 0.05, |log2FC | ≥ 1) are highlighted in blue (downregulated) and red (upregulated); cf. Suppl. Table 1. Statistical analyses: unpaired t-test; ns not significant; ∗p ≤ 0.05; ∗∗p ≤ 0.01; ∗∗∗p ≤ 0.001; ∗∗∗∗p ≤ 0.0001.
We treated SJSA-1 osteosarcoma cells, which harbor an MDM2 gene amplification [35], with MI-1061 or MD-224 for 12 h, using the DMSO solvent alone as a negative control and Nutlin-3a (Nutlin) as a reference compound. Immunoblot analyses demonstrated comparable induction of p53 and p21 by MI-1061 and MD-224, while MDM2 protein levels were diminished upon MD-224 treatment, consistent with its PROTAC activity (Fig. 1B; Supplementary Fig. 1A). As expected, reverse transcription and quantitative PCR (RT-qPCR) analysis further confirmed the induction of the p53-responsive genes MDM2 and CDKN1A (encoding p21) by all three MDM2-binding compounds but not by DMSO (Fig. 1C).
This system provided a means to compare conditions of high versus low MDM2 levels while maintaining comparable p53 activity. We used it to examine whether Pol III–dependent transcription was affected by MDM2. Firstly, we incubated the cells with 32P-orthophosphate to label nascent RNA. Of note, MI-1061 and Nutlin markedly suppressed the synthesis of 5S rRNA and tRNAs, starting already after 4 h of treatment, whereas MD-224 did not (Fig. 1D, Supplementary Fig. 1B). Furthermore, we quantified tRNAs for leucine and tyrosine and their precursors by RT-qPCR using corresponding primers (Supplementary Fig. 1C). This revealed a 2–3-fold reduction of tRNA levels upon treatment with MI-1061 or Nutlin, but not with MD-224 (Fig. 1E). Similar results were obtained when comparing DMSO- and Nutlin-treated cells in the MDM2-amplified liposarcoma cell lines GOT-3 [36] (Supplementary Fig. 1D) and 93T449 [37] (Supplementary Fig. 1E). p53 was previously reported to repress Pol III transcription [38, 39]. Therefore, to assess the role of MDM2 in suppressing Pol III target gene expression independently of p53, we used the p53-null cell line NCI-H1299 [40]. These cells were transfected with plasmids to overexpress MDM2 and/or GFP (9:1), and successfully transfected cells were isolated by fluorescence-activated cell sorting (FACS). This was followed by quantifying tRNAs using RT-qPCR, or by metabolic labeling of newly synthesized RNA. Both experiments revealed that these Pol III transcripts were diminished in response to MDM2 overexpression (Fig. 1F, G).
To further characterize the global impact of MDM2 on Pol III transcription, we performed deep sequencing analyses of small RNAs following treatment of SJSA-1 cells with MI-1061, MD-224, or Nutlin. Libraries were generated from RNA preparations enriched for small RNAs. This revealed broad repression of multiple tRNA species in cells treated with MI-1061 or Nutlin, whereas MD-224 treatment resulted in little if any decrease in tRNA abundance (Fig. 1H; Suppl. Table 1).
Given these reduced tRNA levels upon MDM2 accumulation, we asked if MDM2 affects general protein synthesis activity. Upon treatment of SJSA-1 cells with the three MDM2-antagonists as above, we labelled them with O-propargyl-puromycin (OPP) to detect newly synthesized proteins [41]. In all three treatment schemes, the OPP intensity was reduced, but no significant difference between MI-1061, MD-224 and Nutlin treatment was detected (Supplementary Fig. 1F, G). Thus, p53 activation, regardless of MDM2, can reduce general protein synthesis, as reported previously [41]. To test whether MDM2 is nonetheless capable of affecting translation independent of p53, we transfected H1299 cells with MDM2 expression plasmids and quantified OPP incorporation in MDM2-overexpressing cells. These cells revealed reduced protein synthesis, strongly suggesting that MDM2 can diminish translation even in the absence of p53 (Suppl Fig. H, I). Furthermore, to examine whether MDM2 accumulation might affect RNA polymerase I transcript levels, we analyzed the expression of the mature Pol I transcript 28S rRNA as well as its precursor, 45S rRNA, in SJSA-1 cells treated with MDM2 antagonists. However, neither transcript was significantly altered upon treatment (Supplementary Fig. 1J). We conclude that MDM2 can reduce general protein synthesis, perhaps through diminishing the transcripts of Pol III rather than Pol I.
Together, these results suggest that elevated levels of MDM2 correlate with a decrease in Pol III-mediated transcription. Moreover, they are at least compatible with the concept that MDM2 acts as a negative regulator of the Pol III-associated transcriptional machinery.
MDM2 physically associates with Pol III and restricts Pol III occupancy at target genes
The finding that elevated MDM2 levels correlates with Pol III–dependent transcription raised the possibility that MDM2 might form a complex with the Pol III machinery. To test this, we first performed a proximity ligation assay (PLA) in SJSA-1 cells treated with Nutlin for increasing durations, followed by immunostaining of MDM2 and the catalytic Pol III subunit POLR3A. PLA signals revealed a clear intracellular proximity between MDM2 and POLR3A (Fig. 2A; Supplementary Fig. 2A-C), suggesting that the two proteins can reside in a common complex, at least within the limits of the sensitivity and specificity of a PLA [42].
Fig. 2: MDM2 is in a complex with POLR3A, the catalytic subunit of RNA Pol III, and diminishes the association of Pol III with target genes.
A Left: Representative images from a proximity ligation assay (PLA) showing POLR3A–MDM2 association in SJSA-1 cells upon treatment with 20 µM Nutlin for increasing durations. Scale bar: 30 μm. Right: Quantification of fluorescence intensity per nucleus, using 4′,6-diamidino-2-phenylindole (DAPI) staining to establish masks (regions of interest); red lines indicate the means. Negative controls omitting one or both antibodies were included to ensure specificity, cf. Supplementary Fig. 2A. B Co-immunoprecipitation (Co-IP) of endogenous MDM2 and POLR3A in SJSA-1 cells. Cells were treated with 20 µM Nutlin for 16 h, and additionally with the proteasome inhibitor 20 µM MG-132 for the last 4 h prior to harvest. Immunoprecipitation was performed using anti-MDM2 and anti-POLR3A antibodies. Pre-immune rabbit IgG and a murine anti-β-galactosidase antibody served as controls. Precipitated material was subjected to immunoblot analysis, detecting MDM2 and POLR3A. Another replicate is shown in Supplementary Fig. 2D. C Co-IP of exogenously expressed MDM2 and Flag-tagged POLR3A. H1299 cells were transfected with plasmids to express wildtype (wt) MDM2 and Flag-POLR3A 36 h prior to harvest, with 20 µM of the proteasome inhibitor MG-132 added for the final 4 h. Anti-Flag-IgG-beads were used to pull down POLR3A, and protein G sepharose beads with anti-MDM2 antibodies to pull down MDM2, confirming their interaction by subsequent immunoblot analyses. A murine anti-β-galactosidase antibody was used as a negative control. D POLR3A occupancy at canonical RNA Pol III promoter sites in SJSA-1 cells treated with 20 µM Nutlin, 1 µM MI-1061, or 1 µM MD-224 for 8 h, assessed by chromatin immunoprecipitation (ChIP) and amplification of the indicated promoter regions. An intragenic region within the ARPP0 gene and an intergenic region with low POLR3A occupancy (neg. Ctrl) were amplified as negative controls. The graph shows the means of three independent replicates ± SEM. Statistical analysis: two-tailed, unpaired t-test; *p ≤ 0.05, **p ≤ 0.01, ***p ≤ 0.001, ****p ≤ 0.0001. Background precipitation by pre-immune IgG (average) is indicated by a dotted line. The lack of MDM2 occupancy on these promoter sites is shown in Supplementary Fig. 2E.
To provide biochemical evidence for this interaction, we carried out co-immunoprecipitation experiments in Nutlin-treated SJSA-1 cells. Immunoprecipitation with an antibody against MDM2 recovered POLR3A, and conversely, POLR3A antibodies coprecipitated MDM2, whereas control antibodies did not (Fig. 2B; Supplementary Fig. 2D). Similar results were obtained in the p53-null cell line H1299, where overexpression of MDM2 together with tagged POLR3A again resulted in reciprocal coprecipitation of both proteins, but not in control transfections (Fig. 2C). These experiments indicate that MDM2 and POLR3A can physically associate or at least reside in proximity within the same complex, both under endogenous conditions and upon overexpression.
We next asked whether MDM2 interferes with the ability of Pol III to engage its target loci. To this end, SJSA-1 cells were treated with MI-1061, Nutlin, MD-224, or DMSO, and chromatin immunoprecipitation (ChIP) was performed to assess POLR3A occupancy. Strikingly, MI-1061 and Nutlin treatment led to a marked reduction of POLR3A binding at multiple Pol III–transcribed genes, including various tRNA loci as well as 5S rRNA and 7SL snRNA genes. By contrast, occupancy was unaffected in cells treated with the PROTAC MD-224 or DMSO, and the ChIP of non–Pol III-transcribed genes remained largely unchanged at baseline levels (Fig. 2D). To investigate whether MDM2 directly associates with these loci, we analyzed MDM2 occupancy at the same Pol III–transcribed genes following Nutlin treatment. No notable enrichment of MDM2 was detected at these promoters. As a positive control, we included previously described MDM2 target loci associated with Polycomb repressor complex–regulated genes [6], which showed the expected enrichment (Supplementary Fig. 2E). Thus, MDM2 does not detectably bind Pol III-transcribed gene loci but rather diminishes their association with Pol III.
Taken together, these results demonstrate that MDM2 could reside in a complex with RNA polymerase III. We propose that this complex formation may diminish Pol III binding to cognate promoters, perhaps through overlapping binding sites for MDM2 and DNA on Pol III. Such a scenario would provide a mechanistic explanation for the observed suppression of Pol III–dependent transcription.
The catalytic subunit of Pol III associates with the aminoterminal portion of MDM2
We next sought to identify the domains of MDM2 responsible for the association with the catalytic subunit POLR3A. To this end, we compared the ability of full-length MDM2 (residues 1–491) to co-precipitate with POLR3A against a series of MDM2 fragments and mutants. Constructs included an aminoterminal fragment (residues 1–400), a carboxyterminal fragment (residues 298–491; Fig. 3A), a deletion mutant lacking residues 222–325 (Fig. 3B), and a minimal aminoterminal fragment spanning residues 6–200 (Fig. 3C).
Fig. 3: Mapping the interaction between MDM2 and POLR3A.
A Co-IP from transfected H1299 cells to map the POLR3A-associating site of MDM2. Cells were transfected to express wild-type (wt) MDM2 or MDM2 fragments (1–400 and 298–491) alongside Flag-POLR3A for 36 h. Four hours before harvest, 20 µM MG-132 was added to inhibit proteasomal degradation. IP was performed using two anti-MDM2 antibodies (4B11 and IF2) and anti-Flag beads, followed by immunoblot analysis. B As in (A), expressing an MDM2 deletion mutant lacking residues 222–325. C As in (A), using the MDM2 fragment 6-200. D PLA analysis of MDM2 fragments along with POLR3A. Quantification of fluorescence intensity per nucleus, using DAPI staining as a mask. Red lines indicate the mean fluorescence for each condition. Left: MDM2-fragment 298-491 or wt-MDM2 were stained with antibody 4B11. Right: MDM2-fragment 6–200 or wt-MDM2 were stained with antibody IF2. For images, cf. Supplementary Fig. 3A-D. E Schematic representation of the POLR3A binding region on MDM2. F Co-IP upon expression of the MDM2 mutant V75A, which cannot bind p53, to test whether POLR3A and p53 share the same binding domain. MDM2 wt and p53 were included as controls. Experimental conditions as in (A).
Co-immunoprecipitation experiments revealed that all constructs except the carboxyterminal fragment (298–491) associated with Flag-tagged POLR3A in a reciprocal manner. Consistently, proximity ligation assays confirmed that fragments containing residues 6–200 retained interaction capacity (Fig. 3D; Supplementary Fig. 3A-D). These results establish that the aminoterminal region of MDM2 is both necessary and sufficient for binding POLR3A, as summarized in Fig. 3E.
The identified binding domain overlaps with the MDM2–p53 binding site, prompting us to investigate whether POLR3A and p53 share the same binding pocket. We tested MDM2 carrying a point mutation, V75A, which was previously shown to impair p53 binding [43]. Co-immunoprecipitation revealed that MDM2-V75A associated with POLR3A to a similar extent as wild-type MDM2, but—as expected—displayed reduced binding to p53 (Fig. 3F). This indicates that MDM2 engages POLR3A and p53 via distinct structural determinants, although both interactions map to the aminoterminal region of the protein.
In summary, these experiments define the aminoterminal residues 6–200 of MDM2 as the critical region mediating the association with POLR3A, by a binding mode that is separable from canonical p53 binding.
MDM2 suppresses the induction of innate immune–responsive proteins and cytokines
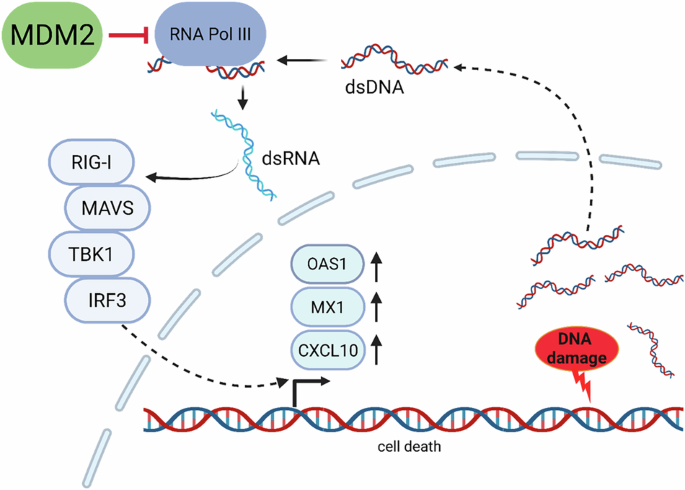
Beyond its role in nuclear transcription, RNA polymerase III also contributes to innate immune defense. When exogenous or damaged DNA accumulates in the cytosol, Pol III transcribes such DNA bidirectionally, generating double-stranded RNA that activates the RIG-I–MAVS–TBK1–IRF3 signaling cascade and induces antiviral gene expression [22,23,24,25]. Since MDM2 associates with Pol III and inhibits its transcriptional activity in the nucleus, we next asked whether MDM2 also interferes with the immune function of Pol III.
To address this, we manipulated MDM2 levels in SJSA-1 cells using MI-1061, Nutlin, or the PROTAC MD-224, and subsequently transfected the cells with poly(dA:dT), a synthetic double-stranded DNA that potently activates Pol III–dependent innate signaling [22, 25]. DNA uptake by the transfected cells was visualized by 4′,6-diamidino-2-phenylindole (DAPI) (Supplementary Fig. 4A). The global cellular response was first assessed by quantitative proteomics. As expected, poly(dA:dT) strongly upregulated several interferon-stimulated gene (ISG) products, including MX1 and OAS1 (Fig. 4A; Supplementary Fig. 4B; Suppl. Table 2). Notably, however, treatment with Nutlin markedly reduced the abundance of these proteins in poly(dA:dT)-stimulated cells, suggesting that elevated MDM2 levels suppress ISG induction. To investigate whether these effects occur independently of p53, we transfected the p53-null cell line H1299 to express either full-length MDM2 or the minimal Pol III-binding fragment of MDM2 (amino acids 6–200), followed by stimulation with poly(dA:dT). Quantitative proteomic analysis again revealed robust induction of ISG products in response to poly(dA:dT) in control-transfected cells. In contrast, overexpression of either full-length MDM2 or the 6–200 fragment significantly reduced the abundance of several ISG products, including MX1, OAS2, and IFIT1 (Fig. 4B; Suppl. Table 3).
Fig. 4: MDM2 attenuates the induction of innate immune response-related proteins and cytokine release by poly(dA:dT).
A Mass-spectrometry–based protein identification and quantification. Volcano plots show log2 (fold-change) vs -log10 (p-value) for all quantified proteins. Significantly regulated proteins (p-value < 0.05, |log2FC | ≥ 0.8) are highlighted in blue (downregulated) and red (upregulated). Left: SJSA-1 cells treated with DMSO for 36 h, and transfected or not with 100 ng/mL poly(dA:dT) for the last 24 h. Right: Cells were treated with DMSO or Nutlin (20 µM) for 36 h, and transfected with 100 ng/mL poly(dA:dT) for the last 24 h. Suppl. Table 2 indicates all input mass-spectrometry candidates; also cf. Supplementary Fig. 4B.B Protein quantification, as in (A), in response to MDM2 overexpression and poly(dA:dT) treatment. Left: H1299 cells were transfected with an empty plasmid. After 48 h, the cells were transfected or not with 100 ng/mL poly(dA:dT) for 24 h. Middle: H1299 cells were transfected with a plasmid expressing wild-type (wt) MDM2 or an empty plasmid. After 48 h, the cells were transfected again with 100 ng/mL poly(dA:dT), for 24 h. Right: H1299 cells were transfected with a plasmid to express the MDM2-fragment comprising residues 6–200, or an empty plasmid vector. After 48 h, the cells were transfected again with 100 ng/mL poly(dA:dT) for 24 h. MDM2 log2 (fold-change): 8,38. Suppl. Table 3 indicates all proteins identified and quantified in this experiment. C Cytokine release into the supernatant after 36 h treatment with 1 µM MI-1061 or 1 µM MD-224, and/or 100 ng/mL poly(dA:dT) transfection for the last 24 h in SJSA-1 cells, as determined by membrane-based antibody arrays. Left: Images of the arrays. Right: Quantification of signal intensities using ImageJ. a.u., arbitrary units. The graph represents means of four experiments ± SEM. Statistical analysis: unpaired t-test; *p ≤ 0.05, **p ≤ 0.01, ***p ≤ 0.001, ****p ≤ 0.0001. A replicate is shown in Supplementary Fig. 4D.
We then examined cytokine release in SJSA-1 cells upon treatment with poly(dA:dT) and/or MDM2 antagonists, using dot blot analysis of culture supernatants. Several cytokines were induced by poly(dA:dT), but their induction was diminished in the presence of MI-1061, whereas MD-224 had no such effect (Fig. 4C; Supplementary Fig. 4C). This inhibitory activity of MDM2 was particularly evident for CCL2/MCP-1, MIP-1α/MIP-1β, CCL5/RANTES, and especially CXCL10/IP-10, a well-established marker of innate immune activation [29, 44,45,46].
Taken together, these findings suggest that MDM2 not only represses nuclear Pol III–dependent transcription, but may also dampen Pol III-driven innate immune signaling, suppressing ISG expression and cytokine release in response to cytosolic DNA.
MDM2 attenuates gene expression driven by the Pol III–RIG-I–TBK1–IRF3 signaling pathway
To test whether MDM2 specifically modulates the Pol III–RIG-I–TBK1–IRF3 signaling cascade, we combined poly(dA:dT) transfection with siRNA-mediated knockdown of POLR3A, RIG-I, or IRF3, or with pharmacological modulation of MDM2 using MI-1061 or the PROTAC MD-224. We then assessed the expression of three previously identified poly(dA:dT)-responsive genes—CXCL10, OAS1, and MX1—by RT-qPCR. As expected, all three transcripts were robustly induced by poly(dA:dT). Importantly, their induction was markedly reduced upon depletion of POLR3A, RIG-I, or IRF3, mirroring the suppression observed in MI-1061–treated cells, whereas MD-224 had no effect (Fig. 5A). Similar observations were made analyzing a set of ISG genes upon treatment with the Pol III inhibitor ML-60218 [47] and when quantifying the mRNA levels corresponding to IFIT1, IFIT2, and IFNB (Supplementary Fig. 5A-C). To exclude toxic effects as a major reason for differential gene expression, we assessed cell viability at multiple time points after POLR3A knockdown and compared the results to MDM2 depletion, observing only minor Pol III-dependent changes; in addition, brightfield imaging confirmed that SJSA-1 cells remained largely viable following POLR3A knockdown (Supplementary Fig. 5D). Diminished response of some ISGs to poly(dA:dT) after depletion of POLR3A or treatment with MI-1061 was also seen in the breast cancer-derived cell line MCF7 (Supplementary Fig. 5E), which is p53-proficient but lacks detectable gain in the chromosomal MDM2-comprising region 12q15 [48]. In contrast to poly(dA:dT), transfecting SJSA-1 cells with the synthetic double stranded RNA poly(I:C) induced ISGs independently of Pol III, and this induction was not diminished by MI-1061 (Supplementary Fig. 5F, G). Depleting STING did not significantly alter the induction of genes by poly(dA:dT) in these cells, nor their response to MDM2-targeting compounds (Supplementary Fig. 5H-M), strongly suggesting that MDM2 does not alter the cGAS-STING pathway [21, 49, 50] in this context. Immunoblot analyses revealed that poly(dA:dT) robustly enhanced phosphorylated TBK1, a hallmark of RIG-I–pathway activation, whereas MI-1061—but not MD-224—attenuated this phosphorylation (Fig. 5B; Supplementary Fig. 5N). Consistent with these findings, immunofluorescence staining indicated strong MX1 induction following poly(dA:dT) stimulation. Treatment with MI-1061 profoundly reduced MX1 signals while concomitantly increasing MDM2 fluorescence, highlighting an inverse relationship between MDM2 abundance and MX1 expression (Supplementary Fig. 5O).
Fig. 5: MDM2 represses the inflammatory response to poly(dA:dT).
A Expression of the interferon-stimulated genes (ISGs) CXCL10, OAS1 and MX1 in SJSA-1 cells following RIG-I, IRF3 or POLR3A knockdown, and/or treatment with 1 µM MI-1061 or 1 µM MD-224 for 36 h, each combined with transfection of 25 ng/mL or 100 ng/mL poly(dA:dT) for the final 24 h. Graphs represent means of three independent replicates ± SEM. Expression levels of the ISGs IFIT1, IFIT2 and IFNB are shown in Supplementary Fig. 5A and D. B Immunoblot analysis of whole-cell lysates from SJSA-1 cells treated as in (A), revealing TBK phosphorylation and MX1 levels; cf. Supplementary Fig. 5P. C Schematic representation of the experimental workflow to obtain the results shown in (D). Briefly, SJSA-1 cells were first treated with MDM2 antagonists and/or poly(dA:dT). The RNA from these cells was then extracted and used for a second round of transfection, in order to reveal the synthesis of interferon-stimulating RNA during the first part of the experiment. D Expression of the interferon-stimulated genes (ISGs) CXCL10, OAS1 and MX1 in SJSA-1 exposed to the RNA from poly(dA:dT)-treated cells. SJSA-1 cells were treated with 1 µM MI-1061 or 1 µM MD-224 for 36 h and transfected with 500 ng/mL poly(dA:dT) for the final 24 h. RNA was extracted from these cells and transfected into freshly seeded SJSA-1 cells. In parallel, another batch of these cells were transfected with either 50 ng/mL poly(dA:dT) or poly(I:C) as controls and ISG expression was quantified by RT–qPCR. Graphs represent means of three independent replicates ± SEM. Expression levels of the ISGs IFIT1, IFIT2 and IFNB are shown in Supplementary Fig. 5F. Statistical analyses: unpaired t-test; ns not significant; ∗p ≤ 0.05; ∗∗p ≤ 0.01; ∗∗∗p ≤ 0.001; ∗∗∗∗p ≤ 0.0001.
To confirm that MDM2-mediated suppression of Pol III is responsible for its ability to attenuate innate immunity to dsDNA, we transferred RNA from cells treated with a DNA surrogate and/or MDM2 antagonists to a fresh cell monolayer. Specifically, SJSA-1 cells were treated with MI-1061 or MD-224 and subsequently transfected with poly(dA:dT). Total RNA was isolated, followed by size selection to enrich small RNAs. This approach was designed to determine whether poly(dA:dT) was converted into an immunostimulatory RNA species, as Pol III-derived transcripts should retain the ability to induce ISG expression upon retransfection. These RNA preparations were then transfected into newly seeded SJSA-1 cells, and ISG expression was analyzed by RT-qPCR. Remarkably, only RNA isolated from cells transfected with poly(dA;dT) and treated with DMSO or MD-224, but not MI-1061, induced robust expression of CXCL10, MX1, and OAS1 in recipient cells, reaching levels comparable to those observed following direct transfection with poly(dA;dT) or poly(I:C) (Fig. 5C, D). Similar effects were observed for IFIT1, IFIT2, and IFNB expression (Supplementary Fig. 5P).
Together, these findings strongly suggest that MDM2 suppresses the Pol III–RIG-I–TBK1–IRF3 signaling axis by inhibiting the generation of immunostimulatory Pol III-derived dsRNA, thereby attenuating TBK1 activation, ISG transcription, and MX1 protein accumulation.
MDM2 is sufficient to suppress cytoplasmic DNA responses and promote cell survival
Thus far, our analyses of innate immunity had largely relied on manipulating endogenous MDM2 levels in p53-proficient cells using small-molecule ligands in comparison to a PROTAC. To determine whether MDM2 alone is sufficient to attenuate cytosolic DNA responses independently of p53, we turned to H1299 cells, which lack p53. These cells were transfected with expression plasmids either encoding full-length MDM2 or the minimal Pol III-binding fragment (residues 6–200), or with an empty control vector, followed by stimulation with poly(dA:dT).
RT-qPCR analyses revealed that overexpression of either full-length MDM2 or its 6–200 fragment was sufficient to suppress the induction of CXCL10, OAS1, and MX1, three IRF3-responsive genes (Fig. 6A). Similar findings were obtained for IFIT1, IFIT2 and IFNB (Supplementary Fig. 6A). Consistently, immunoblotting revealed increased MX1 levels with poly(dA:dT), which was reduced upon overexpression of full-length MDM2 or the 6-200 MDM2 fragment (Fig. 6B; Supplementary Fig. 6B). Functionally, poly(dA:dT) treatment impaired clonogenic cell survival in a RIG-I-dependent manner, consistent with previous reports on other cells lines [51] and here determined by automated microscopy over several days, as well as by a cell viability assay 48 h after poly(dA:dT) transfection (Fig. 6C, D; Supplementary Fig. 6C). Notably, co-expression of MDM2 or the 6–200 fragment largely rescued cell growth under these conditions (Fig. 6E, F; Supplementary Fig. 6D) and partially protected cells from apoptosis, as indicated by reduced PARP1 cleavage (Fig. 6G). Similar findings were obtained in SJSA-1 cells (Supplementary Fig. 6E-G).
Fig. 6: MDM2 overexpression suppresses the response to poly(dA:dT) and increases cell survival.
A H1299 cells were transfected with plasmids expressing wild-type (wt) MDM2 or the MDM2-fragment comprising residues 6–200. After 48 h, the cells were transfected again, with 25 ng/mL or 100 ng/mL poly(dA:dT), for 24 h. Quantification of mRNA corresponding to the ISGs CXCL10, OAS1 and MX1 revealed decreased inflammatory response upon transfection of either MDM2 expression construct. Graphs represent means of three or four independent replicates ± SEM. Expression levels of ISGs IFIT1, IFIT2 and IFNB are displayed in Supplementary Fig. 6A. B Quantification of MX1 protein levels in H1299 cells. Cells were transfected with MDM2 expression plasmids as described in panel (A). After 48 h, this was followed by transfection with 100 ng/mL poly(dA:dT) for an additional 24 h. Subsequently, the MX1 protein was detected by immunoblot analysis and quantified using ImageJ with GAPDH detection as a reference, and with normalization to the empty vector control transfected with poly(dA:dT). The graph represents means of three independent replicates ± SEM. The corresponding immunoblots are shown in Supplementary Fig. 6B. C Left: Proliferation of H1299 cells, determined by automated microscopy, upon RIG-I knockdown and/or transfection with 1 µg/mL poly(dA:dT). Data represent the means of three technical replicates ± SEM. For biological replicates, cf. Supplementary Fig. 6C. Right: Corresponding area-under-the-curve analysis indicated significant rescue of cell growth upon RIG-I knockdown. D Cell viability of H1299 cells was determined based on ATP content (CellTiter-Glo) upon RIG-I knockdown and 48 h after transfection of 1.5 µg/mL poly(dA:dT), normalized to the siRNA control. The graph displays the means of three independent replicates ± SEM. E Left: Proliferation of H1299 cells, determined as in (B), upon overexpression of wt-MDM2 or the MDM2-fragment 6–200, and transfection with 1 µg/mL poly(dA:dT). Data represent means of three technical replicates ± SEM. Biological replicates are shown in Supplementary Fig. 6D. Right: Corresponding area-under-the-curve analysis. F Cell viability upon transfection of MDM2 expression plasmids, and 48 h after 1.5 µg/mL poly(dA:dT) transfection, normalized to the empty plasmid control. Means of three independent replicates ± SEM. G PARP cleavage upon poly(dA:dT) transfection, reverted by MDM2 overexpression. Immunoblot analysis of lysates from H1299 cells overexpressing MDM2 and transfected with 1 µg/mL poly(dA:dT) 24 h after MDM2 transfection, repeated 24 h later, and harvested 24 h after the last transfection of poly(dA:dT). Statistical analyses: unpaired t-test; ns not significant; ∗p ≤ 0.05; ∗∗p ≤ 0.01; ∗∗∗p ≤ 0.001; ∗∗∗∗p ≤ 0.0001.
Together, these results demonstrate that MDM2 alone, through a Pol III-binding domain that overlaps with the p53-binding domain, is sufficient to restrict the transcriptional response to cytosolic DNA and to enhance cell survival in the face of innate immune activation.
The radiomimetic drug neocarcinostatin induces an interferon response that is attenuated by MDM2
Poly(dA:dT) transfection provides a specific means to trigger the cytosolic DNA sensing pathway, mimicking DNA virus infection. However, cytosolic DNA can also arise endogenously, particularly following DNA double-strand breaks (DSBs). DNA fragments lacking centromeres, for instance, fail to segregate properly during mitosis and may persist in the cytoplasm once the nuclear envelope reassembles [19, 50]; other stress conditions can lead to the release of DNA from mitochondria to the cytosol [52, 53]. We therefore asked whether MDM2 also modulates innate immune responses elicited by DNA damage.
To this end, we induced DSBs with neocarzinostatin (NCS), a radiomimetic drug known to cause predominantly DSBs [54]. Endogenous MDM2 levels were manipulated using the small-molecule ligand MI-1061 or the PROTAC MD-224, and the cellular transcriptome was profiled by RNA sequencing. After 72 h of NCS treatment, substantial alterations in gene expression were observed between DMSO-, MD-224-, and MI-1061-treated cells, as illustrated by the heatmap of z-scores (Fig. 7A, Suppl. Table 4). Differentially expressed genes upon MI-1061 treatment were analyzed against the Molecular Signature Database (MSigDB) and revealed downregulation of genes associated with the inflammatory response, as well as interferon α and γ signaling (Fig. 7B). Gene set enrichment analysis (GSEA) revealed, as expected, that higher MDM2 expression levels altered cell cycle–associated transcriptional programs, including a reduction in E2F target genes and those promoting G2/M transition, consistent with p53–CDKN1A/p21 activation. Beyond these canonical effects, GSEA also indicated that NCS triggered a pronounced interferon response (Fig. 7C; Supplementary Fig. 7A-D, Suppl. Table 5). Importantly, this response was suppressed when MDM2 activity was elevated by MI-1061 but not by MD-224 (Fig. 7D), implicating MDM2 in dampening the interferon program.
Fig. 7: MDM2 modulates the transcriptional response to neocarzinostatin and represses inflammatory pathways.
A Heat map depicting differentially expressed (DE) genes according to the z-scores, determined by DeSeq2 analysis of three different samples, each treated for the last 24 h: DMSO, 1 µM MI-1061, or 1 µM MD-224; all samples of SJSA-1 cells were treated with 1 µg/mL neocarzinostatin (NCS) for 72 h. Only genes with |log2fold | ≥ 0.8 and adjusted p-value (padj.) < 0.05 were included in the analysis. Suppl. Table 2 indicates DE genes and normalized reads; also cf. Supplementary Fig. 7E, F. B Downregulated genes in NCS + MI-1061 vs NCS + DMSO and NCS + MD-224 were correlated with the Molecular Signature Database (MSigDB) Hallmark 2020 using the Enrichr platform to identify potentially perturbed pathways. Top 10 pathways, p-value ranked (-log10). C Gene set enrichment analysis (GSEA) of NCS + DMSO vs NCS + MI-1061 or (D) NCS + MD-224 vs NCS + MI-1061; hallmarks (h.all.v2023.2). E Volcano plot showing log2 (fold change) vs -log10 (p-value) for all DE genes. Significantly regulated genes (p-value < 0.05, |log₂FC | ≥ 0.8) are highlighted in blue (downregulated) and red (upregulated). E SJSA-1 cells treated with NCS + MI-1061 vs NCS + DMSO. F SJSA-1 cells treated with NCS + MI-1061 vs NCS + MD-224.
At the level of individual genes, NCS robustly induced transcripts such as CXCL10, OAS1, and IFIT2, yet their induction was markedly reduced in the presence of MI-1061 (Fig. 7E, F, Suppl. Table 6). Importantly, the majority of differentially upregulated genes after 72 h of NCS treatment, combined with DMSO or MD-224 but not with MI-1061, were primarily associated with pathways related to interferon α and γ as well as inflammatory responses according to MSigDB (Supplementary Fig. 7E, F; Suppl. Table 6).
Taken together, these findings demonstrate that DSBs can activate an interferon-driven transcriptional program, including IRF3-responsive genes, and that MDM2 effectively attenuates this response.
Neocarcinostatin activates the Pol III–RIG-I–TBK1–IRF3 pathway, which is attenuated by MDM2
We next asked whether the interferon response induced by NCS is mediated specifically through the Pol III–RIG-I–TBK1–IRF3 signaling cascade, similar to the response triggered by cytosolic poly(dA:dT). SJSA-1 cells were treated with NCS in the presence of siRNA-mediated knockdown of POLR3A, RIG-I, or IRF3, or with either MI-1061 or the PROTAC MD-224, and the expression of CXCL10, OAS1, and MX1 was quantified by RT-qPCR. Consistent with our observations using poly(dA:dT), NCS induced all three genes, and this induction was diminished following POLR3A, RIG-I, or IRF3 knockdown. For CXCL10 and OAS1, this was also observed upon treatment with MI-1061 but not MD-224 (Fig. 8A). Comparable outcomes were also observed when analyzing the genes IFIT1, IFIT2 and IFNB, and upon treatment with the Pol III inhibitor ML-60218 (Supplementary Fig. 8A-C). Moreover, POLR3A knockdown, as well as MI-1061 but not MD-224, suppressed ISGs when DSBs were induced via γ-irradiation (Fig. 8B; Supplementary Fig. 8D) and, for a subset of genes, in MCF7 cells (Supplementary Fig. 8E).
Fig. 8: MDM2 attenuates the inflammatory response following DNA double-strand breaks.
A Expression of the interferon-stimulated genes CXCL10, OAS1 and MX1 in SJSA-1 cells after RIG-I, IRF3 or POLR3A knockdown, combined with 1 µg/ml NCS for 48 h, followed by a refreshed NCS treatment for 24 h. 1 µM MI-1061 or 1 µM MD-224 was added during the NCS refreshment. Graphs represent means of three to five independent replicates ± SEM. Cf. Supplementary Figs. 8A and 8C for expression of ISGs IFIT1, IFIT2 and IFNB. B Expression of the same genes following POLR3A knockdown and/or γ-irradiation (5 Gy or 10 Gy) 72 h prior to harvest. Cells were treated with 1 μM MI-1061 or 1 μM MD-224 for 24 h. Graphs display the means of three independent replicates ± SEM. For expression of ISGs IFIT1, IFIT2 and IFNB, cf. Supplementary Fig. 8D. Statistical analyses: unpaired t-test; ns not significant; ∗p ≤ 0.05; ∗∗p ≤ 0.01; ∗∗∗p ≤ 0.001; ∗∗∗∗p ≤ 0.0001.
Together, these findings imply that DSBs activate the Pol III–RIG-I–TBK1–IRF3 signaling axis, paralleling the response to cytosolic poly(dA:dT), and that elevated MDM2 levels effectively dampen this pathway.
MDM2, independent of p53, dampens the innate immune response to DNA double-strand breaks and promotes cell survival
Finally, we examined whether MDM2 is sufficient, independent of p53, to attenuate the innate immune response to DNA damage. To this end, we overexpressed MDM2 in p53-null H1299 cells and induced double-strand breaks (DSBs) using NCS. RT-qPCR analysis revealed that MDM2 overexpression significantly suppressed the induction of CXCL10, OAS1, and MX1, demonstrating that MDM2 alone can blunt the interferon response to DNA damage (Fig. 9A; Supplementary Fig. 9A).
Fig. 9: MDM2 limits the inflammatory response and protects cells from growth arrest upon DNA damage.
A Expression of the ISGs CXCL10, OAS1 and MX1 in H1299 cells transfected to express wild-type (wt) MDM2 or the MDM2 fragment 6–200. Cells were treated with 1 µg/mL NCS 24 and 72 h after transfection, and harvested for RNA preparation 96 h after transfection. Graphs represent means of three to four independent replicates ± SEM; cf. Supplementary Fig. 9A. B Left: Proliferation of H1299 cells, determined by automated microscopy, upon RIG-I knockdown and treatment with 0.75 µg/mL NCS on day 1 and 3. Replicates are shown in Supplementary Fig. 9B. Right: Corresponding area-under-the-curve analysis of four biological replicates ± SEM. C Left: Representative images of crystal violet-stained cells at the endpoint of the proliferation assay shown in (B). Additional images from independent replicates are provided in Supplementary Fig. 9C. Right: Quantification of crystal violet absorbance from four biological replicates ± SEM. D Left: Proliferation of H1299 cells upon overexpression of MDM2 and treatment with 0.75 µg/mL NCS on day 1 and 3. Replicates are displayed in Supplementary Fig. 9D. Right: Corresponding area-under-the-curve analysis of five biological replicates ± SEM. E Left: Representative images of crystal violet-stained cells at the endpoint of the proliferation assay shown in (D). Additional images from independent replicates are provided in Supplementary Fig. 9E. Right: Quantification of crystal violet absorbance from four biological replicates ± SEM. Statistical analyses: unpaired t-test; ns not significant; ∗p ≤ 0.05; ∗∗p ≤ 0.01; ∗∗∗p ≤ 0.001; ∗∗∗∗p ≤ 0.0001.
This observation enabled us to assess functional consequences of MDM2-mediated attenuation of innate immunity in response to DSBs. We tested this in the absence of p53 activation, since MDM2 antagonists and DNA damage in combination would otherwise induce rapid cell death [55]. To assess functional consequences, we monitored cell proliferation upon RIG-I knockdown, under the same conditions as described above, using automated microscopy. As expected, NCS markedly reduced clonogenic survival. However, cells that were either missing RIG-I, or overexpressing MDM2 or the minimal Pol III-binding fragment 6–200, displayed a significantly higher capacity to recover from NCS-induced damage (Fig. 9B-E; Supplementary Fig. 9B-I).
Taken together, these findings indicate that MDM2 is sufficient to attenuate DSB-induced innate immune signaling and to promote survival after genotoxic stress, even in the absence of p53. This suggests that, beyond its well-known role as a p53 antagonist, MDM2 may enable tumor cells to evade innate immune surveillance triggered by DNA damage, thereby contributing to both therapy resistance and immune evasion in MDM2-driven cancers.
