


Ethical approval and patient recruitment
Tumor samples were obtained from patients undergoing surgical resection for suspected PDAC at the Charité Universitätsmedizin Berlin and Waldfriede Hospital Berlin in 2023. Written informed consent was obtained from all participants in accordance with the Declaration of Helsinki and institutional regulations. The study was approved by the institutional ethics committee (EA1/157/21). Tumor tissue from 16 patients was used to generate three parallel culture systems per resected sample: PDCL, PDOC and PDOM. All experiments were performed in accordance with relevant guidelines and regulations.
Tumor processing and culture establishment
Fresh tumor tissue was processed within 15 min of arrival. Samples were minced using sterile scalpels and enzymatically digested for 1.5 to 3 h in a solution containing 100 µg/mL DNase I (VWR, USA), 100 µg/mL Dispase (STEMCELL Technologies, Canada), 125 µg/mL Collagenase II (Sigma-Aldrich, Germany), 1:2000 Y-27,632 ROCK inhibitor (Abmole Bioscience, USA) and 1:200 Amphotericin B (Sigma-Aldrich, Germany). After digestion, the cell suspension was filtered through a 100 μm sterile mesh and treated with red blood cell lysis buffer (Miltenyi Biotec, Germany) for 10 min. The resulting cell pellet was divided into three equal fractions. The first fraction was seeded into T25 flasks for two-dimensional (2D) culture (PDCL). PDCL cultures were maintained and passaged upon reaching 80% confluency. Fibroblast depletion was performed between passages 1 and 4 using anti-fibroblast microbeads (Miltenyi Biotec, Germany), following the manufacturer’s instructions. The remaining two fractions were embedded in basement membrane extracts, with one seeded into Cultrex reduced growth factor (RGF) BME Type 2 domes (PDOC; R&D Systems, USA) and the other into Matrigel RGF domes (PDOM; Corning, USA), using 30 µL per dome. Culture medium17 was added after 15 min for Matrigel and after 30 min for Cultrex domes. Organoids were passaged when organoids exceeded 200 μm in diameter using TrypLE (Thermo Fisher Scientific) and reseeded at a 1:2 ratio in 30 µL matrix domes. Amphotericin B was included in all media for the first seven days to prevent contamination. Cultures were maintained with medium changes every 3–4 days. Mycoplasma contamination was excluded using a commercial detection kit (Applied Biological Materials, Canada).
DNA isolation and genetic sequencing
DNA was isolated from PDOC organoids. After matrix dissolution with Cell Recovery Solution (Corning, USA) and PBS washing, cell pellets were stored at -80 °C. DNA extraction was performed using the AllPrep DNA/RNA Mini Kit (Qiagen, Germany) following the manufacturer’s protocol. In short, cell pellets were lysed in RLT Plus buffer containing β-mercaptoethanol and the lysate was loaded onto AllPrep DNA spin columns. After centrifugation, the columns were washed with AW1 and AW2 buffers and genomic DNA was eluted using prewarmed EB buffer following a brief incubation at room temperature.
All DNA samples were analyzed using hybrid capture-based next-generation sequencing technology (Agilent XT HS2) with the SureSelect Cancer Comprehensive Genomic Profiling Assay (CGP Assay, Agilent Technologies). Library preparation was fully automated on a Magnis NGS Prep System (Agilent Technologies). Sequencing was performed on a NovaSeqX Plus (Illumina). For the mutation analysis, the data from the focused DNA NGS were evaluated with the DRAGEN-Bio-IT platform (Illumina) and variants with an allele frequency of at least 3% were considered. The calculation of the tumor mutation burden was based on Chalmers et al38. and included all synonymous and non-synonymous, presumably somatic variants with an allele frequency of at least 3%. To exclude potential germline variants, all variants were compared with entries in the “Database of Single Nucleotide Polymorphisms (dbSNP)” and the “Genome Aggregation Database (gnomAD)” and were filtered out if necessary. In addition, known driver mutations greater than 100 entries in “COSMIC, The Catalog Of Somatic Mutations In Cancer” were not included in the calculation.
Assessment of morphology
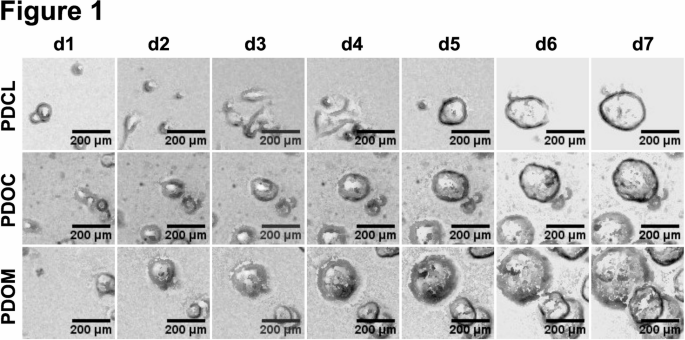
For morphology assessment, PDCL, PDOC and PDOM cultures were imaged daily for seven days using brightfield-confocal microscopy (ASFA® SCANNER High-Content Imaging System) under standardized optical conditions. Morphological parameters were assessed descriptively. Imaging was performed using a 4 × magnification with a CCD resolution of 2200 × 2200 pixels and a pixel size of 4.5 μm. For PDCL cultures, 9 images per sample were taken at 50 μm z-intervals, the percentage confluency was assessed, along with observations on whether cells grew in clusters or were evenly distributed. It was also noted whether most cells were attached to the flask surface or floating. Cell morphology was described in terms of shape (elongated vs. round), size (small vs. large) and morphological heterogeneity with regard to both size and shape. For PDOM and PDOC cultures, 9 images per sample were taken at 150 μm intervals. The resulting z-stacks were merged into a single image for each sample. Structures were classified as either cystic or dense organoids. Their average size, size variability and confluency (defined as the percentage of the imaged area occupied by organoids) were evaluated descriptively. In addition, organoid diameters were quantified at day 3 and day 7 by measuring all visible PDOs within a standardized field of view (2124 μm × 2124 μm) in the merged images.
Histology and Immunohistochemistry
In vitro models were fixed in 4% paraformaldehyde (PFA) at 4 °C for 1 h, washed in PBS and embedded in histogel (Thermo Fisher Scientific, Waltham, MA, USA). For organoids, the medium was removed and 500 µL PFA was added per well. Following fixation and PBS washing, organoids were embedded in histogel. All histological and immunohistochemical analyses were conducted at the Institute of Pathology, Charité Campus Mitte, using established protocols and the following antibodies: HE (Tissue Tek Prisma Plus Automated Slide Stainer, SAKURA), p53 (DO-7, Dako, 1:50), SMAD4 (EP618Y, abcam, 1:200), GATA6 (Q92908, R&D Systems, 1:100), CDX2, CK19 (RCK108, BioGenex, 1:100), CA19-9 (1116-NS-19-9, Dako, 1:500), Ki-67 (MIB-1, Dako, 1:50) and Vimentin (V9, Dako, 1:5000) (immunostaining with BenchMark XT, Ventana Medical Systems, Tucson, AZ) and MDR1 (LSBio, LS-B5570, clone JSB-1, 1:50). GATA6 was scored on a semi-quantitative scale from 0 to 4. Vimentin was evaluated qualitatively. Ki-67, CK19, CDX2 and CA19-9 were quantified as the percentage of positively stained cells. p53 and SMAD4 staining patterns were categorized as wild-type or aberrant expression patterns (loss/overexpression). MDR1 expression was assessed by calculating H-scores39.
For correlation analysis between proliferation and organoid size, organoid diameters were measured in Ki-67-stained scans of PDOC and PDOM cultures using QuPath (version 0.6.0). For each of the four patients, ten organoids per culture condition were analyzed, resulting in a total of 80 quantified organoids. Ki-67 expression was quantified as the percentage of positively stained nuclei per organoid using QuPath-based cell detection. Data from all patients and culture conditions were pooled, and the association between organoid diameter and Ki-67 expression was assessed using Spearman correlation analysis.
Assessing growth kinetics
Growth kinetics were evaluated by assessing Time To First Split (TTFS) and Doubling Time (DT). TTFS was recorded in days and defined as the interval from tumor tissue acquisition (surgical resection or biopsy) to the first passage of the corresponding culture.
Growth assays were conducted between passages 3 and 15. Organoids were dissociated into single cells using TrypLE and counted via acridine orange/propidium iodide staining with an automated cell counter (LUNA™ Automated Cell Counter; BioCat, Heidelberg, Germany). Only suspensions with a single-cell ratio of at least 90% were used for seeding. For PDCL models, 7,000 cells per well were seeded into 96-well plates, while for PDOC and PDOM, 2,000 cells per well were embedded in 6 µL matrix domes in 96-well plates. A ROCK inhibitor (1:1000) was added to the culture medium for all models for all 7 days. Viability was assessed as an endpoint at each time point using the CellTiter-Glo® Luminescent Assay (Promega, Germany). Cells were plated on day 0 and endpoint measurements were taken after 7 days in duplicate. Cell viability was assessed using the CellTiter-Glo® assay (Promega) according to the manufacturer’s protocol. Luminescence was recorded with the VICTOR Nivo™ Multimode Microplate Reader (PerkinElmer, Germany). The mean of two technical replicates was calculated and luminescence values from days 2 to 7 were normalized to day 1. These normalized values were used to calculate doubling times (DT) and to generate growth curves.
Pharmacotyping
Drug response assays were performed between passages 3 and 15. PDCLs, PDOCs and PDOMs models were seeded in analogy to Sect. 2.6. ROCK inhibitor (1:1000) was initially added to media and maintained for the first 96 h. Drug treatment was initiated after 96 h using a 10-fold dilution series. Maximum concentrations were as follows: SN-38 (TargetMol) and Paclitaxel (TargetMol): 10 µM; Gemcitabine (TargetMol): 50 µM; Oxaliplatin (Selleckchem): 100 µM; 5-FU (Sigma-Aldrich): 1 mM. Solvent controls matched the highest drug concentration in each dilution. Cell viability was assessed 72 h post-treatment using the CellTiter-Glo® Luminescent Assay (Promega, Germany) according to the manifactures protocol. Luminescence was recorded using the VICTOR Nivo™ Multimode Microplate Reader (PerkinElmer, Germany). For each condition, three technical replicates were averaged and normalized to untreated controls. Based on the resulting percentage viability values, dose–response curves were generated and the Area Under the Curve (AUC) and IC₅₀ values were calculated by nonlinear regression. GR₅₀ values were calculated for patients 1–4 using the GRcalculator40, incorporating patient-specific doubling times. For non-measurable GR50 values, we assigned cut offs of + 3 (representing no measurable response within tested concentration; flat curve) and -4 (representing extreme sensitivity; response below tested range). To evaluate condition-dependent differences in drug response, AUC and log10GR50 values were pooled and compared between culture systems. Additionally, inter-patient variability in drug response was assessed by pooling pharmacotyping values by patient. To enable clinical comparison between patients based on relapse, relapse was defined here as the reappearance of the same tumor disease following curatively intended therapy.
Patient follow-up
All patients enrolled in this study were monitored from the date of initial resection or biopsy until their most recent assessment. The first patient was enrolled in January 2023 and last follow-up was in May 2025. Follow‑up information comprised the date of initial diagnosis, date of resection or biopsy, overall survival, disease progression, recurrence and administration of chemotherapy.
Systematic literature search on matrix usage in PDAC PDO studies
The following search query was applied: (“pancreatic ductal adenocarcinoma” OR PDAC OR “pancreatic cancer”) AND (organoid* OR tumoroid*). The search was restricted to publications from the last 10 years, English language, and human studies. Non-original publication types, including reviews, systematic reviews, meta-analyses, editorials, comments, guidelines, letters, case reports, preprints, and retracted publications, were excluded. Study selection was conducted in three stages: title screening, abstract screening, and full-text assessment. Studies were included if they reported patient-derived establishment of human PDAC organoids derived from primary patient tumor material (e.g., resection or biopsy specimens) and described 3D epithelial organoid cultures. Studies were excluded if they used exclusively murine models, relied solely on previously established organoid lines without new derivation, focused primarily on co-culture or tumor microenvironment reconstruction systems incorporating stromal or immune components, or described spheroid or 2D culture models. For all eligible studies, the extracellular matrix used for organoid embedding was extracted from the Methods section and categorized as Matrigel, Cultrex/basement membrane extract (BME), both, other matrix, or not stated.
Statistics
Statistical analyses were performed using GraphPad Prism version 10.5.0 (GraphPad Software, San Diego, CA, USA). Depending on data distribution and experimental design, unpaired two-tailed t-tests, Mann–Whitney U tests, or one-way ANOVA with Tukey’s post hoc test were used for group comparisons. Normality was assessed using the Shapiro–Wilk test. For immunohistochemistry, marker expression values were pooled according to FFPE tissue or in vitro condition and compared using one-way ANOVA. Time To First Split (TTFS) across all cultures from the 12 included patients was compared between in vitro conditions using one-way ANOVA with Tukey’s post hoc test. Correlations between doubling time and Ki-67 expression in vitro, were analyzed using linear regression. Results were considered statistically significant at p < 0.05. Data are presented as mean ± standard deviation (SD), unless otherwise specified. All experiments were conducted in at least two technical replicates.
