


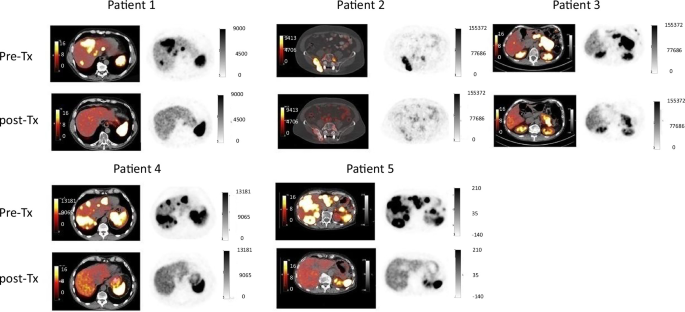
Positron emission tomography (PET) imaging
The mean injected activity was 200 MBq [⁶⁸Ga]Ga-DOTATOC, and the mean time interval from tracer injection to image acquisition was 45 min ([⁶⁸Ga]Ga-DOTATOC). PET/CT examinations were performed on a Vereos digital PET/CT scanner (Philips Healthcare, Eindhoven, Netherlands). Low-dose CT scans were performed for attenuation correction. Emission time per bed position was 2 min. PET data were reconstructed iteratively, including scatter, random, and decay correction (RAMLA 3D, 2 iterations, 0.05 relaxation).
177Lu-DOTATATE treatment
Treatment was performed as described previously [15]. Patients received a nephroprotective infusion of amino acids (2.5% lysine and 2.5% arginine in 1 L 0.9% NaCl) for over 4 h, starting 30 min before therapy with antiemetic premedication (ondansetron, 8 mg i.v.).
Cell culture
The NET cell line QGP-1 was obtained from the Japanese Cancer Research Resources Bank (JCRB, JCRB0183, Ibaraki, Osaka, Japan). Cells were cultured in RPMI 1640 medium (Thermo Fisher Scientific, Waltham, MA) containing 10% FBS, 2 mM L-glutamine, and 100 U/mL penicillin-streptomycin.
Cell proliferation assay
Cells were seeded in 24-well tissue culture plates (Sarstedt, Nümbrecht, Germany) with four replicates per experimental condition. Cells were plated at 7.5 × 10⁴ cells per well in complete growth medium and allowed to attach (day 0). Sunitinib (Selleck Chemicals LLC, Houston, TX) or ¹⁷⁷Lu-DOTATATE was added in various concentrations or doses as indicated to the appropriate wells (day 1). ¹⁷⁷Lu-DOTATATE was removed after 24 h and, after washing twice with PBS (Thermo Fisher Scientific, Waltham, MA), replaced with complete growth medium or, in combination experiments, medium containing the specified concentration of sunitinib (day 2). The medium was replaced midway through the experiment (day 6). On day 12 after seeding, plates were fixed and stained with 0.05% (w/v) crystal violet in 20% (v/v) methanol for 20 min at room temperature. Plates were then gently rinsed twice in a basin with tap water to remove excess stain and inverted to air dry overnight. After drying, 1.0 mL of methanol was added to each well and plates were briefly placed on an orbital shaker when needed to fully solubilize the bound dye. The dye was measured at 540 nm using a plate reader. For each condition, the mean absorbance was calculated from the four replicate wells and the mean blank value from wells containing medium only (processed and stained identically but without cells) was subtracted from each mean before further analysis. For calculation of cell numbers from OD values, individual calibration curves were determined for each experiment using GraphPad Prism (GraphPad Software, LLC, Version 10.0.3, San Diego, CA).
Flow cytometry
QGP-1 cells were seeded in 6-cm dishes (Sarstedt, Nümbrecht, Germany) at least one day prior to treatment. Cells were treated with 10 MBq/mL ¹⁷⁷Lu-DOTATATE for 24 h. Control cells were left untreated. Following incubation, cells were washed twice with phosphate-buffered saline (PBS), replenished with fresh culture medium and incubated for an additional 4 days, either with or without 7.25 µM sunitinib. After 5 days of total incubation, cells were detached using Accutase (Sarstedt, Nümbrecht, Germany), washed with PBS, and transferred into FACS tubes (Sarstedt, Nümbrecht, Germany). For calreticulin detection, detached cells were incubated with PE-Cy7-conjugated anti-calreticulin antibody (Cell Signaling Technology, Danvers, MA) diluted 1:50 in staining buffer (2 mM EDTA, 0.5% bovine serum albumin, and 0.09% sodium azide in PBS) (Millipore, Darmstadt, Germany). Incubation time was 30 min at room temperature in the dark. Then, cells were centrifuged and washed twice with staining buffer. The final cell pellet was resuspended in 150–250 µL staining buffer for flow cytometry analysis. Fluorescence intensity was measured using BD FACSCanto™ II (Becton, Dickinson (BD), Franklin Lakes, NJ). The data were analyzed using BD FlowJo v10 Software with regard to the geometric mean of the fluorescence intensity (gMFI) of the stained cell populations. For quantification of apoptotic cells, we used Annexin V-Elab Fluor® 647 Reagent (Elabscience Biotechnology, Houston, TX). In brief, harvested cells were resuspended in Annexin V-binding buffer (containing calcium ions). Annexin V-Elab Fluor® 647 was added according to the manufacturer’s instructions and incubated for 15 min at room temperature in the dark. To distinguish apoptotic stages, the membrane-impermeable DNA dye Hoechst 33258 (Thermo Fisher Scientific, Waltham, MA) was added simultaneously. For cell-cycle analysis, cells were fixed with 2% (PFA, methanol-free, Polysciences, Warrington, PA) on ice for 10 min with occasional gentle mixing. Cells were permeabilized with ice-cold 0.1% Triton X-100 (PanReac AppliChem, Darmstadt, Germany) in PBS on ice for 5 min. For DAPI (4′,6-diamidino-2-phenylindole, Sigma-Aldrich, St. Louis, MO) staining samples were resuspended in 250–500 µL DAPI working solution (3.5 µg/mL in PBS) and incubated for 10 min at room temperature. For flow cytometry, we used a BD FACSCanto II (Becton, Dickinson and Company, Franklin Lakes, NJ). DNA histograms were plotted on a linear scale and cell cycle fractions (percentages of cells in G0/G1, S, and G2/M phases) were quantified using BD FlowJo v10 Software upon cell doublet, aggregate, and debris discrimination via pulse processing.
Western blot
Apoptosis was also determined by Western blot analysis. Cell culture preparations were made as described for flow cytometry. Protein extraction, total protein determination, sample preparation, SDS gel electrophoresis, and Western blotting were performed as previously described. Membranes were blocked in blocking/incubation buffer (5% Amersham ECL blocking agent (Amersham Biosciences, Little Chalfont, Buckinghamshire, UK) in TBS (Carl Roth GmbH, Karlsruhe, Germany) containing 0.1% Tween-20) for 60 min at room temperature. Primary antibodies against PARP and GAPDH were rabbit monoclonal antibodies (mAbs) from Cell Signaling Technology (Danvers, MA) and diluted 1:1000 as indicated by the manufacturer in the aforementioned blocking/incubation buffer. Membranes were incubated overnight at 4°C with antibody, washed three times with incubation buffer and incubated for 60 min with peroxidase-labeled secondary antibody (Peroxidase-AffiniPure Goat Anti-Rabbit IgG (H + L), Jackson ImmunoResearch Laboratories Inc, West Grove, PA), diluted 1:10,000 in incubation buffer. For development of blots, ECL solution (SuperSignal™ West Pico PLUS Western Blotting Substrate, Thermo Fisher Scientific, Waltham, MA) and an Amersham™ Imager 600 were used (Amersham Biosciences, Little Chalfont, Buckinghamshire, UK). ImageJ (release 1.53r, Bethesda, MD, USA) and Microsoft Excel (release 2019, Microsoft Corporation) were used for semiquantitative analysis.
ELISA assays
Cells were seeded in 24-well format at least the evening before. At approximately 90% confluence, cells were treated with sunitinib and/or ¹⁷⁷Lu-DOTATATE for 24 h with the indicated concentrations. The cell culture supernatant was collected and processed according to the manufacturer’s protocol. The Human HMGB1 (Elabscience, Houston, TX) and IL-18 ELISA kit (Quantikine™ ELISA Human Total IL-18 Immunoassay, R&D Systems, Minneapolis, MN) were used.
Cytokine Array Kit
For assessment of secretion of cytokines into cell supernatants we used the Proteome ProfilerTM Array Human XL Cytokine Array Kit, R&D Systems, Minneapolis, MN. Cells were seeded in 24-well format at least the evening before. At approximately 90% confluence, cells were treated with sunitinib and/or ¹⁷⁷Lu-DOTATATE for 24 h with the indicated concentrations. The cell culture supernatant was collected and processed according to the manufacturer’s protocol.
Patient characteristics
All patients were treated at the University Hospital Bonn, Comprehensive Cancer Center. Biographical and clinical data are shown in Table 1.
Clinical chemistry
Chromogranin A (CgA), NSE, GFR, platelet counts and Hemoglobin values from patient blood samples were determined in the department of clinical chemistry in the University Hospital Bonn as part of the clinical treatment monitoring according to ISO 15189 and CLSI international clinical chemistry guidelines.
Statistics
Statistical analyses were performed using GraphPad Prism version 10.0.3 (GraphPad Software, LLC, San Diego, CA, USA). Differences among experimental groups in ELISA and flow cytometry experiments were assessed using analysis of variance (ANOVA). Densitometric data were analyzed using Student’s t test. All statistical tests were two-sided, and P values < 0.05 were considered statistically significant.
