


Study approval
All animal studies were conducted according to guidelines approved by the IACUC of the University of Michigan (protocols PRO00012850 and PRO00012853). All animals were housed in an AAALAC-accredited animal facility with a standard temperature of 22 °C ± 2 °C, 45-50% humidity, and were kept on a strict 12:12-h light:dark cycle. Mice were provided with PicoLab Laboratory Rodent Diet (Cat# 5L0D) and monitored daily for food and water consumption as well as bedding and living conditions. Studies did not discriminate by sex; both male and female mice were used. The strains of mice used in the study were C57BL/6 (the Jackson Laboratory, strain no. 000664) and CDKN2A-KO mice (Frederick National Library for Cancer Research strain no. 01XB1).
Study design
To study the impact of autophagy in the context of IDH1R132H mutant gliomas, with TP53 and ATRX inactivating mutations, we previously generated a genetically engineered animal model by injecting SB plasmids encoding NRAS-G12V, shp53, and shATRX, and with or without IDH1R132H into the lateral ventricle of one-day-old mouse pups15. Sample size and any data inclusion/exclusion were defined individually for each experiment. We also used an animal model previously generated by intracranial implantation of glioma NS (WT-IDH1 and mIDH1) derived from our genetically engineered animal model to test therapeutic responses15. Furthermore, we used human glioma cells derived from patients harboring IDH1R132H, in the context of TP53 and ATRX inactivating mutations, to confirm the results obtained from our animal models. The number of replicates is reported in the figure legends. Our studies were not randomized. We performed blinding for quantitative IHC scoring. All RNA-seq and ChIP-seq data were deposited in public databases as indicated in the respective sections. Materials and Methods are detailed in the Supplementary Materials.
Genetically engineered mutant IDH1 glioma model
All animal studies were conducted according to guidelines approved by the IACUC at the University of Michigan. All animals were housed in an AAALAC-accredited animal facility, and they were monitored daily. Studies did not discriminate by sex, and both males and females were used. The strains of mice used in the study were C57BL/6 (The Jackson Laboratories, 000664).
The wild-type (WT)-IDH1 and mIDH1 glioma models used in this study were generated previously for our group using the SB Transposon System15. The plasmid used to generate those models are: (i) SB-transposase and LUC (pT2C-LucPGK-SB100X, henceforth referred to as SB/Luc), (ii) a constitutively active mutant of NRAS, NRAS-G12V (pT2CAG-NRASV12, henceforth referred to as NRAS), (iii) a short hairpin against p53 (pT2-shp53-GFP4, henceforth referred to as shp53), (iv) a short hairpin against ATRX (pT2-shATRX53-GFP4, henceforth referred to as shATRX), and (v) mutant IDH1R132H (pKT-IDH1R132H-IRES-Katushka, henceforth referred to as mIDH1). One-day-old P01 C57BL/6 mice were used in all experiments. The genotype of SB- generated mice involved these combinations: (i) NRAS, shP53, and shATRX (WT-IDH1) and (ii) NRAS, shp53, shATRX, and IDH1R132H (mIDH1). Mice were injected according to a previously described protocol86. Plasmids were mixed in mass ratios of 1:2:2:2 or 1:2:2:2:2 (20 μg plasmid in a total of 40 μL plasmid mixture) with in vivo-jetPEI (Polyplus Transfection, 201-50G) (2.8 μL per 40 μL plasmid mixture) and dextrose (5% total) and maintained at room temperature for at least 15 min prior to injection. The lateral ventricle (1.5 mm AP, 0.7 mm lateral, and 1.5 mm deep from lambda) of one-day-old mouse pups (P01) was injected with 0.75 μL plasmid mixture (0.5 μL/min) that included: (1) SB/Luc, (2) NRAS, (3) shp53, (4) shATRX, and (5) with or without IDH1R132H. To monitor plasmid uptake in one-day-old pups, 30 μL of luciferin (30 mg/mL) was injected s.c. into each pup 24–48 h after plasmid injection. In vivo bioluminescence was measured on an IVIS Spectrum (PerkinElmer, 124262) imaging system. For the IVIS Spectrum, the following settings were used: automatic exposure, large binning, and aperture f = 1. For in vivo imaging of tumor formation and progression in 6–8-week-old adult mice, 100 μL of luciferin solution was injected i.p., and mice were then anesthetized with oxygen/isoflurane (1.5–2.5% isoflurane). To score luminescence, Living Image Software Version 4.3.1 (Caliper Life Sciences) was used. A region of interest (ROI) was defined as a circle over the head, and luminescence intensity was measured using the calibrated unit’s photons/s/cm2/sr. Multiple images were taken over a 25 min period following injection, and maximal intensity was reported.
For survival studies, animals were monitored daily for signs of morbidity, including ataxia, impaired mobility, hunched posture, seizures, and scruffy fur. Animals displaying symptoms of morbidity were intracardially perfused using Tyrode’s solution, followed by fixation with 4% paraformaldehyde (PFA) in PBS.
Alternative genetically engineered mouse glioma models
In CPA/CPAI models, the genetic lesions were incorporated into one-day-old CDKN2A homozygous knocked-down (CDKN2A-/-) mice12. CDKN2A-/- mice were obtained from the Frederick National Library for Cancer Research as frozen embryos. Embryos were implanted into receptive adult B6 females by the Transgenic Animal Core of the University of Michigan, and the obtained transgenic mice, which were CDKN2A heterozygous, were mated with B6 mice. The CDKN2A-KO heterozygous mice of the second generation were mated, and the progeny obtained were genotyped to confirm the homozygous CDKN2A deletion. From this point, the CDKN2A-/- colony was maintained by mating CDKN2A-/- mice and monitored regularly by CDKN2A genotyping. The genotype of the genetically engineered mice involved these combinations: (i) CDKN2A deletion, TP53 and ATRX short hairpin knockdown, with or without IDH1-R132H. The CPA/CPAI models were confirmed via western blotting analysis.
In the RPA/RPAI models, glioma was driven by platelet-derived growth factor receptor alpha mutation (PDGFRAD842V) to promote constitutive activation of the MAPK pathway18. These mouse glioma cells include ATRX and TP53 short hairpin knockdown, with or without endogenous expression of IDH1-R132H, to simulate the molecular genetic lesions that define the molecular features of astrocytoma.
Primary glioma neurosphere cultures (NS)
Mouse glioma neurosphere (NS) cultures were generated as described above15,87. Briefly, brain tumors in mice were harvested at the time of euthanasia by intracardial perfusion with Tyrode’s solution only. The tumor mass was dissociated using non-enzymatic cell dissociation buffer, filtered through a 70 µm strainer and maintained in neural stem cell medium DMEM/F12 with L-Glutamine (Gibco, 11320-033), B-27 supplement without Vitamin A (1×) (Gibco, 12587-010), N-2 supplement (1×) (Gibco, 17502-048), Penicillin-Streptomycin (100X) (10,000 IU Penicillin) (10,000 µg/mL Streptomycin) (Corning, Cellgro, 30-001-CI), and Normocin (1×) (Invivogen, ant-nr-1) at 37 °C, 5% CO2. Human-EGF (Peprotech, 100-15) and human-FGF (Peprotech, 100-18) were added twice weekly at 1 µL (20 ng/µL each stock) per 1 mL medium for a final concentration of 20 ng/mL. For reduced growth conditions, human-EGF and human-FGF were added twice weekly at 1 µL (20 ng/µL) per 3 mL medium for a final concentration of 6.6 ng/mL. These genetically engineered mouse cell models were confirmed via western blotting analysis.
Human glioma cell culture
Patient-derived mIDH1 glioma cells, SF10602, were characterized and generously provided by Dr. Joseph Costello from the University of California, San Francisco47. Patient-derived mIDH1 glioma cells, MGG119, were characterized and generously provided by Dr. Daniel Cahill from Harvard University Medical School88. Patient-derived mIDH1 glioma cells, LC1035, were characterized by the University of Michigan Neurosurgery Department (IRB approval code HUM00175135 and HUM0024610)89. The work reported in this manuscript does not constitute Human Subjects Research.
Human SF1060247 cells were grown in NeuroCult NS-A Basal Medium supplemented with 100 units/mL antibiotic-antimycotic, 10 mL B-27 without vitamin A, 5 mL N-2, 100 μg/mL normocin, 20 ng/mL FGF, 20 ng/mL EGF, and 20 ng/mL PDGF-AA. Human MGG11988 and LC1035 GCCs were grown in Neurobasal medium supplemented with 100 units/mL antibiotic-antimycotic, 10 mL B-27, N-2, 100 μg/mL normocin, 20 ng/mL FGF, 20 ng/mL EGF, and 20 ng/mL of PDGF-AA. Glioma cells were dissociated using StemPro Accutase solution and passaged weekly. Human glioma cells were shared through the following collaborations: Dr. Daniel Cahill’s laboratory, Harvard Medical School (MGG119), and Dr. Joseph Costello’s laboratory, UCSF (SF10602). LC1035 was generated in our laboratory through our collaboration with the University of Michigan’s Department of Neurosurgery.
RNA-seq and bioinformatics analysis
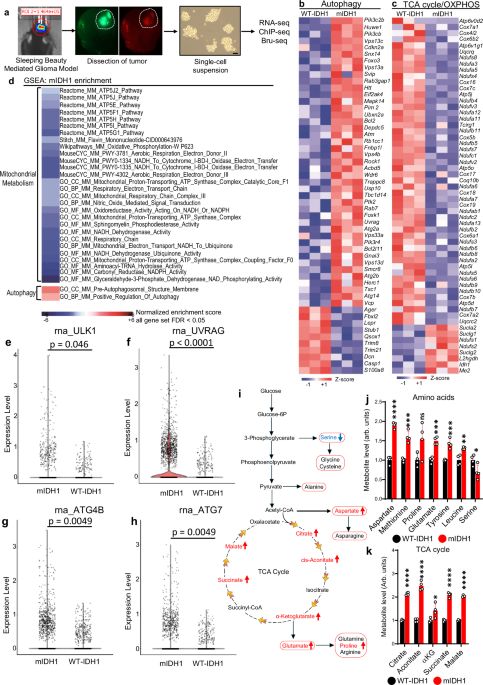
RNA-seq was performed in collaboration with the University of Michigan sequencing core. All the RNA-seq datasets used to identify differential enrichments related to metabolism and autophagy were previously generated in our lab15 with public access. Briefly, RNA was isolated from tumor NS, and 100 ng samples of purified RNA were sent for RNA-seq analysis. After passing all quality controls, Illumina HiSeq 2500/4000 fastq files were processed using the Tuxedo Suite for alignment and differential expression analysis. Genes and transcripts were identified as differentially expressed based on three criteria: test status = “OK”, FDR ≤ 0.05, and fold-change ≥ ±1.5. Gene Ontology (GO) enrichment analysis, which was performed using iPathwayGuide (http://www.advaitabio.com/ipathwayguide) separately for upregulated and downregulated genes. GO Biological Processes, selected for relevance to phenotype, were plotted in a horizontal bar graph using R. Gene set analysis (GSA) was performed using the R package GSA (http://statweb.stanford.edu/~tibs/GSA/), which implements a version of Gene Set Enrichment Analysis (GSEA)90 with improved power statistics91. GSA takes an expression matrix and a gene set collection as input. The Gene Set Knowledgebase (GSKB) data package (version 1.3.0) was downloaded from Bioconductor. GSKB is specific to mice and includes annotation from over 40 sources. GSA outputs significant gene sets (FDR ≤ 0.05), both negatively and positively correlated to phenotype, as well as normalized enrichment scores, and the lists of genes contributing to the significance of each gene set (FDR ≤ 0.05). For each list of genes found in a GSKB functional term we tested for enrichment in a small set of Gene Ontology terms, selected for relevance to the phenotype, using the hypergeometric test in R. After RNA-seq analysis, enrichment maps were generated using the Cytoscape platform with enrichment map; the designation of node color was amended to complement our RNA-seq expression color scheme of positively (red) and negatively (green) regulated pathways. The stringency of FDR was reduced to truly encapsulate the underlying biological ramifications of ATRX and IDH1 mutations in our transposon-mediated tumor formation model. Heatmaps were plotted with the Heatmap2 package in R. RNA-seq datasets have been deposited in NCBI’s Gene Expression Omnibus with identifiers GSE94902, GSE94974, and GSE94975.
Bru-seq and bioinformatics analysis
The Bru-seq dataset used in this work to compare transcriptional levels of genes related to metabolism and autophagy was previously generated15. The protocol used was described in Paulsen et al.92. Nascent RNA labeling was performed for 30 min at 37 °C with 2 mM 5-bromouridine in conditioned medium. The cells were then incubated for 6 h at 37 °C. At the completion of labeling, the cells were lysed in TRIzol, and the Bru-containing RNA was isolated using anti-BrdU antibodies conjugated to magnetic beads. The isolated RNA was converted into cDNA libraries and prepared for sequencing using the Illumina TruSeq RNA Library Preparation Kit v2 followed by deep sequencing to around 50 million single-end 50-nucleotide reads. A bioinformatics and data analysis pipeline was implemented using the q pipeline manager (http://sourceforge.net/projects/qppln-mngr/). The bioinformatics programs used, read mapping, genome annotation, and expression scoring, were previously described in section 2.4 of ref. 92. RPKM (reads per kilobase per million mapped reads) values were calculated for individual genes that were at least 300 bp long. For genes with lengths of 30 kb and less, RPKM values were calculated using read counts from the entire gene. For genes longer than 30 kb, an RPKM value was calculated using read counts from the first 30 kb downstream of the TSS. The R package DESeq35 was used to test differential expression of genes where the mean RPKM between samples was greater than 0.5. Significant changes in transcription initiation were defined as follows: adjusted p-values < 0.05; fold-change <1.5.
ChIP-sequencing and bioinformatics analysis
Both mouse and human ChIP-seq datasets were previously published15,18. For the ChIP-seq data analysis for this study, the ChIP-seq raw data quality was assessed using FastQC 0.11.3, and the adapters were trimmed using TrimGalore 0.4.4. ChIP-seq and input reads were aligned to the mouse reference genome (mm10) using bowtie293 with default options, and the uniquely mapped reads were extracted for peak calling. The post-alignment quality control steps were performed by Deeptools 2 3.5.194. PePr95 was used to identify the differential peaks between WT-IDH1 and mIDH1 groups using FDR < 0.05 and fold-change >3 as the cutoffs. The identified peaks were annotated to genomic features 1–5 kb upstream of the promoter, promoter, intron, exon, UTR, CDS, and intergenic regions (using the Bioconductor annotatr package96). As a comparison, the same number of peaks were randomly generated across the same chromosome and annotated the same way by annotatr. Gene set enrichment testing was performed on the identified differential peaks by the Bioconductor package ChIPenrich97 to detect enriched Gene Ontology Biological Process Terms.
Cleavage Under Targets & Release Using Nuclease (CUT&RUN)
CUT&RUN was performed using the CUTANA ChIC/CUT&RUN kit (Epicypher #14-1048) following the manufacturer’s protocol. Briefly, 1 × 10⁶ NS cells were coupled with Concanavalin A beads, permeabilized with 0.01% Digitonin, and incubated overnight at 4 °C with 0.5 μg target antibody in antibody buffer (H3K4me3 Antibody – SNAP-Certified™ for CUT&RUN, Epicypher #13-0041, H3K27ac Antibody, SNAP-Certified™ for CUT&RUN and CUT&Tag, Epicypher #13-0059). The following day, cells were first incubated for 10 min with micrococcal nuclease fused to proteins A and G (pAG-MNase), which was then activated by CaCl2 addition. After 2 h incubation at 4 °C, the reaction was stopped with stop buffer, and E. coli DNA was added as spike-in DNA. DNA was then isolated using SPRI beads and quantified with Qubit. Libraries were prepared using CUTANA™ CUT&RUN Library Prep Kit, following the manufacturer’s recommendations. Fragment size was detected using a TapeStation system, and multiplexed libraries were sequenced on an AVITI24 sequencer (Element Biosciences) at 150 bp paired-end reads. Data analysis was performed the same way as described in the “ChIP-sequencing and bioinformatics analysis” section.
CUT & RUN qPCR
CUT & RUN was performed as previously described. qPCR was performed on a QuantStudio 3 Real-Time PCR System (Applied Biosystems) using SYBR Green qPCR Master Mix Fast SYBR Green Master Mix (Applied Biosystems). Primers were designed based on the CUT & RUN sequencing. The primers sequences we used are: Atg9b_1_F: CTTTGTTGTTGCCTCACCCG, Atg9b_1_R: ACTCATGGCCTTGGGAATGG, Atg9b_2_F: GAGATCCTCCTTCCCCCAGT, Atg9b_2_R: TCAGTGCCTCTGCTCCCTAT, Atg9b_3_F: CGGGTACATGAAGCAAGGGT, Atg9b_3_R: GGGCTTCTCAGACTCCACAC.
Human single-cell RNA-seq
Human glioma scRNA-seq was performed and analyzed as described above12. The data has been deposited in NCBI’s Gene Expression Omnibus with identifier GSE152273. Briefly, primary mIDH1 human glioma cells, SF10602, were cultured for 7 days in the presence or absence of specific IDH1R132H inhibitor AGI-5198. 3′ single-cell libraries were generated using the 10X Genomics Chromium Controller following the manufacturer’s protocol for 3′ V3.1 chemistry with NextGEM Chip G reagents (10X Genomics). Final library quality was assessed using the TapeStation 4200 (Agilent), and libraries were quantified by Kapa qPCR (Roche). Pooled libraries were subjected to 150 bp paired-end sequencing according to the manufacturer’s protocol (Illumina NovaSeq 6000). Raw sequencing data files were converted to fastq files and aligned to the human reference genome hg38 using the Cell Ranger Pipeline 7.0.0 (10X Genomics). The data were clustered, and gene expression was analyzed using the Seurat R package. Pathway enrichments were performed by the Gene Set Variation Analysis (GSVA) package98. Two biological replicates for each condition (wt-IDH1 and mIDH1) were analyzed. An average sequencing depth of 20,000 reads/cell was recovered for each sample we processed.
Human glioma cells stably transfected to express IDH1R132H
SJGBM2 pediatric glioma cells are ATRX mutant, and they were cultured in IMDM medium with L-glutamine (0.3 mg/mL) (Gibco, 12440061), 20% FBS (Peak Serum, PS-FB3), and antibiotic-antimycotic (1×) (Gibco, 15240-062) at 37 °C, 5% CO2. SJGBM2 cells were seeded in a 6-well plate (1.5 × 10⁵ each per well), and after 24 h they were transfected with the p-CMV-IDH1R132H-Entry plasmid using the jetPRIME transfection system (VWR, 89129-922). One day after transfection, the medium was replaced with selection medium containing G418 (Gibco, 10131027) at a concentration of 800 µg/mL. On day 15 of selection, individual cell colonies were taken from the well using autoclaved filter paper squares (2 × 2 mm approx.) previously embedded in HyQTase Cell Detachment Solution (TroyBiologicals, SV3003001) and placed within wells of 24-well plates with the appropriate cell culture medium. After 24 h, the medium was replaced with selection medium. Each well corresponded to an isolated colony that was expanded for in vitro experiments. IDH1R132H protein expression was confirmed by WB assay15. For reduced growth conditions, FBS was reduced to a final concentration of 5%. SJGBM2 cells were confirmed by Dr. Patrick Reynolds99, and SJGBM2-mIDH1 cells were confirmed in our laboratory via western blotting analysis.
Metabolomics profiling
Mutant IDH1 and WT NS (3 × 10⁶ cells) were seeded in four T75 flasks (n = 4 per cell type) in complete media as described above (Supplementary Fig. 2). A parallel plate for protein estimation and sample normalization was also set up with the same number of cells. After overnight incubation, the culture media was aspirated off and replaced with fresh media. The cells were then cultured for a further 24 h. For intracellular metabolites, the media and cells were centrifuged to separate the cells and media. The media was aspirated off and the samples washed once with 1 mL cold PBS before isolating the cells again. The cells were then incubated with 1 mL ice-cold 80% methanol on dry ice for 10 min. Thereafter, cell lysates were collected from each well and transferred into separate 1.5 mL Eppendorf tubes. At this point, the samples could be placed at −80 °C until ready for use. Once removed from −80 °C, they were thawed on ice for 5 min before being centrifuged at 12,000 × g. The volume of supernatant to collect for each experimental condition was then determined based on the protein concentration of the parallel plate. The collected supernatants were dried using a SpeedVac Concentrator, reconstituted with 50% v/v methanol in water, and analyzed by mass spectrometry100.
Targeted metabolomics was performed on an Agilent 1290 Infinity II Binary Bio LC coupled with an Agilent 6495 d QqQ mass spectrometer. Two methods were utilized in this study on the same instrumentation. For method one, the column used was an Agilent InfinityLab Poroshell 120 HILIC-Z, 2.1 × 150 mm, 2.7 μM (p/n 683775-924). Method parameters are as follows: Solvent A is water + 20 mM ammonium acetate (pH 9.3) + 5 μM medronic acid. Solvent B is acetonitrile. Wash solvent is 1:1:1 water, acetonitrile, and methanol. The solvent gradient is 10% A – 90% B until 1 min, 22% A – 78% B until 8 min, 40% A – 60% B until 12 min, 90% A – 10% B until 15 min, hold until 18 min, and 10% A – 90% B until 19 min, hold until 23 min. Flow rate is 0.4 mL/min. Column temperature is set to 15 °C. Source parameters are optimized for the Agilent dMRM (dynamic multiple reaction monitoring) library. The dMRM library was acquired from Agilent for their HILIC-Z platform and further optimized to screen for 435 targets in both positive and negative ion modes.
Method 2 utilized an Agilent ZORBAX RRHD Eclipse Plus C18, 100 × 2.1 mm, 1.8 μm (p/n 959758-902) column. Solvent A was water + 0.1% formic acid. Solvent B is methanol + 0.1% formic acid. Wash solvent is 1:1 water and methanol. The solvent gradient is100% A until 3 min, 5% A – 95% B until 5 min, hold until 7 min, 100% A until 8 min, hold until 10 min. Flow rate is 0.2 mL/min. Column temperature is set to 45 °C. Source parameters reflect method 1. The dMRM acquisition list includes 12 targets optimized by analytical standards in both positive and negative ion modes.
Data from both methods was preprocessed using Agilent MassHunter Workstation Quantitative Analysis for QQQ Version 12.1. This process includes manual inspection of chromatograms to verify accurate area-under-the-curve (AUC) readings, which are then reported as raw abundance of metabolites. Quality control pooled samples are inspected to evaluate instrument stability and signal-to-noise ratios for metabolites within the experiment dataset. While transitions for 435 metabolites are included in the screen, only those with verified peak shapes are kept during preprocessing.
Finalized raw data was normalized by median-centering, and then further fold-change analysis was performed relative to control groups to achieve relative abundance. Student’s t-tests were performed with an alpha level of 0.1. Heatmaps were generated in Morpheus (Morpheus, https://software.broadinstitute.org/morpheus).
Measurement of metabolites in genetically engineered mouse mIDH1 glioma models
Mouse mIDH1 glioma NS (RPA/RPAI and NPA/NPAI) were prepared according to the protocols outlined by the following metabolomics kits: Citric Acid Colorimetric Assay Kit (Elabscience, E-BC-K351-M), Succinic Acid Colorimetric Assay Kit (E-BC-K902-M), Alpha-Ketoglutarate Assay Kit (Cell Biolabs Inc., MET-5131), Malic Acid Colorimetric Assay Kit (Elabscience, E-BS-K905-M), and Glutamine Synthetase Activity Colorimetric Assay Kit (Elabscience, E-BC-K664-M).
Western blot
Mouse NS and human glioma cells (1.0 × 10⁶ cells) were harvested for each genotype, and total protein extracts were prepared in a RIPA lysis and extraction buffer (Thermo Fisher Scientific, Pierce, 89900) with 1× Halt protease and phosphatase inhibitor cocktail (Thermo Fisher Scientific, 78442). 20 μg of protein extract (determined by bicinchoninic acid assay (BCA), Pierce, 23227) was separated by 4–12% SDS-PAGE (Thermo Fisher Scientific, NuPAGE, NP0322BOX) and transferred to nitrocellulose membranes (Bio-Rad, 1620112). The membrane was probed with 1:1000 of a rabbit anti-p62 Ab (Cell Signaling Technology, 5114, Lot: 6), 1:2000 of a rabbit anti-ATG9b Ab (Novus Biologicals, NBP1-77169, Lot #5797-1702), 1:1000 of a rabbit anti-ATG7 Ab (Cell Signaling Technology, 8558, Lot: 5), 1:1000 of a rabbit anti-pULK1 (S555) Ab (Cell Signaling Technology, 5869, Lot: 3); 1:1000 of a rabbit anti-pULK1 (S757) Ab (Cell Signaling Technology, 6888, Lot: 3); 1:1000 of a rabbit anti-ULK1 (Cell Signaling Technology, 8054, Lot: 9); 1:2000 of a rabbit anti-MST4 Ab (Abcam, ab52491, Lot #1007309-3); 1:1000 of a rabbit anti-ATG4b Ab (Cell Signaling Technology, 5299, Lot: 2); 1:1000 of a rabbit anti-phosphoATG4b Ab (Cell Signaling Technology, 19386, Lot: 1); 1:1000 of an anti-UVRAG Ab (Abcepta, AP1850d); 1:1500 of a rabbit anti-LC3I/II Ab (Novus Biologicals NB100-2220, Lot #D155067-7); 1:2000 of an anti-β-actin Ab (Cell Signaling Technology, 3700, Lot: 23 and 16), then followed by secondary [Dako, Agilent Technologies, goat anti-rabbit 1:4000 (P0448), Lot #41372205; goat anti-mouse 1:4000 (P0447), Lot: 41705282]. Enhanced chemiluminescence reagents were used to detect the signals following the manufacturer’s instructions (SuperSignal West Femto, Thermo Fisher Scientific, 34095). Blots were imaged using a ChemiDoc (Bio-Rad ChemiDoc™ MP System). WB quantification was performed using ImageJ, and the reported data are from three replicates. For the cells treated with α-ketoglutarate (α-KG), mIDH1 mouse NS (5.0 × 10⁵ cells) were treated with 2.5 mM α-KG (Cayman Chemicals, 876150-14-0) for 5 h prior to protein extraction. For o-2HG treatment, cells were incubated in 1.5 mM (2 R)-Octyl-α-hydroxyglutarate (Cayman Chemicals, 1391194-67-4) for 5 h prior to protein extraction.
Western blot assay of histones
To assess specific histone markers’ post-translational modifications, histone extracts were obtained using the Histone Purification Mini Kit (Active Motif, 40026), and WB were performed on 1.5 µg of histone extract. Histone markers’ specific antibodies were as follows: 1:1000 of H3K4me3 antibody (Hologic Diagenode, C15410003, Lot #A8034D); 1:1000 of H3K36me3 antibody (Hologic Diagenode, C15410192, Lot #A1845P); 1:2000 of H3K27me3 antibody (Millipore, B07- 449, Lot #4258307) for human glioma cell protein extracts; 1:1000 of H3K27me3 antibody (Hologic Diagenode, C15410195, Lot #A3236P); and 1:2000 of total histone H3 antibody (Cell Signaling Technologies, 4499, Lot: 20).
Metabolic flux assay
To assess metabolic activity, oxygen consumption rates (OCR) and extracellular acidification rates (ECAR) were performed using the XF-96 Extracellular Flux Analyzer (Agilent). Cells were washed and resuspended in nonbuffered DMEM, adjusted to pH~7.4. WT-IDH1 and mIDH1 cells (1 × 10⁵ cells/well) were seeded on laminin-coated plates and allowed to equilibrate for 30 min in a non-CO2, 37 °C incubator. OCR and ECAR were measured under basal conditions and in response to the following mitochondrial inhibitors: oligomycin (1 μM), FCCP (1 μM), rotenone (100 nM), and antimycin A (1 μM). After the assay, OCR and ECAR measurements were normalized to cell number using CyQuant NF analysis (Invitrogen). For o-2HG treatment, cells were incubated in 2.5 mM (2 R)-Octyl-α-hydroxyglutarate (Cayman Chemicals, 1391194-67-4) for 5 h before assessing metabolic activity.
Autophagy flux assay using mCherry-GFP-LC3 construct
Lentiviral particles expressing mCherry-GFP-LC3 were generated by the University of Michigan Vector Core using the FUW mCherry-GFP-LC3 plasmid57, which was a gift from Anne Brunet. WT-IDH1 and mIDH1 SJGBM cells were cultured in a T-12.5 flask and infected with Lenti-mCherry-GFP-LC3 particles at a concentration of 1X of lentivirus. After 36 h, 5 × 10⁴ cells were plated in a confocal microscopy chamber cover glass system, in the presence or absence of 10 μM of chloroquine, and cultured for 12 h before analysis of GFP and mCherry expression by confocal microscopy.
Confocal microscopy and image analysis
Cells were placed into the incubator chamber of the microscope at 37 °C with a 5% CO2 atmosphere. Confocal microscopy images were acquired using a single-photon laser scanning inverted confocal microscope LSM 880 AxioObserver (Carl Zeiss, Jena, Germany). Two laser lines were used for simultaneous excitation with a Plan-apochromat 63×/1.4 numerical aperture (NA) oil DIC M27 objective. Cells transfected with mCherry-GFP-LC3 were excited at 488 nm and 561 nm, and cells stained with MitoTracker™ green dye at 405 nm and 488 nm wavelength, respectively. Line-sequential scan mode and 1.4 scan zoom were used. The system was driven by ZEN Black software. Multichannel immunofluorescence images were processed and analyzed using Fiji (NIH). Autophagosome (green) and autolysosome (red) were manually identified and quantified using the plug-in Cell Counter.
In vitro experiments with radiation and autophagy inhibitors
WT-IDH1 and mIDH1 mouse NS and human glioma cells (i.e., NPA/NPAI, SJGBM2/SJGBM2 mIDH1, and SF10602/SF10602 with AGI-5198) were plated at a density of 1 × 10³ cells/well in a 96-well plate 24 h before treatment. WT-IDH1 and mIDH1 mouse NS (NPA/NPAI) were then incubated with either ATG7 siRNAs (100 nM; Origene, SR427399), ATG4b siRNAs (100 nM; Origene, SR413163), ULK101 (1 µM; SelleckChem, S8793), or NSC185058 (5 µM; Cayman Chemical, 23957) in combination with 3 Gy of IR, 2 h post-inhibitor treatment. Human glioma cells (SJGBM2/SJGBM2 mIDH1, and SF10602/SF10602 with AGI-5198) were then incubated with either ATG7 siRNAs (150 nM; Origene, SR323157), ATG4b siRNAs (150 nM; Origene, SR323518), ULK101 (3 µM; SelleckChem, S8793), or NSC185058 (15 µM; Cayman Chemical, 23957) in combination with 5 Gy (SJGBM2/SJGBM2 mIDH1) or 20 Gy (SF10602/SF10602 with AGI-5198) of IR, 2 h post-inhibitor treatment. Cell viability was evaluated 72 h post-IR treatment using CellTiter-Glo 2.0 (Promega, G9242) luminescence cell viability assay, following the manufacturer’s protocol. The resulting luminescence was read with the Enspire Multimodal Plate Reader (PerkinElmer, 2300-0000). Data were represented graphically using GraphPad Prism software (version 8), and statistical significances were determined using Student’s t-test.
In vitro experiments with radiation and α-ketoglutarate
Mutant IDH1 mouse NS and human mIDH1 glioma cells (i.e., CPAI, RPAI, NPAI, and human mIDH1 SF10602) were plated at a density of 1 × 10³ cells/well in a 96-well plate 24 h before incubation with Octyl-α-ketoglutarate (α-KG; Cayman Chemicals, 876150-10-0). Mouse mIDH1 NS were incubated with 0.3 mM α-KG in combination with 3 Gy of IR, 2 h post-inhibitor treatment. Human glioma cells (human mIDH1 SF10602 cells) were then incubated with 1.5 mM α-KG in combination with 30 Gy of IR, 2 h post-inhibitor treatment. Cell viability was evaluated 72 h post-IR treatment using CellTiter-Glo 2.0 (Promega, G9242) luminescence cell viability assay, following the manufacturer’s protocol. The resulting luminescence was read with the Enspire Multimodal Plate Reader (PerkinElmer, 2300-0000). Data were represented graphically using GraphPad Prism software (version 8), and statistical significances were determined using Student’s t-test.
In vitro experiments with radiation and chloroquine and hydroxychloroquine
Mutant IDH1 mouse NS and human mIDH1 glioma cells (i.e., NPAI, RPAI, and human mIDH1 SF10602) were plated at a density of 1 × 10³ cells/well in a 96-well plate 24 h before incubation with either Chloroquine (CQ; Invivogen, tlrl-chq-4) or Hydroxychloroquine (HCQ; Millipore Sigma, H0915). Mouse mIDH1 NS were treated with 10 µM of CQ in combination with 3 Gy of IR, 2 h post-inhibitor treatment. Human glioma cells (human mIDH1 SF10602 cells) were treated with 10 µM of CQ in combination with 30 Gy of IR, 2 h post-inhibitor treatment. Mouse mIDH1 NS cells were treated with 50 µM of HCQ in combination with 3 Gy of IR, 2 h post-inhibitor treatment. Human glioma cells (human mIDH1 SF10602 cells) were treated with 50 µM of HCQ in combination with 30 Gy of IR, 2 h post-inhibitor treatment. Cell viability was evaluated 72 h post-IR treatment using CellTiter-Glo 2.0 (Promega, G9242) luminescence cell viability assay, following the manufacturer’s protocol. The resulting luminescence was read with the Enspire Multimodal Plate Reader (PerkinElmer, 2300-0000). Data were represented graphically using GraphPad Prism software (version 8), and statistical significances were determined using two-tailed Student’s t-test.
In vitro dose-response and evaluation of radiosensitivity using mitochondrial electron transport chain inhibitors
To assess the susceptibility of both mutant and WT-IDH1 human (SJGBM2 WT-IDH1/ SJGBM2 mIDH1 and SF10602/SF10602 with AG-881) and mouse NS (NPA/NPAI, CPA/CPAI, and RPA/RPAI) to mitochondrial electron transport chain inhibitors (mETCi), two Complex I inhibitors were used: Rotenone (SelleckChem, S2348) and Metformin (SelleckChem, S1950) under normal and growth factor-starved conditions. Both cell lines were plated at a density of 1000 cells per well in a 96-well plate (Fisher, 12-566-00) 24 h prior to treatment, where wells per inhibitor dose (1 μM, 2.5 μM, 5 μM, 10 μM, 20 μM, and 30 μM) were evaluated for each cell type. Cells were then incubated for 3 days under normal (EGF: 1:1000, FGF: 1:1000, and PDGFα: 1:1000 dilutions) as well as growth factor-starved conditions (EGF: 1:3000, FGF: 1:3000, and PDGFα: 1:3000 dilutions) and viability was assessed using the CellTiter-Glo 2.0 assay (Promega, G9242) following manufacturer’s protocol. To assess radiosensitivity of each cell line, cells were incubated with either free Rotenone or Metformin, or in combination with radiation at their respective IC50 doses for 72 h in triplicate wells per condition. Cells were pre-treated with both inhibitors 2 h prior to IR with 3 Gy for mouse, 5 Gy for SJGBM2, and 20 Gy for SF10602 of radiation, respectively. Resulting luminescence was read with the Enspire Multimodal Plate Reader (PerkinElmer, 2300-13 0000).
Release of cytokines in response to autophagy inhibition and radiation
To assess the release of cytokines (DAMPs and type-I IFNs) into the conditioned media, mIDH1 mouse NS and human glioma cells were seeded at a density of 1 × 10⁶ cells/well in 6-well plates and allowed to settle overnight before treatment. The following day, mIDH1 mouse NS were treated with either ATG7 (100 nM; Origene, SR427399) or ATG4b (100 nM; Origene, SR413163) for 2 h prior to exposure to 3 Gy of IR, and the human glioma cells were treated with either ATG7 (150 nM; Origene, SR323157) or ATG4b (150 nM; Origene, SR323518) for 2 h prior to exposure to 5 Gy of ionizing radiation. After 72 h, the levels of various cytokines in the cultures’ supernatants were measured using ELISA, either following the manufacturer’s protocol (Novus Biologicals) or at the Cancer Center Immunology Core, University of Michigan.
Implantable syngeneic murine glioma models
Both male and female C57BL/6 mice, aged 6–8 weeks old, were used for implantation models. Intracranial tumors were established by stereotactic injection of 5 × 10⁴ WT-IDH1 or mIDH1 mouse tumor NS into the right striatum using a 22-gauge Hamilton syringe (1 μL/min) with the following coordinates: +1.00 mm anterior, 1.8 mm lateral, and 3.5 mm deep. The presence of tumors was verified 5 days post-implantation (DPI) by bioluminescence imaging.
For survival studies, animals were monitored daily for signs of morbidity, including ataxia, impaired mobility, hunched posture, seizures, and scruffy fur. Animals displaying symptoms of morbidity were intracardially perfused using Tyrode’s solution, followed by fixation with 4% paraformaldehyde (PFA) in PBS.
Generation of autophagy-deficient mouse model using SB transposon system
Using the SB transposon system86, we generated a glioma model harboring IDH1R132H, shATRX, and shP53 as described above15, plus a shRNA for ATG7 (shATG7) to disrupt the autophagy pathway in the tumor. The shATG7 candidates were obtained from the Codex database (http://cancan.cshl.edu/cgi-bin/Codex/Codex.cgi) and cloned into the pT2 plasmid, replacing shATRX sequences from our previous PT2-shATRX construction87, generating the pT2-ATG7-BFP. A WB assay was performed to select the best candidate to use for the generation of the animal model. The selected shATG7-A (HP_603911) (CTCGAGTGCTGTTGACAGTGAGCGACCAGAAGAAGTTGAACGAGTATAGTGAAGCCACAGATGTATACTCGTTCAACTTCTTCTGGGTGCCTACTGCCTCGGAGAATTC) was finally used in the combination cocktail of plasmids. Sleeping-beauty-derived glioma cells NPA and NPAI were transfected using jetPEI (VWR, catalog 89129-960) with the plasmid pT2-shATG7-EBFP and sleeping-beauty transposase plasmid (Supplementary Fig. 30a, b). After transfection, cells were allowed to grow for 72 h then they were subjected to FACS for isolation of BFP cells. These cells were sorted 3 times each before confirming ATG7 knockdown via Western Blot assay.
Generation of iRGD synthetic protein nanoparticle (SPNP) with siRNA against ATG7
SPNP formulation
The preparation of the SPNP formulations followed previously reported methods but with modifications46. In the basic formulation, two solutions were prepared separately, then combined. HSA (7.5% w/v) was solubilized in a solvent system comprised of ultrapure deionized water and ethylene glycol (80:20 v/v). The peptide, iRGD, was then added along with BSA Alexa Fluor 647 conjugate (0.25% w/w relative to the albumin) to produce fluorescently labeled SPNPs. Then, the siRNA, which was resuspended according to the manufacturer’s protocol, was complexed for 30 min at room temperature under rotation with 60 kDa branched polyethyleneimine (5% w/v) before also being added to the serum albumin solution. Next, a bi-functional macromer, O,O′-Bis[2-(N-Succinimidyl-succinylamino)ethyl]polyethylene glycol, was added at 10% w/w relative to the HSA solution. Once mixed, the two solutions were mixed to form the final formulation. For empty SPNP groups, all the components that were added in the iRGD ATG7i-SPNPs were included except for the ATG7 siRNA.
SPNP fabrication
SPNPs were fabricated via electrohydrodynamic jetting46. The parameters used were the same as above. Briefly, the final formulation was loaded into 1 mL syringes equipped with a 1.5” 25-gauge stainless steel blunt needle. It was pumped at a rate of 0.2 mL/h to form droplets at the base of the needle. A voltage source was connected to the needle and grounded at the collection plate, located 6 inches from the base of the pump. The voltage was typically adjusted to a range between 8 kV and 15 kV to achieve a stable Taylor cone whereby rapid evaporation of the solvent occurred, creating solid nanoparticles on the collection plate. The collection plate was replaced with a clean plate every 30 min until the solution within the syringe emptied. The collection plates were enclosed and incubated for 7 days at 37 °C to form stable crosslinks.
SPNP collection and processing
After the 1wk period of incubation, the SPNPs on collection plates were removed. About 3–4 mL of 0.01% Tween 20 in DPBS was added to each pan and physically agitated with plastic razor blades to release the SPNPs from the plate. The SPNP suspension was collected into a Falcon tube. Each pan was agitated with fresh 0.01% Tween 20 in DPBS three times. The collected SPNPs were tip sonicated at an amplitude of 7 for 30 s (1 s on and 3 s off) in an ice bath to break up aggregates, strained through a 40 µm filter into a new Falcon tube, then centrifuged at 3220 RCF for 5 min. The supernatant was removed and distributed into 2 mL Eppendorf tubes and centrifuged for 1 h at 4 °C at 21,500 RCF. The supernatant was discarded, and the resulting pellets were combined into a single 2 mL tube. The particles were washed two times with fresh DPBS without Tween 20.
SPNP characterization
Scanning electron Microscopy: Scanning electron microscopy samples were prepared by placing a silicon wafer on top of the collection plate during the jetting process. The samples were then placed on a copper tape-covered scanning electron microscopy stub, then gold-coated for 40 s and visualized through the FEI NOVA 200 SEM/FIB instrument. The dry-state SPNP quantification of morphology parameters was conducted through ImageJ analysis101.
Dynamic Light Scattering: The hydrodynamic diameter and zeta potential were determined through dynamic light scattering on the Malvern Zetasizer. Samples were prepared by diluting the stock sample in DPBS and measured in folded capillary zeta cells. An average of at least three measurements was used to characterize each sample.
Bicinchoninic acid assay (BCA assay): BCA assay was used to quantify SPNP concentration. A standard curve was prepared for every SPNP concentration quantification measurement.
In vitro mouse T cell proliferation assay
To evaluate the effect of the combination of radiation (IR) treatment and autophagy inhibition, we tested the effect of IR (2 Gy) and the administration of iRGD nanoparticles loaded with a siRNA against ATG7 (ATG7i-SPNP) in vivo. Twenty mice were implanted with mIDH1-OVA mouse tumor NS as stated above, and 7 days post-implantation, mice were divided into the following 4 groups (n = 5 mice): Control (no treatment); ATG7i-SPNP only; IR only; and IR + ATG7i-SPNP. Mice were treated with 2 Gy IR for five consecutive days. ATG7i-SPNP (2.0 × 10¹¹ particles) was administered 3 times total, once every other day starting on day 5. The mice were euthanized, and the spleens were collected on day 21 post-implantation.
The spleens were collected to analyze the development of anti-tumor immune response. Splenocyte processing was performed as detailed previously102. The splenocytes were cultured with 100 nM of SIINFEKL for 24 h in 10% FBS media with 55 µM 2-ME. Cells were then stained with anti-CD45, anti-CD3, and anti-CD8 antibodies, and proliferation was assessed by CFSE dye dilution. All flow data were acquired on a FACSAria flow cytometer (BD Biosciences) and analyzed using FlowJo version 10 (Treestar).
IHC of paraffin-embedded brains
Following perfusion, mouse brains were fixed in 4% paraformaldehyde (PFA) for an additional 48 h at 4 °C, then transferred to 70% ethanol, and processed and embedded in paraffin at the University of Michigan Microscopy & Image Analysis Core Facility using a Leica ASP 300 paraffin tissue processor/Tissue-Tek paraffin tissue embedding station (Leica). Tissue was sectioned using a rotary microtome (Leica) set to 5 μm in the z-direction. Antigen retrieval and IHC of paraffin-embedded sections were performed using antibodies and dilutions as follows: Tissue sections were blocked with blocking solution (1× PBS with 0.2% Tween 20 with 5% Goat Serum) for 2 h. Sections were incubated with the following primary antibodies: anti-CD3ε (Cell Signaling, 99940, Lot: 4); anti-CD68 (Abcam, ab125212, Lot #1091902); anti-MBP (Millipore, MAB386, Lot: 4231803); anti-GFAP (Millipore, AB5541, Lot #4031343) at 4 °C overnight. Tissue sections were then labeled with Secondary Biotinylated Ab (1:1000) in PBS with 0.2% Tween 20 for 15 min at RT, then 4 °C overnight. ABC Avidin-Biotin-COMPLEX Binding was done using VECTASTAIN ABC Reagent (Vectastain Elite ABC-HRP kit; Vector Laboratories, PK-6100). Sections were incubated for 1 h with VECTASTAIN ABC Reagent in the dark and then washed with gentle agitation. Colorimetric Detection of Peroxidase was performed using the Betazoid DAB Chromogen kit (BioCare BDB2004) according to the manufacturer’s instructions. Afterward, Hematoxylin Counterstain was done, and coverslips were mounted with a xylene-based mounting medium and allowed to dry on a flat surface at room temperature until imaging. Images were obtained using brightfield/epifluorescence (Zeiss Axioplan2, Carl Zeiss MicroImaging) or laser scanning confocal microscopy (Leica DMIRE2, Leica Microsystems) and analyzed using LSM5 software (Carl Zeiss MicroImaging). Immunostaining was performed using the Discovery XT processor (Ventana Medical Systems).
To assess ATG7 expression levels post treatment of ATG7i-SPNPs, we implanted mice intracranially with 2 × 10⁴ NPAI cells on Day 0. At day 10, mice were randomly divided into 2 groups of 3 mice each. One group was treated with saline and the other group with ATG7i-SPNPs in combination with IR. Mice received a total of 10 Gy of radiation over 5 days. Mice were administered three doses of ATG7i-SPNPs (2 × 10¹¹) at days 10, 12, and 14. At the end of day 14, mice were perfused, and brain and liver tissues were collected for further analysis. Brain sections from these mice were stained for MBP (myelin basic protein) (Millipore, MAB386, Lot: 4231803), GFAP (glial fibrillary acidic protein) (Sigma, AB5541, Lot #4205396), ATG7 (Invitrogen, PA5-35203, Lot #ZH4433739), and cleaved Caspase-3 (Cell Signaling, 9661, Lot: 47). Quantification of markers was done using absolute counts of 3 representative images and the statistical analyses were conducted using two-tailed Student’s t-test.
To assess the immune profile in mIDH1-glioma-bearing mice immediately post treatment with ATG7i-SPNPs, we implanted mice intracranially with 2 × 10⁴ NPAI cells on Day 0. At day 10, mice were randomly divided into 3 groups of 3 mice each. One group was treated with saline, one group was treated with IR, and the final group was treated with ATG7i-SPNPs in combination with IR. Mice received a total of 10 Gy of radiation over 5 days. Mice were administered three doses of ATG7i-SPNPs (2 × 10¹¹) at days 10, 12, and 14. At the end of day 14, mice were perfused, and brain and liver tissues were collected for further analysis. Brain sections from these mice were stained for anti-CD4 (Cell Signaling Technology, 48274, Lot: 3), anti-CD8 (Abcam, ab217344, Lot: 1112658-20), anti-CD11c (Novus biologicals, MAB6950-SP, Clone #435421), anti-NK1.1 (BioLegend, 108702, Lot: B255763), anti-CD68 (Abcam, ab125212, Lot #1091902), and anti-IBA1 (Abcam, ab178846, Lot #1090399-30). Quantification of markers was done using absolute counts of 3 representative images, and the statistical analyses were conducted using two-tailed Student’s t-test.
Statistical analysis
All quantitative data are presented as the mean ± SEM from at least three independent samples. ANOVA and two-sample t-tests were used to compare continuous outcomes between groups. Survival curves were analyzed using the Kaplan–Meier method and compared using Mantel–Cox tests; the effect size is expressed as median survival (MS). Differences were considered significant if P < 0.05. All analyses were conducted using GraphPad Prism software (version 6.01), SAS (version 9.4, SAS Institute), or R (version 3.1.3). The statistical tests used are indicated in each figure legend.
Reporting summary
Further information on research design is available in the Nature Portfolio Reporting Summary linked to this article.
