


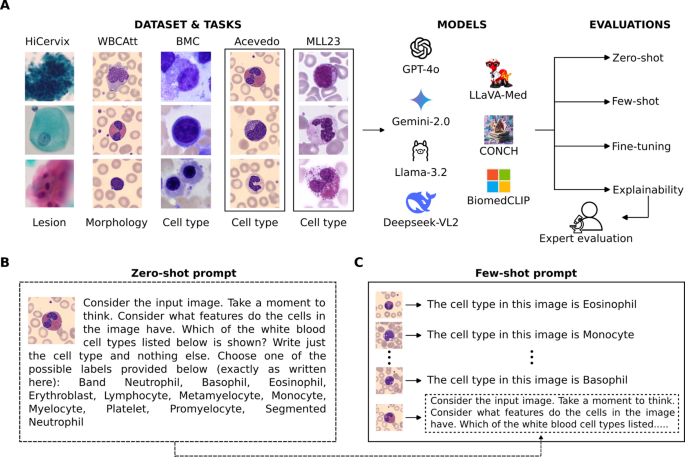
We evaluated four generalist large vision-language models (LVLMs) and three medical hematology-specific LVLMs on four different data sets (Fig. 1) and quantified their performance using the weighted F1 score (Table 1). As a reference, we considered the performance of models reported in the original papers of the respective dataset. Given that the LVLMs mostly performed much worse than SOTA, we also compared them to random guessing models. Weighted F1 performance of a random model was calculated based on class distribution. LVLMs perform very poorly on zero-shot cell classification tasks, often yielding results similar to random performance and consistently far below the performance of models specifically designed for these tasks. For instance, the highest LVLM score for bone marrow cell classification (BMC) was 0.09 ± 0.02 (achieved by Gemini-2.0), compared to 0.05 for random guessing, and 0.75 for the model reported in the original study (Table 1). Similarly, for the cervical smear dataset, Gemini-2.0 achieved the best score of 0.06 ± 0.01, while the random model scores 0.04, and the reference model reached an average accuracy of 0.83. Notably, GPT-4o frequently stated that it did not know the answer to this task, likely due to the scarcity of publicly available cervix cytomorphology datasets.
Table 1 Large visual language models (LVLMs) remain substantially below published benchmarks, performing close to random models.
The confusion matrices (Fig. 2A) for zero-shot blood cell classification on the Acevedo data set show that current LVLMs tend to misclassify cells into a few dominant classes: GPT-4o, Gemini-2.0, and Llama-3.2 predominantly assigned cells to lymphocytes or segmented neutrophils, while LLaVA-Med consistently classified cells as bands or segmented neutrophils. The computational pathology model CONCH mostly classified cells as segmented neutrophils or myelocytes.
Few-shot learning improved the performance, nearly doubling the scores for GPT-4o and Gemini-2.0 across most tasks (Table 1). For instance, Gemini-2.0 bone marrow cell classification score increased to 0.19 ± 0.02, while its cervical smear classification score improved to 0.15 ± 0.02. However, the scores remained closer to random model performance and still far from the state-of-the-art results. Figure 2B visualizes the improved confusion matrices for blood cell classification in the Acevedo data. Few-shot learning led to more diagonally aligned confusion matrices for GPT-4o and Gemini-2.0, indicating better classification. Llama-3.2 performed worse in few-shot learning, yielding even lower accuracy than in the zero-shot setting. DeepSeek-VL2 and LLaVA-Med did not produce sensible output in a few-shot setting. DeepSeek-VL2 generated erroneous text composed of random numbers and letters (for example “11–12-1–1-1–1-1–1-1–1-3–1-1–1-3–1-1…”), while LLaVA-Med either gave no response or simply noted the presence of red blood cells and described their function (for example “RBCs (red blood cells) are the most common cell type in the blood. They are responsible for transporting oxygen to the body’s tissues and organs.”).
We fine-tuned GPT-4o and DinoBloom on the Acevedo blood cell classification task (a data set which none of the models had been pretrained on), varying the number of training images per class, and evaluated performance on a left out test set (Fig. 3A). Model performance improved rapidly with increasing dataset size: With 10 images per class, GPT-4o’s weighted F1 score rose from 0.22 ± 0.02 (no fine-tuning) to 0.55 ± 0.06, further improving to 0.65 ± 0.05 with 50 images per class, to 0.74 ± 0.04 with 100 images per class, and plateauing from there on (Fig. 3A). Interestingly, a simple MLP trained on DINOv2 and DinoBloom models learns significantly faster and better than GPT-4o. In particular the hematology foundation model DinoBloom20 excels, achieving scores of 0.79, 0.86, and 0.87 for 10, 50, and 100 images per class, significantly outperforming GPT-4o at every training size with p < 10–4 (Fig. 3A, Supplementary Table 1; paired bootstrap test). The confusion matrices for fine-tuned GPT-4o and DinoBloom reveal that misclassifications primarily occur between morphologically similar cell types, such as myelocytes vs. metamyelocytes or segmented vs. band neutrophils—categories that are inherently difficult to distinguish (Fig. 3B).
To assess model generalizability, we evaluated the fine-tuned GPT-4o and DinoBloom on the out-of-distribution MLL23 test set (Fig. 3A, C). Notably, both models were fine-tuned for Acevedo cell classification. While GPT-4o was better at n = 1 and models had a similar performance at n = 5, 25, DinoBloom, with an MLP head, consistently and significantly outperformed GPT-4o at other values of n with p < 10–4 (Supplementary Table 2, paired bootstrap test). At n = 200, DinoBloom achieved a weighted F1 score of 0.54, compared to 0.50 for the fine-tuned GPT-4o. The zero-shot GPT-4o classification performance on MLL23 was low at 0.19, only slightly above the random baseline of 0.10. Confusion matrices reveal that misclassifications mostly occurred between cell types that are morphologically close to each other (Fig. 3C).
To assess the degree of explainability provided by LVLMs, we examined whether they could identify the morphological features underlying their blood cell classifications. For each cell in the test set, models were asked to first classify the image and then assign importance scores to 19 predefined morphological features, such as nuclear shape, chromatin pattern, cytoplasmic appearance, and granularity (see Methods for details and prompts). The models produced cell-type-specific feature-importance patterns, with moderate differences between models (Fig. 4A). For example, all models consistently assigned high importance to nuclear shape. Some of the highlighted features were biologically plausible and aligned with expert reasoning, such as nuclear segmentation for segmented neutrophils, cell size for platelets, and chromatin pattern and cell size for eosinophils. However, the models also missed important expert-defined features. For instance, granule presence and granule type, which are central for recognizing eosinophils, were not consistently identified as important. In addition, nucleoli were considered important for platelets, although platelets lack both nuclei and nucleoli. These findings suggest that LVLMs can sometimes report relevant morphological cues, but their explanations remain incomplete and do not fully capture expert cytomorphological reasoning.
We next asked an expert cytomorphologist to assess free text explanations for 10 images per cell type (5 correctly and 5 incorrectly classified by the best performing LVLM, the fine-tuned GPT-4o, see Fig. 4B for examples) on the following scale: 1—excellent, 2—good, 3—fair, 4—poor, 5—misleading. Explanations for correctly classified cell images received an average score of 1.1 ± 0.3 (mean ± s.d., n = 55), while wrongly classified images received a considerably lower score of 2.8 ± 1.4, with 30% of explanations being rated as poor or misleading. Explanations for incorrect classifications often missed or misinterpreted key white blood cell features (Fig. 4B). For example, the model described a kidney-shaped, unsegmented nucleus as segmented in a misclassified metamyelocyte, and incorrectly characterized the cytoplasmic granulation of a misclassified eosinophil as fine and non-eosinophilic. These examples suggest that the model often generated textbook-like descriptions of the predicted cell type rather than explanations grounded in the actual morphological features visible in the image. To evaluate GPT-4o’s vision capabilities, we asked the model to perform step-by-step segmentations (Fig. 4D). GPT-4o demonstrated a good understanding of cellular components by correctly identifying and segmenting relevant structures, but occasionally struggled with cell types such as platelets, basophils and erythroblasts (Supplementary Fig. 1).
In the free text answers, the models were also asked how certain they were about their classification decision. Their answers were evaluated using GPT-4o and sorted into the following confidence scores (conf): 1—very confident, 2—confident, 3—neutral, 4—non-confident, 5—very non-confident. We computed the correlation coefficient (corr) between the confidence scores and correctness of the predicted label. We also computed mean and standard deviation of the confidence scores separately for the answers with correctly predicted labels and those with wrong labels. The results for the top performing models are: GPT-4o: corr = 0.03, confcorrect = 2.05 ± 0.62, confwrong = 2.08 ± 0.62, fine-tuned GPT-4o (n = 200): corr = 0.20, confcorrect = 1.63 ± 0.54, confwrong = 1.87 ± 0.47, gemini-2.0: corr = 0.05, confcorrect = 1.82 ± 0.55, confwrong = 1.87 ± 0.44, Llama-3.2: corr = 0.002, confcorrect = 2.14 ± 0.79, confwrong = 2.14 ± 0.83. For the fine-tuned GPT-4o where we also had an expert evaluation of the answers available, we computed the correlation coefficient between the model’s confidence and the score assigned by the expert: corr = -0.01. We see that models were generally confident about their decisions even when the predicted classes were wrong. Llama-3.2 was less confident than the other models but independent whether the predicted label was correct or wrong. The only model that showed at least a tiny bit of correlation with the correctness of the predicted label and its confidence was fine-tuned GPT-4o, however 0.20 is still rather low. This came in combination with an even increased overall confidence of the model.
