


HSP90 interacts with ROC1
To elucidate the upstream regulatory mechanism responsible for ROC1 overexpression in lung adenocarcinoma (LUAD), we initially compared the mRNA expression level of ROC1 in tumor tissues and the paired adjacent normal tissues. Bioinformatics analysis of TCGA database revealed that the transcriptional level of ROC1 in human lung adenocarcinoma had no significant variation (Supplementary Fig. 1a). Consistently, RNA extraction and qPCR assay further confirmed the mRNA level of ROC1 had no statistical difference between tumor tissues and the paired adjacent tissues (Supplementary Fig. 1b). These phenomena suggest that dysregulation of protein post-translational modification may be the primary reason for the high expression of ROC1 in LUAD patients.
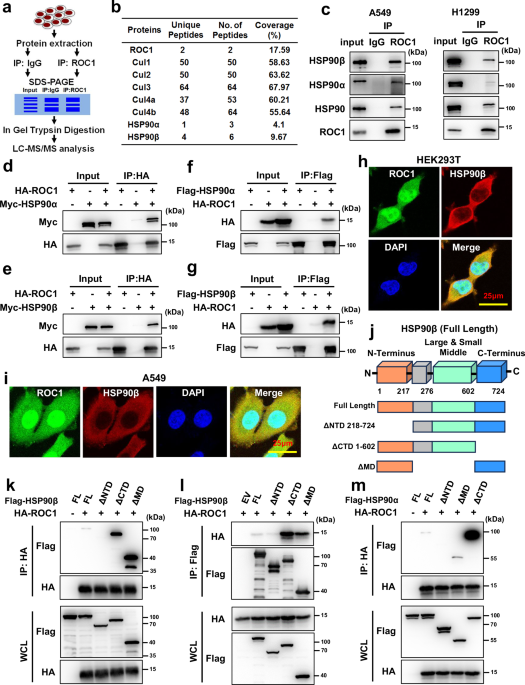
To elucidate the regulatory mechanism of ROC1 degradation in LUAD, we performed Co-IP with ROC1 primary antibody coupled with mass spectrometry to systematically screen ROC1-binding proteins (Fig. 1a). The results revealed that besides Cullin family proteins, which are well-documented ROC1-interacting members,28,29 two HSP90 subtypes, HSP90α and HSP90β, were also captured in this experimental setting (Fig. 1b). Endogenous Co-IP and Western blot analysis further demonstrated that ROC1 specifically pulled down HSP90, HSP90α and HSP90β in the detected A549 and H1299 cell lines (Fig. 1c). Consistent with aforementioned mass spectra findings and endogenous bindings, ectopic overexpression of HA-ROC1 in HEK293T cells also interacted with Myc-HSP90α and Myc-HSP90β, respectively (Fig. 1d, e). Reverse Co-IP detection further proved that exogenous overexpression of Flag-HSP90α and Flag-HSP90β also successfully seized HA-ROC1 (Fig. 1f, g). Moreover, Immunofluorescence assay (IF) with the anti-ROC1 Ab and anti-HSP90α or HSP90β Ab displayed co-localization of ROC1 with HSP90α or HSP90β in the cytoplasm of HEK293T and A549 cells, respectively (Fig. 1h, i and Supplementary Fig. 1c–f).
Fig. 1
ROC1 is a newly identified and validated HSP90-interacting protein. a Schematic illustration of mass spectrometry-based proteomic strategy for identifying ROC1-interacting proteins. b The peptides derived from HSP90α and HSP90β were identified. c A549 and H1299 cells were starved overnight, pre-treated with MG132 for 6 h, and then harvested for immunoprecipitation with ROC1 primary antibody and Western blot against ROC1, HSP90, HSP90α and HSP90β. d, e HA-ROC1 and Myc-HSP90α or Myc-HSP90β were ectopically transfected into HEK293T cells, HA affinity beads were used to pull down the HA-ROC1-combined proteins, Myc-HSP90α and Myc-HSP90β were detected by Western blot. f, g Flag-HSP90α or Flag-HSP90β and HA-ROC1 and were ectopically transfected into HEK293T cells. Flag affinity beads were used to pull down the Flag-combined proteins, HA-ROC1 were detected using Western blot. h, i Immunofluorescence was performed to locate ROC1 and HSP90β in HEK293T and A549 cells. j–m Flag-tagged-Full-length, N-Terminal deletion (ΔNTD), middle domain deletion (ΔMD), and C-Terminal deletion mutants (ΔCTD) of HSP90α and HSP90β were constructed. These truncated mutants were individually co-transfected with HA-tagged ROC1 into HEK293T cells. Subsequent Co-IP assays using HA or Flag affinity beads were performed to map the precise domains of HSP90α and HSP90β responsible for interacting with ROC1
HSP90 contains three conserved domains, including the N-Terminal domain, the C-Terminal domain, and the Middle domain.26,30 To map the exact domain of HSP90 interacted with ROC1, we constructed a series of truncated mutants of HSP90α and HSP90β (Fig. 1j and Supplementary Fig. 1g), which were then co-transfected with HA-ROC1 into HEK293T cells. Notably, Co-IP assays suggested that the N-Terminus of HSP90α and HSP90β mediated their interaction with ROC1, as confirmed by both C-Terminus deletion mutants (for HSP90α, amino acids 1–629; for HSP90β, amino acids 1–602) and M domain deletion mutants of HSP90α and HSP90β (for HSP90α, amino acids 1–272 and 630–732; for HSP90β, amino acids 1–217 and 603–724) interacted with ROC1, while N-Terminus deletion mutants of HSP90α (for HSP90α, amino acids 211–732) and HSP90β (for HSP90β, amino acids 218–724) failed to bind ROC1 (Fig. 1k–m and Supplementary Fig. 1h). These results demonstrate that the molecular chaperone HSP90 family binds to ROC1 with the N-Terminus in LUAD cells.
HSP90 protects ROC1 from ubiquitination-mediated degradation
Previous studies have shown that HSP90 acts as a molecular chaperone, promoting the correct folding of its client proteins and abrogating their degradation by E3 ubiquitin ligases.8,30,31,32 In the present study, we intended to determine whether HSP90 regulates the stabilization of ROC1. First, we employed two N-Terminal small molecular inhibitors of HSP90, 17-AAG and STA-9090, to inactivate HSP90 in the four detected lung adenocarcinoma cell lines, respectively. Immunoblotting results showed that pharmacological inhibition of HSP90 markedly decreased the protein levels of its client substrate AKT13 and ROC1 in a dose-dependent manner, while exerting little effect on ROC2 (the other Ring-domain-containing protein) (Fig. 2a, b and Supplementary Fig. 2a, b). Consistent with the above results, AUY-922, another N-Terminal inhibitor of HSP90, also markedly reduced ROC1 protein abundance (Fig. 2c). Subsequently, we investigated the effects of HSP90 N-Terminal inhibitors on ROC1 mRNA expression. RNA extraction and qPCR assays demonstrated that STA-9090 and 17-AAG had no notable effect on the total mRNA level of ROC1 (Fig. 2d and Supplementary Fig. 2c, d). To further verify the inhibitory effect of HSP90 inactivation on ROC1 expression, we knocked down HSP90AA1 and HSP90AB1 using the CRISPR-Cas9 system. The results revealed that single knockdown of HSP90AB1 (Fig. 2e), but not HSP90AA1 (Fig. 2f), led to a marked reduction in ROC1 protein level, indicating that HSP90β exerts a pivotal role in maintaining ROC1 protein stability. Besides, three HSP90 C-Terminal inhibitors cis-diamminedichloroplatinum(II) (cisplatin, CDDP), novobiocin (NB), and epilgallocatechin-3-gallate (EGCG)18,33,34 were also employed to treat A549 cells. However, immunoblotting analysis revealed that HSP90 C-Terminal inhibitors failed to induce any notable reduction in ROC1 expression (Supplementary Fig. 2e–g). These data revealed that the N-Terminal inhibitors of HSP90, but not the C-Terminal’s, downregulate ROC1 by accelerating its degradation.
Fig. 2
Inactivation of HSP90 promotes the degradation and ubiquitination of ROC1. a, b A549 and H1299 cell lines were treated with STA-9090 or 17-AAG for 24 h, and then subjected to Western blot with AKT, ROC1, ROC2, and β-actin primary antibodies. c Immunoblotting was performed to determine the protein levels of ROC1 upon treatment with AUY-922 in A549 and H1299 cells. d A549 cells were treated with STA-9090 or 17-AAG and subjected to qPCR with ROC1 primers (n = 3). e Immunoblotting was performed to determine the protein expression of ROC1 upon knocking down HSP90AB1 in A549 and H1299 cells. f Immunoblotting was utilized to detect the protein expression of ROC1 upon knocking down HSP90AA1 in A549 and H1299 cells. g–j A549 and H1299 cells were treated with STA-9090 or 17-AAG in combination with MG132, followed by Western blot to detect the protein levels of ROC1 and p27 (n = 3). The band density was measured by densitometric analysis using ImageJ software. k A549 and H1299 cells were treated with DMSO, 17-AAG, or STA-9090 in combination with MG132 for 12 h, followed by Co-IP with ROC1 primary antibody and Western blot to detect the polyubiquitination of ROC1. l A549 and H1299 cells were first treated with DMSO, 17-AAG, or STA-9090 in combination with MG132 for 12 h, and then subjected to Co-IP with ub primary antibody and Western blot to detect the polyubiquitination of ROC1. m A549 cells were treated with DMSO, 17-AAG or STA-9090 combined with MG132 for 12 h. Cell lysates were then harvested for Co-IP using ROC1 primary antibody, followed by immunoblotting to detect K48-linked polyubiquitination of ROC1. Data were represented as mean ± SD in (d, h, j). Statistical analysis were performed by one-way ANOVA for (d) and the two-tailed unpaired Student’s t-test for (h, j) (ns not significant; **P < 0.01)
Ubiquitin proteasome and lysosome are the two main systems for protein degradation in eukaryotic cells.35,36 To explore the exact pathway through which HSP90 inhibitors induce the reduction of ROC1, we treated A549 and H1299 cells with a combination of HSP90 inhibitors and the proteasome inhibitor MG132 or the lysosome inhibitor CQ. Our results showed that MG132 treatment markedly abolished the downregulation of ROC1 induced by 17-AAG and STA-9090 (Fig. 2g–j), whereas CQ treatment exerted no such inhibitory effects (Supplementary Fig. 2h–k). To confirm the above results, we further investigated whether inhibition of HSP90 altered the ubiquitination level of ROC1. Co-IP assays with both ub and ROC1 primary antibodies indicated that HSP90 inhibition greatly increased the polyubiquitination of ROC1 (Fig. 2k–m and Supplementary Fig. 2l). These results demonstrate that inactivation of HSP90 promotes the polyubiquitination of ROC1 and its subsequent proteasomal degradation.
CHIP E3 ubiquitin ligase binds to and mediates the degradation of ROC1
Given that HSP90 stabilizes ROC1 by preventing its degradation by proteasome, it’s necessary to reveal the precise E3 ubiquitin ligase that regulates the ubiquitination and degradation of ROC1 upon HSP90 inhibition. The E3-substrate interaction calculation model indicated that BRCA1, ITCH, CDC34, FZR1, and CHIP were predicted with confidence to be the underlying E3 ubiquitin ligase of ROC1 (Supplementary Fig. 3a). To screen potential E3 ligases responsible for ROC1 ubiquitinated degradation, we knocked down each of the five candidates via siRNAs or sgRNAs. Notably, only CHIP depletion increased ROC1 protein abundance, whereas knockdown of the remaining four E3 ligases showed no such effect (Fig. 3a and Supplementary Fig. 3b, c). As expected, qPCR assay showed that CHIP deletion didn’t increase the total mRNA level of ROC1 (Supplementary Fig. 3d). In contrast, overexpression of HA-CHIP gradually reduced ROC1 protein levels in a dose-dependent manner (Fig. 3b).
Fig. 3
CHIP binds with ROC1 and mediates its degradation. a CHIP was depleted with CPRSPR-Cas9 system, total proteins were extracted and subjected to Western blot using antibodies against ROC1, CHIP, and β-actin. b HA-tagged CHIP was transfected into H1299 and HEK293T cells. Total proteins were extracted and subjected to Western blot using antibodies against ROC1, HA, and β-actin. c HA-tagged wild-type CHIP, H260Q mutant CHIP, P269A mutant CHIP or K30A mutant CHIP were respectively co-transfected with Flag-ROC1 to HEK293T cells. Exogenous ROC1 level was determined by Western blot. d, e CRISPR-Cas9 system was used to knockdown CHIP in A549 and H1299 cell lines. Cycloheximide (CHX) was used to block protein synthesis, and protein lysates were subjected to Western blot using antibodies against CHIP, ROC1, and β-actin (n = 3). The band density was measured by densitometric analysis using ImageJ software. f Flag-tagged CHIP and HA-tagged ROC1 were transfected into HEK293T and H1299 cells. Total cell lysates were subjected to Co-IP with Flag affinity beads, followed by immunoblotting against HA and Flag. g–i HA-tagged full-length, U-box domain deletion (ΔU-box), TPR domain deletion (ΔTPR), U-box only, and CC domain only mutants of CHIP were respectively co-transfected with Flag-ROC1 into HEK293T cells. The Co-IP assay using Flag affinity beads were performed to identify the exact domain of CHIP that interacted with ROC1. j, k HA-tagged CHIP and Flag-tagged ROC1 were transfected into H1299 cells for 36 h, followed by treatment with MG132 for another 12 h. Total protein were extracted and subjected to immunoblotting against HA and Flag (j). Cytoplasmic proteins and nuclear proteins were separated and subjected to Western blot using indicated primary antibodies (k). l HEK293T cells were transfected individually or co-transfected with Flag-ROC1, HA-ub, and Myc-CHIP. Co-IP assays were performed using Flag affinity beads, followed by Western blot against Flag-ROC1 and HA-ub. m, n CHIP-deleted A549 cells were pre-treated with MG132 for 12 h, and then subjected to Co-IP with ub primary antibody (m) or ROC1 primary antibody (n), followed by immunoblotting to detect the polyubiquitination of ROC1. Data were represented as mean ± SD in (e). Statistical analysis were conducted using the two-tailed unpaired Student’s t-test (**P < 0.01; ***P < 0.001)
Previous studies have reported that the H260Q and P269A mutations abolish the E3 ubiquitin ligase activity of CHIP, whereas the CHIP K30A mutant fails to bind to HSP70.21,37,38,39 To determine whether CHIP-mediated ROC1 downregulation depends on its E3 ubiquitin ligase activity and HSP70 binding, we transfected HEK293T cells with HA-tagged wild-type CHIP, as well as H260Q, P269A and K30A CHIP mutants, and subsequently examined exogenous ROC1 protein levels. Ectopic expression of wild-type CHIP significantly decreased exogenous ROC1 protein expression, while H260Q, P269A, and K30A mutants of CHIP almost eliminated this effect (Fig. 3c), indicating that CHIP mediates ROC1 reduction with its E3 ligase activity and in a HSP70-dependent manner. To further elucidate the impact of CHIP on ROC1 turnover rate, we utilized cycloheximide to inhibit protein translation and assessed ROC1 stability after CHIP depletion. The results showed that CHIP depletion greatly hindered the degradation of ROC1 and prolonged its half-life in the two tested cell lines (Fig. 3d, e).
Based on the above results, we further investigated the interaction between CHIP E3 ligase and ROC1. We first performed structural docking simulation of the CHIP-ROC1 complex, and the results confirmed the interaction between CHIP and ROC1 (Supplementary Fig. 3e). Further endogenous Co-IP assays using anti-ROC1 antibody failed to pull down CHIP in wild-type A549 and H1299 cells (data not shown). In contrast, exogenous Co-IP verified robust binding between Flag-CHIP and HA-ROC1 in both HEK293T and H1299 cells (Fig. 3f). This may be attributed to the low endogenous expression level of CHIP in lung cancer cells or the preferential binding of endogenous ROC1 to HSP90, which blocks its interaction with CHIP. CHIP contains a TPR domain essential for chaperone binding, a coiled-coil (CC) domain, and a U-box domain responsible for ubiquitin ligase activity. To pinpoint the interaction domain(s) of CHIP and ROC1, we constructed several truncate mutations of CHIP (Fig. 3g). Co-IP assays displayed that CC domain of CHIP mediated the physical interaction with ROC1 in cells (Fig. 3h, i), which is consistent with the molecular docking results (Supplementary Fig. 3e). In spite of having two potential nuclear localization signals, the CHIP protein was reported to mainly localize in cytoplasm, especially in tumor cells.21,40 As expected, IF staining revealed that CHIP was expressed in the cytoplasm of A549 and H1299 cells (Supplementary Fig. 3f). The cytoplasmic and nuclear protein fractionation assay further revealed that CHIP-induced ROC1 degradation occurred in the cytoplasm, and this process was markedly inhibited by the proteasome inhibitor MG132 (Fig. 3j, k).
CHIP promotes the ubiquitination of ROC1
Having confirmed that CHIP mediates ROC1 degradation via its E3 ubiquitin ligase activity, we next examined the effect of CHIP on ROC1 ubiquitination. Co-IP assays demonstrated that the ectopic overexpression of Myc-tagged CHIP obviously increased the ubiquitination of Flag-ROC1 in HEK293T cells (Fig. 3l). In contrast, CHIP deletion markedly suppressed the polyubiquitination of ROC1(Fig. 3m, n and Supplementary Fig. 3g, h). To identify the ubiquitin attachment sites on ROC1 by CHIP, we constructed a total of six lysine (K)-to-arginine (R) point mutants of ROC1 and determined whether CHIP mediates ROC1 ubiquitination and degradation through these lysine residues (Fig. 4a). Compared with wild-type ROC1, only the ROC1-K26R mutant, but not the other 5 K to R point mutants could remarkably avoid reduction by CHIP overexpression (Fig. 4b). Consistent with this finding, the degradation rate of the ROC1-K26R mutant was much lower than that of wild-type ROC1 (Fig. 4c, d). Additionally, we performed ubiquitination assays to detect the impact of CHIP on the ROC1-K26R mutant. Notably, the ROC1-K26R mutant evaded ubiquitination by CHIP, indicating that K26 of ROC1 is the primary ubiquitin attachment site catalyzed by CHIP (Fig. 4e). To further characterize the type of CHIP-mediated polyubiquitin linkage on ROC1, we co-transfected ROC1 with wild-type-ubiquitin, or indicated ubiquitin K-only mutants. Our data showed that CHIP promoted the conjugation of the wild-type-polyubiquitin chain and K48-only-linked polyubiquitin chain to ROC1 (Fig. 4f). Together, our data demonstrate that CHIP promotes the K48-linked ubiquitin-mediated polyubiquitination on the K26 site of ROC1.
Fig. 4
CHIP promotes the ubiquitination of ROC1. a Diagram of the structure and lysine (K) mutants of ROC1. b HEK293T cells were transfected with the indicated plasmids for 48 h and then harvested for Western blot analysis. c, d Flag-tagged wild-type ROC1 or ROC1-K26R were co-transfected with HA-tagged CHIP to HEK293T cells, treated with 50 μg/mL CHX for the indicated time points, and then harvested for Western blot (c, n = 3). The band density was measured by densitometric analysis using ImageJ software (d). e HEK293T cells were transfected with indicated plasmids and then harvested for Co-IP with Flag affinity beads and Western blot analysis. f HA-tagged ubiquitin and ubiquitin KO (only the indicated K remained, another 5 K were mutated) mutants were co-transfected with Flag-tagged ROC1 and Myc-tagged CHIP to HEK293T cells and then harvested for Co-IP with Flag affinity beads and Western blot assays. g A549 cells were treated with DMSO, 17-AAG, or STA-9090 in combination with MG132 for 12 h, and then subjected to Co-IP with ROC1 primary antibody and Western blot using ROC1 and CHIP primary antibodies. h–k CHIP-deleted A549 cells were treated with STA-9090 and 17-AAG, and then harvested for Western blot for ROC1, CHIP and β-actin (n = 3). The band density was measured by densitometric analysis using ImageJ software. Data were represented as mean ± SD in (d, j, k). Statistical analysis was performed by the two-tailed unpaired Student’s t-test for (d) and one-way ANOVA for (j, k) (**P < 0.01; ***P < 0.001; ****P < 0.0001)
Next, we further assessed the interaction between ROC1 and CHIP under HSP90 inhibition. Co-IP assays revealed that both pharmacological blockade of HSP90 and siRNA-mediated HSP90 silencing significantly enhanced the binding of ROC1 to the E3 ligase CHIP (Fig. 4g and Supplementary Fig. 3i). Moreover, we investigated whether CHIP knockout affected the reduction of ROC1 induced by HSP90 inhibition. As shown, CHIP depletion prevented the reduction of ROC1 triggered by STA-9090 and 17-AAG (Fig. 4h–k). These results demonstrate that CHIP E3 ligase could interact with and govern the ubiquitinated degradation of ROC1 in lung cancer cells.
HSP90 inhibition suppresses ROC1-regulated downstream signaling in vitro and in vivo
It is well known that ROC1, as an important oncoprotein, significantly promotes tumor progression by upregulating Cullin proteins and facilitating the degradation of tumor suppressor proteins such as p21 and p27. Our previous results demonstrated that HSP90 stabilizes ROC1 and HSP90 inhibition promotes ROC1 degradation. Therefore, we aimed to investigate whether HSP90 inhibition suppresses the proliferation of lung cancer cells through down-regulating ROC1 and its downstream signaling pathways both in vitro and in vivo. Firstly, the protein level of ROC1, HSP90, and HSP90β in human bronchial epithelial cell BEAS-2B, lung epithelial cell MRC-5, and lung cancer cells (A549, H1299, H358, and PC9) was examined. The results showed that the expression levels of all three proteins were significantly upregulated in lung cancer cells relative to normal lung epithelial cells (Supplementary Fig. 4a), suggesting that lung cancer cells may exhibit greater sensitivity to HSP90 inhibitors. Then, cell viability and cell-cycle assays demonstrated that HSP90 inhibition significantly inhibited the proliferation of lung cancer cells and induced cell-cycle arrest at G2 phase (Fig. 5a–d and Supplementary Fig. 4b, c), which was consistent with the effect of ROC1 knockdown.6,41 Subsequently, we further detected the expression of the Cullin family members and the substrates of CRLs upon STA-9090 treatment in LUAD cells. The results illustrated that inactivation of HSP90 greatly reduced the protein levels of ROC1 and ROC1-regulated Cullins (Cullin1, 2, 3, 4a, 4b). In contrast, STA-9090 exerted a negligible effect on Cullin5 protein expression, which is not regulated by ROC1 (Fig. 5e). Notably, HSP90 inactivation with both STA-9090 and 17-AAG induced p21 and p27 accumulation in the detected cells (Fig. 5f, g).
Fig. 5
HSP90 inhibition suppressed LUAD cell growth by reducing ROC1 expression. a, b A549 and H1299 cell lines were pre-treated with STA-9090 for 72 h, and then subjected to cell-proliferation analysis using ATPlite and CCK8 cell proliferation assays (n = 3). c, d A549 and H1299 cells were treated with STA-9090 at indicated doses to determine clonogenic survival (n = 3). e Western blot assays were performed to analyze the expression of ROC1, Cul1, Cul2, Cul3, Cul4A, Cul4B, Cul5, and p-H2AX upon STA-9090 treatment for 24 h with β-actin as a loading control. f, g Immunoblotting was performed to analyze the expression of p21 and p27 upon STA-9090 and 17-AAG treatment for 24 h. h–n 2.0 × 10⁶ A549 cells were subcutaneously injected into the flank of each mouse. The following day, the tumor-bearing mice were randomly divided into two groups and treated with vehicle control or STA-9090 (25 mg/kg) every 2 days. h Tumor size was determined by caliper measurement (n = 9). i Mice were sacrificed, and tumor tissues were harvested and photographed. j Tumor weights were obtained on the sacrifice day (n = 9). k Proteins extracted from tumor tissues were subjected to Western blot for ROC1, Cul1, Cul2, Cul3, Cul4A, Cul4B, Cul5, p21, p27, HSP90β, HSP90, and β-actin. l–n IHC staining of tumor tissues using specific antibodies for Cul1, ROC1, and Ki67 (n = 3). o, p Analysis of cell viability upon STA-9090 treatment (48 h) with or without ROC1 knockdown (n = 3). Data were represented as mean ± SD in (a, b, d, h, j, n, p). Statistical analysis was performed by one-way ANOVA for (a, b, d, p), and the two-tailed unpaired Student’s t-test for (h, j, n) (ns not significant; *P < 0.05; **P < 0.01; ****P < 0.0001)
Having established the suppressive effect of HSP90 inhibition on ROC1 and its downstream signaling in vitro, we proceeded to investigate the impact of HSP90 inactivation on ROC1 in vivo. As expected, STA-9090 administration significantly inhibited the growth of LUAD cells in vivo (Fig. 5h–j), with no obvious toxicity and side effects on mice (Supplementary Fig. 4d and Supplementary Fig. 5). Furthermore, we determined the regulatory effect of STA-9090 on the expression of ROC1 and Cullins in the xenografted tumors. Tumor tissue extraction and Western blot analysis showed that STA-9090 obviously reduced ROC1 and Cullin1-4b expression with minimal effect of Cullin5 (Fig. 5k), which were consistent with the in vitro results. Immunohistochemical staining (IHC) also demonstrated that STA-9090 administration significantly reduced ROC1 and Cullin1 expression and inhibited tumor growth in vivo (Fig. 5l–n).
Additionally, we investigated the involvement of HSP90 on lung cancer cell proliferation in the presence and absence of ROC1. It was shown that the inhibitory rate of STA-9090 on cell proliferation was significantly reduced upon silencing of ROC1 with shRNAs (Fig. 5o, p). Taken together, these findings demonstrate that HSP90 inactivation suppresses ROC1-mediated downstream oncogenic signaling pathways.
Correlation analysis of expression of HSP90β and ROC1 in human LUAD tissues
Having determined the positively regulatory effect of HSP90β on ROC1 expression both in vitro and in vivo in mice, we intended to determine the correlation of expression status of HSP90β and ROC1 in human LUAD tissues. The expression levels of HSP90β and ROC1 in lung adenocarcinomas vs adjacent tissues were first analyzed by immunoblotting. Obvious elevation of the two proteins was seen in the majority of tumor tissues compared with adjacent tissues (Fig. 6a–c and Supplementary Fig. 6a). Bioinformatics analysis of TCGA database revealed that the transcriptional level of HSP90AB1 in human LUAD was much higher than that in the adjacent normal tissue (Fig. 6d), which predicted poor overall survival in LUAD patients (Supplementary Fig. 6b).
Fig. 6
Expression of HSP90β and ROC1 and their correlation with survival in LUAD patients. a Immunoblotting analysis to determine the expression of HSP90β and ROC1 in lung adenocarcinoma tissues. Representative results of 8 of 16 pairs of tissues are shown. A adjacent normal tissues, T tumor tissues. b, c Quantitative grayscale values using ImageJ (n = 16). d Bioinformatics analysis of TCGA database revealed that the transcriptional level of HSP90AB1 in human lung adenocarcinoma. e Immunohistochemical staining of human lung adenocarcinoma tissue arrays using specific antibodies for HSP90β and ROC1. Scale bar for ×10 images, 500 μm; Scale bar for ×200 images, 25 μm; f, g Histological evaluation of HSP90β and ROC1 expression in lung adenocarcinoma tissues and paired adjacent normal tissues (n = 75 for tumor tissues, n = 69 for Adjacent normal tissues). h Kaplan–Meier survival curves for overall survival of lung adenocarcinoma patients stratified by HSP90β and ROC1 expression levels, respectively (P = 0.009 for HSP90β; P = 0.018 for ROC1, log-rank test). i, j Correlation analysis of HSP90β and ROC1 protein expression in lung adenocarcinoma. k–m LUAD organoids were treated with STA-9090 and subjected to immunoblotting and organoid viability analysis (n = 3). Data were represented as mean ± SD in (d, f, g, m). All statistical analyses were conducted with two-tailed paired Student’s t-test for (b, c), the two-tailed unpaired Student’s t-test for (d, f, g), and one-way ANOVA for (m) (****P < 0.0001)
Furthermore, we performed IHC staining of LUAD tissue arrays to determine the expression of HSP90β and ROC1 in the lung tumor tissues compared to the adjacent tissues. The results showed that both HSP90β and ROC1 were significantly overexpressed in the tumor tissues compared with adjacent normal tissues ( Fig. 6e–g). The detailed clinicopathological characteristics of LUAD patients are described in Supplementary Table 1. Further Kaplan–Meier analysis demonstrated that LUAD patients with high expression of HSP90β or ROC1 had a lower overall survival rate than those with low expression of these proteins (Fig. 6h). High expression of HSP90β or ROC1 was associated with poorer overall survival rate of LUAD patients. The expression of HSP90β and ROC1 in tumors was significantly correlated in LUAD (P = 0.015, Pearson correlation) (Fig. 6i, j). Therefore, it suggested a positive correlation between the expression of ROC1 and HSP90β in LUAD. These findings indicate that the overexpression of ROC1 likely depends on the overactivated status of HSP90β, subsequently resulting in poor prognosis of LUAD patients.
HSP90 inhibition reduces ROC1 expression in organoids of human lung adenocarcinoma
Given that HSP90 promotes the stability of ROC1 in LUAD cells and they are positively correlated with each other in human LUAD tissues, we further investigated the effect of blocking the binding of HSP90 and ROC1 on the growth of LUAD organoids. Immunoblotting assays demonstrated that inactivation HSP90 decreased the expression of ROC1 but accumulated p21, one of the classical tumor suppressive substrates of ROC1 (Fig. 6k). In addition, morphological observation and organoid viability assays indicated that inhibition of HSP90 significantly inhibited the growth of LUAD organoids (Fig. 6l, m). These findings demonstrate that targeting HSP90-ROC1 axis is an effective strategy of suppressing LUAD organoids.
