


Patient and public involvement
Patients and/or the public were not involved in the design, conduct, reporting, or dissemination of this research.
Patient consent for publication
Written informed consent was provided by all subjects before sampling.
Characteristics of the participants and sample collection
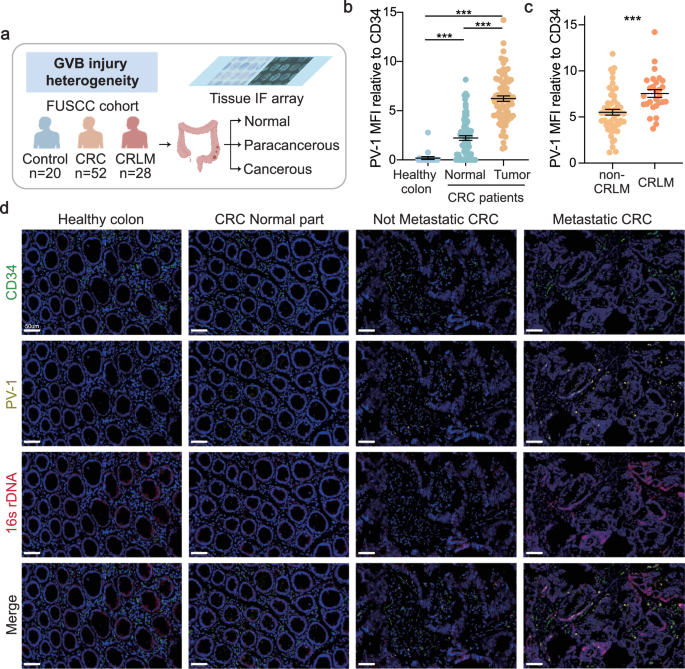
FFPE colonic tissue samples and paired fecal samples from patients with sporadic CRC and healthy controls were retrieved from the Fudan University Shanghai Cancer Center, Shanghai, China (FUSCC cohort). After inclusion and exclusion screening, a total of 100 eligible subjects were included in our study, including 20 healthy controls, 52 pre-operative CRC patients without distant metastases, and 28 pre-operative patients with CRLM. An independent cohort from FUSCC was enrolled, comprising 30 non-metastatic CRC patients, 20 CRLM patients, and 17 CRC patients with lung metastases. Fresh tumor tissues from an additional 10 CRC patients were collected during surgery (scRNA-seq cohort).
FFPE normal, para-cancerous, and cancerous tissues were used for IF staining. Fecal samples were collected preoperatively in sterile tubes and then stored at –80 °C prior to metagenomics screening. Fresh tumor tissue samples were obtained for scRNA-seq. None of the participants were treated with antibiotics or probiotics for one month before enrollment in this study.
Patients with sporadic CRC were excluded on the basis of the following criteria: a history of familial CRC, a history of inflammation-associated CRC, a history of irritable bowel syndrome, the presence of other coexisting malignant tumors, and a history of stool sampling not before colonoscopy or neoadjuvant therapy before stool sampling. The recruited CRC patients were divided into a CRC group (without distant metastases) and a CRLM group on the basis of the presence of liver metastases, as well as the PV-1 high group and PV-1 low group according to the median expression of PV-1 relative to that of CD34. For the healthy control group, volunteers who were confirmed with no gastrointestinal tumors after colonoscopy screening were recruited. The clinical pathological features of the CRC patients included age, sex, body mass index, TNM stage, tumor size, tumor differentiation, vascular invasion, neural invasion, survival, and tumor recurrence. The clinical information of the patients is provided in Supplementary Table S1.
Mouse models
Experimental protocols were approved by the Institutional Animal Care and Use Committee of Fudan University Shanghai Cancer Center, and mouse experiments were conducted in accordance with the National Institutes of Health Guidelines for the Care and Use of Laboratory Animals (No. FUSCC-IACUC-S2023-0002). C57BL/6J specific-pathogen-free (SPF) mice were purchased from Shanghai SLAC Laboratory Animal Co., Ltd. All the mice were housed in an SPF facility at Shanghai SLAC Laboratory Animal Co., Ltd., with ad libitum access to chow and water.
Protocol 1
Eight-week-old C57BL/6J male mice were randomized into two groups: the CRLM control group and the CRLM E. lenta group. After they had adapted for one week, the mice received an antibiotic cocktail (Abx) via the drinking water (0.2 g/L ampicillin, neomycin, and metronidazole, and 0.1 g/L vancomycin) for two weeks to deplete the gut microbiota. Afterward, 109 colony-forming units (per mouse) of live E. lenta resuspended in PBS or PBS was administered to the mice by gavage for 14 consecutive days. After gavage, DNA from the fecal samples (0.1 g per mouse) was extracted using a PowerFecal Pro DNA Kit (QIAamp). Total gene copies of DNA were subsequently assessed by qPCR for each fecal sample to determine the relative E. lenta abundance. At week 4 after gavage, some mice were sacrificed (eight animals/group) to harvest serum and colon tissue for analysis.
After the above gavage treatment was completed, another eight mice in each group were intraperitoneally injected with 10 mg/kg body weight azoxymethane (AOM; Sigma, USA). After 7 days, AOM-injected mice received dextran sulfate sodium (DSS) (1.5% w/v) in the drinking water for 7 successive days. After DSS treatment, the mice were allowed to recover for 14 days. This schedule was repeated for 3 cycles. During each recovery interval, the mice were given live E. lenta strains or PBS by gavage.
Protocol 2
Orthotopic CRLM models: We established germ-free nude mice with injections of LoVo cells into the mesenteric triangle of the cecum to simulate primary colon cancer. The mice were randomly assigned to four groups (n = 16/group): the E. coli DH5α control group; the group treated with the PERK inhibitor GSK2606414 (30 mg/kg); the E. lenta group; and the E. lenta + GSK2606414 co-treatment group. All interventions were delivered by gavage every 3 days for 30 consecutive days, followed by systematic collection of primary tumors, serum samples, and liver tissues.
Tumor vascular FITC-dextran permeability assay
FITC-dextran (50 mg/kg; 70 kDa; Sigma) was injected into the mice via the tail vein. Tumor tissue homogenates were collected 4 h later, and the concentration of FITC-dextran in tumor samples was determined by fluorescence intensity (CLARIOstar Plus Microplate Reader; BMG Labtech, Germany).
Culture conditions
E. lenta (ATCC, #25559), the typed strain of the species E. lenta, was obtained from American Type Culture Collection (ATCC, USA) and was cultured in tryptic soy broth (TSB, Corning, USA) medium following a previously described protocol23. The quantity of the bacterium was measured using serial dilution and plating on TSB agar plates. The purity of the bacterium was verified by qPCR with specific primers (F: 5′-ATACTAGGTGTGGGGGGCTCCG-3′ and R: 5′-TTTCCCCGGCTTCACGTCCATG-3′). E. coli strain DH5a (Invitrogen, CA, USA) was propagated aerobically in Luria–Bertani (BD Biosciences, Difco, MD, USA) medium at 37 °C.
pHIMECs were provided by BeiNa Culture Collection (BNCC379539; Beijing, China). The pHIMECs were cultured in endothelial cell medium (ScienCell, CA, USA), and the culture vessel was pre-coated with fibronectin (5 μg/cm2; Roche, Mannheim, Germany). The human CRC cell line HCT-116 was obtained from the ATCC. All the cell lines were verified by short tandem repeat analysis and cultured under appropriate conditions. The cells were also tested for mycoplasma using the MycoAlert Mycoplasma Detection Kit (Lonza, Belgium). All experiments were performed with cell lines cultivated for less than 12 passages after their procurement.
Endothelial permeability and trans-endothelial migration analysis
For the endothelial permeability analysis, pHIMECs (2 × 10⁴) were seeded on polyethylene terephthalate Transwell filters in a 24-well plate (0.4 μm pore size; BD Biosciences; USA) and allowed to reach confluence, followed by addition of PBS or E. lenta (MOI of 1:1000), and continued culturing for 24 h. FITC-dextran (Sigma, USA) was added to the top well to reach a final concentration of 10 mg/mL. The appearance of fluorescence in the bottom well, which represents the passage of FITC-dextran, was monitored by taking 40 μL medium aliquots over a time course to measure fluorescence using a SpectraMax microplate reader (SpectraMax M5, USA) at 520 nm.
For the trans-endothelial migration assay, pHIMECs were grown to form a monolayer in the upper well of a 24-well Transwell plate (8 μm pore size; BD Biosciences), and PBS or E. lenta (MOI of 1:1000) was added to the culture. After incubation for 24 h, HCT-116 cells (1 × 10⁴) were added, and the transmigrated HCT-116 cells in the bottom wells were fixed with methanol and stained with crystal violet after 24 h of incubation. Each experiment was repeated six times, and each time three wells were tested for each sample.
ATP viability assay
ATP viability assays were performed with a CellTiter-Glo® 2.0 assay for cell lines according to the manufacturer’s protocol (Promega, WI, USA). Cells were lysed with CellTiter-Glo® Reagent (100 µL) for 30 min. Luminescence signals were detected with a microplate reader (BioTek, VT, USA).
Annexin V/propidium iodide (PI) apoptosis assay
Cells were cultured in 6-well plates with PBS, DH5α, or E. lenta alone, in combination with si-NC or in combination with si-PERK for 24 h. The cells were stained with FITC-annexin V solution and PI solution before being examined using flow cytometry. The number of positive cells was determined by summing the number of cells that were Annexin V+/PI+, Annexin V+/PI−, and Annexin V–/PI+.
Metagenomic sequencing
Fecal DNA was extracted using the QIAamp DNA Stool Mini Kit (Qiagen, Hilden, Germany). DNA integrity, size, and concentration were determined by agarose gel electrophoresis and NanoDrop spectrophotometry (NanoDrop, Germany). After the sequencing libraries were constructed and quality controlled, high-throughput sequencing was performed using the NovaSeq 6000 platform (Illumina).
Raw sequencing reads were processed to obtain valid reads as previously described24. Quality-filtered reads were obtained and reassembled using IDBA-UD (V1.1.1). The clean reads were aligned to the database (V202003, (ftp://ftp.ccb.jhu.edu/pub/data/kraken2_dbs/)) using Kraken2 software (V2.1.1) to obtain species-level information for further analysis.
scRNA-seq
For scRNA-seq, fresh samples were harvested immediately and prepared into single-cell suspensions. Dead cells were removed to improve the viability of the samples. Cells were loaded onto the 10X Chromium Single-Cell Platform (10X Genomics) at a concentration of 1000 cells/μL (Single-Cell 3′ library and Gel Bead Kit v3). The generation of gel beads in emulsion (GEMs), barcoding, GEM-RT clean-up, complementary DNA amplification, and library construction were performed following the manufacturer’s protocol. The final library pool was sequenced on an Illumina NovaSeq 6000.
Bioinformatic alignment and generation of the data matrix
For droplet-based scRNA-seq, sequenced fastq files were aligned, filtered, and barcoded, and unique molecular identifiers (UMIs) were counted using CellRanger Chromium Single-Cell RNA-seq version 2.0.2 (10X Genomics) and a custom reference package for the human reference genome Ensembl93 (GRCh38). Finally, a filtered matrix was used to generate Seurat objects for each sample using the Seurat (v5.1.0) workflow. The Seurat objects were subsequently merged and used for downstream analysis.
Unbiased clustering and nomination
For cell type identification, lineage-specific markers were used to distinguish cells at the major cell type level. The expression of cluster-specific marker genes was determined by performing differential gene expression analysis between cells from the individual cluster and cells from all other clusters using FindAllMarkers in Seurat with the following parameters: min.pct: 0.1, logfc.threshold: 1.0, and only.pos: TRUE. Only genes with a significant adjusted P value (P < 0.05, FDR-adjusted P value) were retained to define major cell types, including epithelial cells, endothelial cells, T/NK cells, B cells, plasma cells, fibroblasts, neutrophils, myeloid cells, mast cells, tuft cells, and mucosal enteric glial cells. The expression of markers from each cell type, such as EPCAM, PECAM1, CD3D, MS4A1, and MZB1, in the corresponding clusters was further confirmed and visualized using Vlnplot in Seurat.
Differential gene expression and pathway enrichment analysis
The DEGs identified in the two subgroups were evaluated using FindMarker with the following parameters: min.pct: 0.1 and logfc.threshold: 0. Genes with abs(avg_log2FC) > 0.5 and P value < 0.05 were termed significantly up- or downregulated genes. To determine the functional annotation of the significantly expressed genes and predict potential signaling pathways, gene enrichment analysis was performed on the basis of an ontology gene set (C5) (previously GO gene sets) downloaded from the Molecular Signatures Database (MSigDB, v2022.1. Mm), a joint project of UC San Diego and Broad Institute25. Genes in the output list were annotated using ENTREZID or ENSEMBL based on “org.Hs.eg.db” (v3.19.1) and then ranked in descending order of their average expression. The well-arranged gene list was used as input for pathway enrichment analysis using the enrichGO function in clusterProfiler (v4.12.0). The significantly different relevant GO pathways (cutoff value: P = 0.05, abs(NES) = 1) were visualized using ggplot2 (v3.5.1).
Adhesion assays
All equipment, solutions, and plates used to cultivate anaerobic bacteria were pre-incubated in an anaerobic chamber one day prior to the adhesion experiment. E. coli DH5α and E. lenta strains that had been cultured for 48 h were resuspended in 1.5 mL of PBS-Ca/Mg. The 12-well Transwell plate with the pHIMEC monolayer was incubated with bacteria for 4 h under anaerobic conditions (80% N2, 10% CO2, and 10% H2). After incubation, the plate was washed twice with PBS-Ca/Mg, and the pHIMEC monolayer, which potentially had bacteria bound to the surface, was detached with 300 μL of a 0.1% trypsin solution for 5 min at 37 °C under anaerobic conditions. These wells were further washed two times with PBS-Ca/Mg followed by centrifugation at 7500× g for 5 min. The pellet was then resuspended in 1 mL of PBS Ca/Mg and serially diluted in PBS without Ca/Mg using a 10-fold dilution, which was followed by plating onto Wilkins–Chalgren agar with L-cysteine hydrochloride monohydrate and resazurin to enumerate the bacteria.
Immunofluorescence
IF analysis of FFPE colon tumor/healthy colon tissue sections was performed. Three-millimeter-thick sections were prepared from FFPE human CRC and healthy control tissue blocks, deparaffinized, rehydrated, and blocked with 0.1 M Tris-HCl, pH 7.4, 2% fetal bovine serum, and 0.3% Triton X-100. The sections were then stained with the following antibodies: anti-PV-1 (Abcam, #27853; #321889, 1 µg/mL), anti-CD34 (Abcam, #81289, 1:100), or anti-ZO-1 (Abcam, #307799, 1:500). The sections were incubated with primary antibodies at 4 °C. The sections were then incubated with the appropriate fluorophore-conjugated secondary antibody. Before imaging, the nuclei were counterstained with DAPI. One drop of 50% glycerin was added to each section, and laser confocal microscopy (Nikon, Japan) was used to detect PV-1, CD34, and ZO-1 expression. Fiji software package was used for image analysis and fluorescence quantification.
For IF staining, the pHIMECs were co-cultured with PBS or E. lenta (MOI of 1:1000) in complete medium for 24 h. Then, the cells were fixed with 4% paraformaldehyde in PBS supplemented with 0.2% Triton. The cells were then blocked for 1 h with 1% bovine serum albumin, followed by incubation with an anti-vinculin antibody (Abcam, #129002, 1:100) or an anti- ZO-1 antibody (Abcam, #307799, 1:500) overnight at 4 °C. The cells were subsequently washed and incubated with the appropriate secondary antibody (Abcam) and DAPI.
For immunohistochemical staining, mouse liver tissues were fixed in 4% paraformaldehyde, embedded in paraffin, cut into 3 µm-thick sections, and stained with H&E according to standard protocols.
FISH
FISH of colon tumors was performed on FFPE blocks. The tissue sections were subsequently washed in 0.1 M Tris-HCl, pH 7.4, for 15 min, after which the Gram-positive bacterial cell walls were hydrolyzed using lysozyme (10 mg/mL) for 30 min at 37 °C. The tissue sections were then hybridized with a 5ʹ Cy3-labeled EUB338 probe (5ʹ-GCTGCCTCCCGTAGGAGT-3ʹ)26 or an E. lenta probe (5ʹ-CCTTGCCGTCTGGGCTTT-3ʹ)27 in hybridization buffer containing 0.9 M NaCl, 0.02 M Tris-HCl, pH 7.4, and 0.01% SDS at 50 °C overnight. All probes were acquired from probeBase (http://www.microbialecology.net/probebase/) and synthesized by Sangon Biotech Company (Shanghai, China).
Western blot
Western blot assays of the cells were performed following a previously reported method28. The primary antibodies used in the present study included anti-BiP antibody (Cell Signaling Technology, #3177, 1:1000), anti-phospho-PERK antibody (Cell Signaling Technology, #3179, 1:1000), anti-PERK antibody (Cell Signaling Technology, #3192, 1:1000), anti-phospho-eIF2α antibody (Cell Signaling Technology, #3398, 1:1000), anti-eIF2α antibody (Cell Signaling Technology, #5324, 1:1000), anti-ATF-4 antibody (Cell Signaling Technology, #11815, 1:1000), anti-ZO-1 antibody (Cell Signaling Technology, #8193, 1:1000), anti-Claudin-5 antibody (Cell Signaling Technology, #49564, 1:1000), anti-SQSTM1/p62 antibody (Cell Signaling Technology, #88588, 1:1000), anti-LC3A/B antibody (Cell Signaling Technology, #88589, 1:1000), anti-Beclin-1 antibody (Cell Signaling Technology, #3495, 1:1000), anti-Toll-like Receptor 4 antibody (Cell Signaling Technology, #38519, 1:1000), anti-GAPDH antibody (Abcam, #8245, 1:500). The antigen–antibody complex on the membrane was detected with enhanced chemiluminescence reagents (Thermo Scientific, Waltham, USA).
qPCR
qPCR analyses of mouse colon tumor tissues were conducted following previously described protocols29. All the experiments were performed in triplicate, and β-actin was selected as the reference gene. Relative gene expression levels were calculated using the 2–ΔΔCT method. The sequences of the specific primers used are listed in Supplementary Table S10.
Electron microscopy
For transmission electron microscopy (TEM) analysis, the cells were collected and immediately fixed overnight in 3% glutaraldehyde. Afterward, the samples were rinsed three times with PBS and postfixed with 1% osmic acid for 2 h. After being rinsed three times with deionized water and serially dehydrated with 50%, 70%, 80%, 90%, and 100% alcohol and 100% acetone, the samples were embedded in epoxy resin to form blocks of cells. Ultrathin sections (50 nm) were obtained with an ultramicrotome (Ultracut UCT, Leica, Germany). The sections were then stained with lead citrate and uranyl acetate and examined by TEM (T10, FEI, USA).
For SEM analysis, after treatment with E. lenta, the cells were fixed with glutaraldehyde for 2 h at room temperature and stored at 4 °C. The samples were then rinsed three times with PB. Secondary fixation was performed using 1% osmium tetroxide in phosphate buffer (PB) for 1–2 h, followed by three additional PB washes. Dehydration was performed through an ethanol gradient (30%–100%), with critical point drying. The samples were sputter-coated with a gold layer and imaged under a scanning electron microscope (Hitachi, SU8100).
Statistical analysis
Differences in the quantitative data between two groups were performed using the unpaired two-tailed Student’s t-test or Mann–Whitney U test, where appropriate. Comparisons of means among multiple groups were determined by one-way ANOVA followed by Tukey’s post hoc comparison test. The relationships between the abundance of E. lenta and the MFI of PV-1 relative to CD34 were analyzed by using two-tailed nonparametric Spearman correlation and linear regression. The associations between the patient categorical characteristics were analyzed using Fisher’s exact test. Overall survival was defined as the time interval from surgery to the date of death or the last follow-up. The survival curves and early recurrence curves were constructed using Kaplan–Meier model, and log-rank tests were used to determine the statistical difference. P values < 0.05 were considered significantly different (*P < 0.05, **P < 0.01, ***P < 0.001). All statistical analyses were performed using GraphPad Prism 8 software (GraphPad lnc.) or IBM SPSS Statistics 20.0 software (IBM lnc., SPSS).
