


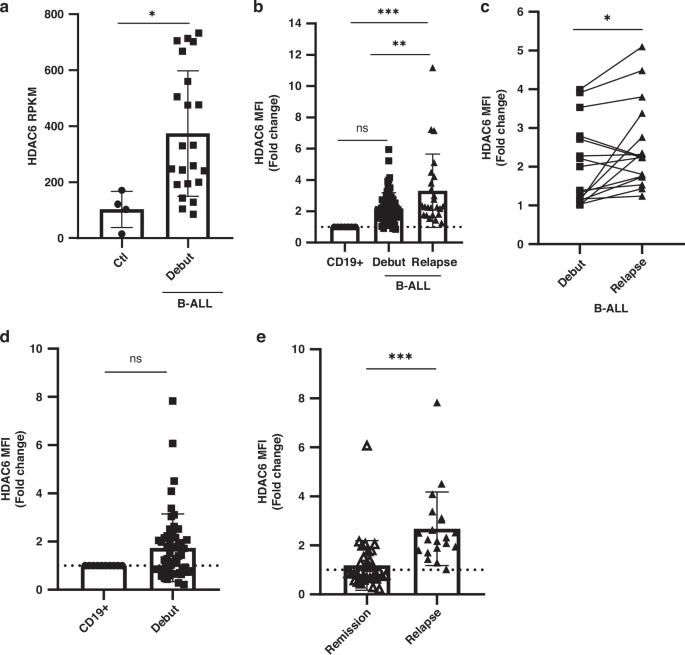
HDAC6 is overexpressed in patient-derived B-ALL cells and correlates with relapse
Because our primary objective was to define the clinical relevance of HDAC6 in paediatric B-ALL, we first analysed HDAC6 expression in patient cohorts. Analysis of RNA-seq data from 22 paediatric B-ALL patients (Supplementary Table 1) showed significantly higher HDAC6 expression compared with healthy controls (Fig. 1a). However, non-parametric Mann–Whitney U tests revealed no significant associations between HDAC6 expression and sex, risk group, hepatomegaly, splenomegaly, adenomegaly, or death (Supplementary Table 2). Pearson’s correlation analysis further showed that HDAC6 expression did not correlate with bone marrow (BM) blast percentage, leucocyte count, haemoglobin concentration, or platelet count (Supplementary Fig. 1).
Fig. 1: HDAC6 mRNA and protein levels are elevated in primary leukaemic B cells compared with normal B cells.
a HDAC6 expression (RPKM, reads per kilobase per million) determined by RNA-seq in paediatric B-ALL patients (n = 22) and controls (n = 4). Each dot represents one individual. Unpaired two-tailed Student’s t test. b Flow cytometric analysis of HDAC6 protein levels in paediatric B-ALL at diagnosis (debut; n = 64) and relapse (n = 24), normalised to healthy CD19⁺ B cells (set to 1, dotted line). One-way ANOVA. c HDAC6 protein levels in paired debut–relapse samples from paediatric B-ALL patients (n = 16), normalised to healthy CD19⁺ B cells (set to 1). Paired two-tailed Student’s t test. d HDAC6 protein levels in adult B-ALL at debut (n = 54), normalised to healthy CD19⁺ B cells (set to 1, dotted line). Unpaired two-tailed Student’s t test. e HDAC6 protein levels in adult B-ALL at debut stratified by clinical outcome (remission versus relapse), normalized to healthy CD19⁺ B cells (set to 1, dotted line). Mann–Whitney U test. Data in (b–e) are shown as fold change of mean fluorescence intensity (MFI); error bars indicate standard deviation. *p < 0.05; **p < 0.01; ***p < 0.001; ns not significant.
We next assessed HDAC6 protein expression by flow cytometry in bone marrow samples from an independent cohort of 72 paediatric B-ALL patients (Supplementary Table 3). In this cohort, HDAC6 protein levels tended to be higher in B-ALL blasts from newly diagnosed patients (debut) than in normal CD19⁺ B cells (Fig. 1b), reflecting the heterogeneity of HDAC6 expression at diagnosis. Notably, HDAC6 expression was significantly increased in samples from relapsed patients compared with both normal CD19⁺ B cells and cells at debut (Fig. 1b). Statistical analysis of the clinical data showed a significant association between high HDAC6 protein levels and relapse (Supplementary Table 4). In contrast, no associations were observed with sex, risk group, immunophenotype, steroid response, infections, neutropenia, thrombocytopenia, anaemia, hepatomegaly, adenomegaly, splenomegaly, or death (Supplementary Table 4). HDAC6 protein levels negatively correlated with bone marrow blast percentage but showed no correlation with blast percentage in peripheral blood (PB), lactate dehydrogenase (LDH), leucocyte counts, haemoglobin concentration, or platelet counts (Supplementary Fig. 2). Importantly, HDAC6 protein levels were significantly higher at relapse in 16 paired debut-relapse samples from paediatric B-ALL patients (Fig. 1c), indicating a more prominent role for HDAC6 during relapse.
Analysis of a cohort of 54 adult B-ALL patients (Supplementary Table 5) also showed a trend to higher HDAC6 levels at debut compared with healthy B cells, mirroring the trend observed in paediatric B-ALL (Fig. 1d), further demonstrating the biological heterogeneity at debut in both paediatric and adult patients. Importantly, adult patients who subsequently relapsed exhibited significantly higher HDAC6 levels at debut than those who remained in remission (Fig. 1e), supporting the potential of HDAC6 as biomarker for early determination of relapse risk in adult B-ALL. Together, these findings demonstrate that HDAC6 overexpression is strongly associated with relapse in both paediatric and adult B-ALL.
The B-ALL cell line REH exhibits elevated HDAC6 levels compared with normal B cells
To investigate the functional consequences of HDAC6 overexpression observed in patients, we used the B-ALL cell line REH. First, we analysed HDAC6 protein levels by flow cytometry in REH cells compared with healthy BM-derived CD19+ B cells and found that leukaemic cells contain significantly higher HDAC6 levels (Fig. 2a). Western blot analysis confirmed this finding and showed the expected molecular weight of HDAC6 at 160 kDa (Fig. 2b). Importantly, CD19+ B cells from healthy BM and CD19+ B cells from healthy PB express similar HDAC6 levels (Supplementary Fig. 3A), indicating that the observed differences were specific to leukaemic cells rather than tissue origin. This finding also validates the use of healthy PB-derived CD19+ B cells as controls, given the very limited availability of healthy BM samples.
Fig. 2: HDAC6 is overexpressed in REH cells and localises predominantly to the cytoplasm.
a Flow cytometric quantification of HDAC6 protein levels in REH cells normalized to healthy bone marrow (BM) CD19⁺ B cells (set to 1, dotted line). Unpaired two-tailed Student’s t test; n = 3. b Representative immunoblot and densitometric quantification of HDAC6 in CD19⁺ B cells and REH cells, showing the expected 160-kDa band. γ-Tubulin served as loading control. Unpaired two-tailed Student’s t test; n = 3. Error bars in (a, b) indicate standard deviation. **p < 0.01; ****p ≤ 0.0001. c 3D surface rendering of confocal z-stacks was performed using Imaris to visualise the spatial distribution of HDAC6 (green) and cortactin (red) in REH cells under basal and CXCL12 stimulation (100 ng/mL, 20 min). A masked colocalization channel (yellow) was generated from automatically thresholded surfaces to identify overlapping voxels. Representative images are shown; at least 20 REH cells were examined across three independent experiments. Under basal conditions, HDAC6 and cortactin exhibited partial spatial overlap. CXCL12 stimulation induced polarised morphology with lamellipodia-like protrusions and increased HDAC6–cortactin colocalization at the leading edge. Arrows indicate the leading and trailing edges.
Consistent HDAC6 overexpression was also observed in RS4:11, another B-ALL cell line, with no significant differences in HDAC6 levels between REH and RS4:11 cells (Supplementary Fig. 3B, C).
3D surface rendering of confocal z-stacks revealed that HDAC6 localised predominantly to the cytoplasm of REH cells (Fig. 2c), in agreement with previous reports [22]. Under basal conditions, cortactin showed partial colocalization with HDAC6, as visualised in the masked colocalization channel (Fig. 2c, upper panel). Upon CXCL12 stimulation, REH cells displayed polarised morphology with lamellipodia-like protrusions, with enrichment of both HDAC6 and cortactin at the leading edge (Fig. 2c, lower panel). These findings suggest that HDAC6 may contribute to cortactin-dependent cytoskeletal remodelling during leukaemic cell migration.
HDAC6 inhibition reduces leukaemic B-cell migration through F-actin polymerisation and CXCR4/VLA-4 expression
To assess the functional impact of HDAC6 inhibition in REH cells, we first established appropriate conditions for treatment with TubA, a selective HDAC6 inhibitor [23, 24]. We found that the IC50 value of TubA was 94 µM after 24 h (Supplementary Fig. 4A), and that treatment with 20 µM of TubA for 3 h did not induce apoptosis (Supplementary Fig. 4B). Inhibition of HDAC6 with 20 µM of TubA in REH cells increased acetylation levels of both cortactin and α-tubulin without changing HDAC6 levels (Supplementary Fig. 4C). Inhibitory effects were still visible after 24 h (Supplementary Fig. 4D). Cortactin and α-tubulin are important proteins regulating cell migration [25, 26] and have been reported as HDAC6 substrates in different cell lines [14, 27]. Our findings demonstrate that cortactin and tubulin are also HDAC6 targets in REH cells.
We next analysed the role of HDAC6 in REH cell migration. HDAC6 inhibition significantly reduced CXCL12-induced transmigration of REH cells across human umbilical vein endothelial cell (HUVEC) monolayers compared with DMSO-treated controls (Fig. 3a), indicating that HDAC6 activity is required for efficient transendothelial migration (TEM). Because TEM critically depends on F-actin dynamics, we assessed actin polymerisation following CXCL12 stimulation. Whereas control cells rapidly polymerised actin, TubA–treated REH cells exhibited significantly reduced F-actin formation (Fig. 3b).
Fig. 3: Pharmacologic inhibition of HDAC6 impairs leukaemic B-cell migration.
a Transendothelial migration of REH cells across HUVEC monolayers toward CXCL12 (100 ng/mL, 4 h) following treatment of only REH cells with TubA (TubA; 20 µM, 1 h) or DMSO. Unpaired two-tailed Student’s t test; n = 3. b Dynamics of F-actin polymerisation in REH cells pretreated with TubA or DMSO and stimulated with CXCL12 for the indicated times. Cells were immediately fixed and stained with phalloidin. Data are shown relative to time 0 (set to 1; dotted line). Two-way ANOVA; n = 3. c Transendothelial migration of wild-type (WT) and cortactin-depleted REH cells treated with TubA (20 µM, 3 h) or DMSO toward CXCL12 (100 ng/mL, 4 h). Migrated cells were counted using a Neubauer chamber. Two-way ANOVA; n = 4. d Colonisation of HS5-MSC spheroids by REH cells after 24 h co-culture. Control cells (DMSO) were CFDA-labelled and TubA-treated cells were CTV-labelled. Colonisation was quantified by flow cytometry. Paired two-tailed Student’s t test; n = 3. e Confocal imaging and quantification of REH cells (CFDA-labelled DMSO cells in green; CTV-labelled TubA-treated cells in blue) within HS5-MSC spheroids. Representative images are shown. Scale bar = 50 µm. Paired two-tailed Student’s t test; n = 3. f Surface CXCR4 expression in non-permeabilized REH cells after TubA treatment (20 µM, 3 h) and CXCL12 stimulation. Two-way ANOVA; n = 4. g Surface and total CXCR4 expression after 24 h treatment with TubA (10 µM). Two-way ANOVA; n = 3. h Surface CD29 and CD49d (VLA-4) expression after 3 h (20 µM) and 24 h (10 µM) of TubA treatment. Two-way ANOVA; n = 3. Data are shown as MFI ± standard deviation. *p < 0.05; **p < 0.01; ***p < 0.001; ****p ≤ 0.0001; ns not significant.
Cortactin stabilises actin filaments [28], regulates TEM [29] and is a main target of HDAC6 [27]. To determine whether HDAC6 promotes TEM through cortactin, we inhibited HDAC6 in stable cortactin-knockdown (KD) REH cells. As previously reported [12], vehicle-treated cortactin-KD cells displayed significantly reduced transmigration compared with wild-type (WT) REH cells (Fig. 3c). Notably, HDAC6 inhibition in cortactin-KD cells did not further reduce TEM compared with DMSO-treated cortactin-KD cells or TubA-treated WT cells (Fig. 3c). These findings indicate that HDAC6 promotes TEM predominantly via cortactin deacetylation, which enhances cortactin binding to F-actin [27] and stabilises newly polymerised actin filaments in response to CXCL12.
The BM microenvironment provides essential cues for leukaemic cell survival and dissemination. CXCL12, constitutively produced by BM mesenchymal stromal cells (MSCs), regulates homing and retention of circulating normal and leukaemic cells [7]. Three-dimensional MSC spheroids recapitulate key features of the leukaemic niche, including cell–cell interactions, extracellular matrix deposition and hypoxia [30,31,32]. To determine whether HDAC6 contributes to leukaemic cell homing to the BM niche, we performed competition assays using MSC spheroids formed by the HS5 cell line. Flow cytometric analysis revealed that TubA-treated REH cells colonised MSC spheroids significantly less efficiently than DMSO-treated controls (Fig. 3d). Confocal microscopy and Imaris-based quantification confirmed a significant reduction in the number of HDAC6-inhibited REH cells within BM spheroids (Fig. 3e), demonstrating that HDAC6 activity is required for efficient homing of B-ALL cells to the BM microenvironment.
Transendothelial migration and bone marrow homing of leukaemic B cells depend on coordinated signalling through chemokine receptors and integrins. We observed significantly reduced surface expression of CXCR4 in TubA-treated REH cells compared with DMSO-treated controls (Fig. 3f). In contrast, ligand-induced internalisation of CXCR4 in response to CXCL12 occurred at comparable rates in both treatment groups (Fig. 3f), indicating that HDAC6 inhibition does not impair receptor endocytosis.
After 24 h of treatment with 10 µM TubA, REH cell viability remained high (Supplementary Fig. 5A), and both surface and total CXCR4 protein levels were significantly decreased (Fig. 3g), suggesting that HDAC6 activity contributes to maintenance of CXCR4 expression. Prolonged HDAC6 inhibition with 10 µM TubA also significantly reduced surface expression of CD49d and CD29 (Fig. 3h), the α4 and β1 subunits of the integrin very late antigen-4 (VLA-4), which is critical for B-cell adhesion and BM retention. This reduction was not detectable after short-term (3 h) treatment with 20 µM TubA (Fig. 3h), indicating a time-dependent effect consistent with altered receptor trafficking and/or protein stability rather than acute internalisation.
Collectively, these data show that HDAC6 drives leukaemic B cell migration by stabilising F-actin and regulating CXCR4 and VLA-4 expression to support the migratory and homing capacity of B-ALL cells.
Primary B-ALL cells require HDAC6 activity for migration and bone marrow colonisation
We next validated these findings obtained in REH cells using patient-derived B-ALL cells. HDAC6 inhibition significantly reduced CXCL12-induced transmigration of primary B-ALL cells across HUVEC monolayers (Fig. 4a). Consistently, TubA-treated primary B-ALL cells exhibited impaired colonisation of BM-MSC spheroids compared with vehicle-treated cells, as determined by flow cytometry (Fig. 4b) and confocal microscopy (Fig. 4c). Together, these results support that HDAC6 activity is required for efficient migration and BM homing of patient-derived leukaemic B cells.
Fig. 4: HDAC6 inhibition reduces the migratory capacity of primary B-ALL cells.
a Transendothelial migration of paediatric patient–derived B-ALL cells across HUVEC monolayers toward CXCL12 (100 ng/mL, 4 h) after TubA treatment (20 µM, 3 h) or DMSO. Unpaired two-tailed Student’s t test; n = 4. b Colonisation of HS5-MSC spheroids by paediatric B-ALL cells after 24 h co-culture. Control cells were labelled with CFDA and TubA-treated cells with CTV. Paired two-tailed Student’s t test; n = 5. c Confocal imaging and quantification of paediatric B-ALL cells (CFDA-labelled DMSO cells in green; CTV-labelled TubA-treated cells in blue) within HS5-MSC spheroids. Representative images are shown. Scale bar = 50 µm. Paired two-tailed Student’s t test; n = 3. Error bars indicate standard deviation. *p < 0.05.
The bone marrow microenvironment enhances HDAC6 expression
Because leukaemic blasts in the bone marrow are exposed to niche-derived cues that regulate migration and retention, we next analysed HDAC6 levels in paired BM-PB paediatric samples to determine whether HDAC6 upregulation is preferentially induced within the BM microenvironment. In 9 of the 12 patients analysed from the Hospital Infantil de Mexico ‘Federico Gómez’ (Mexico City) (Supplementary Table 1), HDAC6 levels were higher in BM-derived blasts than in matched PB-derived blasts (Fig. 5a), suggesting that HDAC6 upregulation occurs within the BM microenvironment and may contribute to leukaemic cell egress into the circulation. Consistently, blasts from relapsed patients exhibited higher HDAC6 levels in both BM and PB compared with those from patients at debut (Fig. 5b), further supporting a link between high HDAC6 expression and disease aggressiveness.
Fig. 5: The leukaemic bone marrow microenvironment induces HDAC6 upregulation.
a HDAC6 protein levels in paired bone marrow (BM) and peripheral blood (PB) blasts from newly diagnosed (debut, n = 9) and relapsed (n = 3) paediatric B-ALL patients. Each patient contributed matched BM and PB samples (n = 12 paired samples). Paired two-tailed Student’s t test. b Comparison of HDAC6 levels in BM- and PB-derived blasts from newly diagnosed (debut) and relapsed patients. Unpaired two-tailed Student’s t test. c Chemotaxis of patient-derived BM blasts toward CXCL12 (100 ng/mL, 4 h). One-way ANOVA. d Chemotaxis of paired BM and PB blasts toward CXCL12. One-way ANOVA. e HDAC6 levels in adhered and non-adhered patient-derived blasts following co-culture with HS5-MSC monolayers for 24 h, shown as fold change relative to cells cultured alone (set to 1, dotted line,). One-way ANOVA; n = 2 independent experiments. f HDAC6 levels in patient-derived blasts colonising HS5-MSC spheroids (‘in’) versus non-colonising cells (‘out’). Paired two-tailed Student’s t test; n = 3. HDAC6 levels in REH cells following co-culture with HS5-MSC monolayers (g) or HS5-MSC spheroids (h). One-way ANOVA (g); paired two-tailed Student’s t test (h); n = 3. i HDAC6 expression in REH cells cultured on VCAM-1–Fc (500 ng/mL) or stimulated with CXCL12 (100 ng/mL) or Activin-A (50 ng/mL) for 24 h. One-way ANOVA; n = 3. Error bars indicate standard deviation. *p < 0.05; **p < 0.01; ***p < 0.001; ****p ≤ 0.0001; ns not significant.
To determine whether HDAC6 expression correlates with migratory behaviour, we next examined CXCL12-induced migration in patient samples with different HDAC6 levels. BM-derived blasts from a patient at debut with the highest HDAC6 levels (P33) exhibited greater CXCL12-induced migration than blasts from patients with lower HDAC6 expression (P30, P32) (Fig. 5c). Analysis of paired BM and PB samples from three additional patients further confirmed that higher migratory capacity correlated with higher HDAC6 levels in BM blasts (e.g. P36 BM; Fig. 5d), consistent with a functional role for HDAC6 in promoting leukaemic cell migration.
To directly assess whether the BM niche promotes HDAC6 expression, primary B-ALL cells were co-cultured for 24 h with the BM-MSC HS5. Adhesion to HS5 MSCs resulted in a significant increase in HDAC6 levels, whereas non-adherent cells did not exhibit such changes (Fig. 5e), indicating that direct contact is a dominant driver of HDAC6 upregulation in patient-derived blasts. Consistently, patient-derived B-ALL cells that successfully colonised BM-MSC spheroids tended to express higher HDAC6 levels than non-colonising cells (Fig. 5f). Due to limited availability of patient-derived blasts, these experiments could not be repeated extensively to reach statistical significance.
REH cells showed a similar pattern. REH cells adherent to HS5 exhibited significantly increased HDAC6 levels compared with REH cells cultured alone and non-adherent REH cells recovered from the supernatant of the co-culture (Fig. 5g), supporting that direct cell–cell contact with MSCs is a dominant driver of HDAC6 upregulation. REH cells that successfully colonized BM-MSC spheroids expressed higher HDAC6 levels than non-colonising cells (Fig. 5h).
Because MSCs express CXCL12 and VCAM-1, key mediators of leukaemic cell adhesion, retention and mobilisation within the BM niche, we evaluated whether these factors contribute to HDAC6 induction. CXCL12 stimulation and adhesion to VCAM-1 each modestly increased HDAC6 levels in REH cells (Fig. 5i). Activin-A, a TGF-β family member produced by MSCs and recently implicated in promoting B-ALL migration [33], also induced a modest increase in HDAC6 expression (Fig. 5i). However, none of these individual stimuli recapitulated the robust HDAC6 upregulation observed in 2D and 3D MSC co-culture systems, indicating that MSC-mediated induction of HDAC6 likely requires a complex combination of signals.
HDAC6 depletion in B-ALL cells impairs leukaemic cell migration and BM colonisation
To further validate the role of HDAC6 in leukaemic cell migration, we generated HDAC6-depleted REH cells using shRNA (Fig. 6a). Among the constructs tested, HDAC6 KD-D achieved the most robust knockdown (~70%) and induced an increase in acetyl-tubulin levels, confirming functional inhibition of HDAC6 activity. Therefore, these cells were used for all subsequent functional experiments. Genetic depletion of HDAC6 significantly reduced CXCL12-induced transmigration of REH cells across HUVEC monolayers compared with scrambled control cells (Fig. 6b). Importantly, pharmacological inhibition of HDAC6 with TubA did not further decrease transmigration in HDAC6-depleted cells relative to DMSO-treated HDAC6-knockdown cells or TubA–treated scramble controls, indicating that HDAC6 activity is required for efficient transendothelial migration in REH cells and that the TubA-mediated effect occurs through HDAC6 (Fig. 6b). Consistent with these findings, HDAC6-depleted REH cells also exhibited significantly impaired colonisation of BM MSC spheroids compared with control cells (Fig. 6c). Together, these data show that TubA phenocopies the effects of genetic HDAC6 depletion, supporting target specificity and a critical role for HDAC6 in leukaemic cell migration and homing to the BM.
Fig. 6: Genetic depletion of HDAC6 impairs leukaemic B-cell migration.
a Representative immunoblot and densitometric quantification of HDAC6 in REH cells transduced with three independent HDAC6-targeting shRNAs (A, C, D) or scramble control (Scr). Acetylated tubulin and γ-tubulin served as functional and loading controls, respectively; n = 3. b Transendothelial migration of Scr and HDAC6-depleted REH cells treated with TubA (20 µM, 3 h) or DMSO toward CXCL12 (100 ng/mL, 4 h). Two-way ANOVA; n = 4. c Confocal imaging and quantification of HDAC6-depleted REH cells colonising HS5-MSC spheroids after TubA or DMSO treatment. Representative images are shown. Scale bar = 50 µm. Two-way ANOVA; n = 3. Error bars indicate standard deviation. *p < 0.05; **p < 0.01; ns not significant.
TubA treatment in xenotransplanted mice limits organ invasion by leukaemic B cells
To assess the in vivo relevance of pharmacological HDAC6 inhibition, we employed a xenograft model of B-ALL by transplanting human REH cells into NSG mice and treating animals with either TubA or vehicle (Fig. 7a). TubA administration was initiated at the time of leukaemic cell injection to assess early homing and initial organ colonisation, processes that occur within the first hours to days after intravenous delivery. During the first 3 weeks of the experimental period, overt signs of disease or weight loss were not observed by the veterinarians. Disease was established in all vehicle-treated mice by day 27, evidenced by reduced activity and hind-limb paralysis as observed by veterinarians. In contrast, none of the TubA-treated mice exhibited overt signs of disease at this time point.
Fig. 7: TubA treatment reduces leukaemic cell infiltration in vivo.
a Representative schematic of the in vivo xenograft experiment. NSG mice were injected intravenously with 3 × 10⁶ REH cells and treated with TubA (50 mg/kg; n = 5) or DMSO (n = 6) every other day for 27 days. At the end of treatment, peripheral blood, bone marrow, brain, liver, spleen, lung and testis were collected for analysis. Human leukaemic burden was quantified by flow cytometry using hCD45⁺ and mCD45⁺ gating strategies based on forward (FSC) and side (SSC) scatter parameters. Quantification of human leukaemic infiltration (hCD45⁺ cells) in bone marrow (b), brain (c), liver (d), spleen (e), lung (f), testis (g) and peripheral blood (h). Data represent the percentage of infiltrating hCD45⁺ cells among live cells. Error bars indicate SEM. Unpaired two-tailed Student’s t test. *p < 0.05; **p < 0.01; ****p ≤ 0.0001; ns not significant.
TubA treatment markedly impaired homing of REH cells to the bone marrow (BM) (Fig. 7b) and significantly reduced leukaemic infiltration of the brain (Fig. 7c) and liver (Fig. 7d). A trend toward reduced leukaemic burden was also observed in the spleen (Fig. 7e) and lungs (Fig. 7f). In contrast, no differences were detected in testicular infiltration (Fig. 7g), suggesting that leukaemic colonisation of this sanctuary site may occur independently of HDAC6 activity. Circulating REH cells in peripheral blood were modestly reduced in TubA-treated mice (Fig. 7h). Representative flow cytometry gating of murine (mCD45⁺) and human (hCD45⁺) leukaemic populations is shown in Supplementary Fig. 6A.
In a separate experiment, TubA administration was initiated after leukaemic cells were already established in the BM, a consistent trend toward reduced leukaemic infiltration across multiple organs was observed compared with vehicle-treated controls (Supplementary Fig. 6B). Moreover, TubA treatment was associated with a trend toward improved survival (Supplementary Fig. 6C), although inter-animal variability limited statistical power and precluded definitive conclusions.
Collectively, these in vivo data corroborate a critical role for HDAC6 in promoting the migratory and invasive behaviour of B-ALL cells and support HDAC6 as a potential therapeutic target to limit organ infiltration in B-ALL.
