


Ethics approvals for tissue samples
All human female TNBC tissue was obtained from the Barts Cancer Institute Breast Biobank (REC 21/EE/0072). Each patient gave written informed consent. The work was conducted in accordance with the Declaration of Helsinki and International Ethical Guidelines for Biomedical Research Involving Human Subjects (CIOMS). All ethics used for this study were approved by the East of England – Cambridge Central Research Ethics Committee. Patient information is detailed in Supplementary Data 6.
Isolation of monocytes from peripheral blood samples
Peripheral blood mononuclear cells were isolated from leukocyte cones derived from healthy donors by centrifuging with Ficoll-Paque PLUS (GE Healthcare, 17-1440-03 AG) at 1400 × g for 20 min with no deceleration. CD14+ monocytes were isolated using CD14 microbeads (Miltenyi, 130-050-201) in LS columns (Miltenyi, 130-042-401) and a QuadroMACS Separator (Miltenyi MACS, 13308).
Cell culture
The human TNBC BT20, HCC38, and MDA-MB-468 cell lines were cultured in Minimum Essential Medium Eagle (MEM, Lonza), Roswell Park Memorial Institute 1640 medium (RPMI, Gibco), and Dulbecco’s Modified Eagle Medium (DMEM, Gibo), respectively. All the media were supplemented with 10% fetal bovine serum (FBS, Gibco), 1% L-glutamine (Gibco) and 1% penicillin/streptomycin (Gibco) and cells were maintained at 37 °C in a humidified 5% CO2 incubator and routinely tested for mycoplasma contamination (Lonza). All cell lines were authenticated by short tandem repeat profiling using the authentication service of the American Type Culture Collection (FTA Sample Collection kits).
NKG2D-targeting CAR-Ts
Patient matched untransduced T cells and NKG2D (Natural Killer Group 2D) ligand-targeted parallel CAR-T (LEU-011) or MUC-1 ligand-targeting CAR-T were kindly provided by Dr Maher and Dr Davies (Leucid Bio).
In vitro cytolytic activity, cytokine release, and activation of CAR-T cells
Tumor cells were seeded in triplicate in a 24-well plate (Day 1). After 24 h (Day 2), 1 × 10⁵ CAR-T or control untransduced T cells were added to the target TNBC cells. The supernatant was then harvested 24 h later (Day 3) for enzyme-linked immunosorbent assay (ELISA) measurement of IL-2 (Cat: 88-7025-88, Invitrogen) and IFN-γ (Cat: DY285B-05, Bio-techne) following manufacturer’s protocols. At Day 5, the CAR-T supernatants were harvested, and the target cells were washed with PBS and incubated in 500 μl per well of Thiazolyl Blue Tetrazolium Bromide (MTT, Apollo Scientific BID2165) at 5 mg/ml in PBS diluted in 1:10 in cell media for 1 h in the dark at 37 °C to analyze cytotoxicity. After incubation, the MTT solution was aspirated, and cells were incubated for 5 min in 500 μl/well DMSO to solubilize the formazan crystals. Absorbance was read on a plate reader at 570 nm. CAR-T supernatants were washed and stained then flow cytometry was performed for an activation marker: anti-human CD233 (LAG-3) (BV421, 1:100, Cat: 303415, Biolegend) and Zombie NIR (1:1000, Cat: 423106, Biolegend), to confirm CAR-T activation. Samples were acquired on LSRFortessa (Becton Dickinson) and analysed using FlowJo v10.8.1 (BD FlowJo LLC).
Tissue transcriptomics
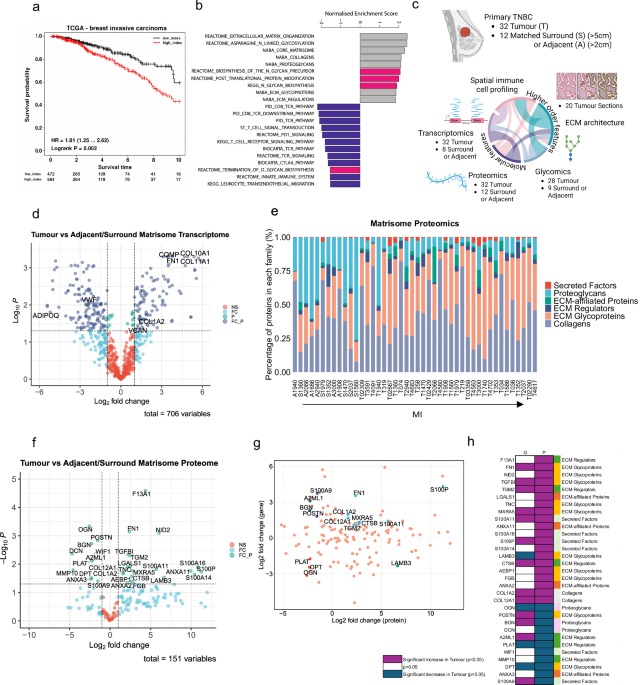
Tissue samples were trimmed at 100 µm thickness, and 50 mg for RNA extraction. RNA was extracted with the RNeasy mini kit (Qiagen, USA), and the concentration was measured by NanoDrop ND1000 UV-Vis spectrophotometer (Thermofisher, USA). The RNA Integrity was evaluated by 4200 TapeStation (Agilent) before RNAseq.
RNA quality control, mRNA library preparation (with RNA-Seq Ribodepletion), RNASeq and data quality control were performed by Oxford Genomics Centre, UK and Dr. Eleni Maniati, Barts Cancer Institute.
xCell
Log2 base RNA-seq data was delogged and processed to fit the input requirements of each computational method. xCell analysis was performed using the N = 64 gene signature and the RNA-seq box ticked.
Tissue proteomics
Decellularized human breast cancer samples were prepped using our in house whole matrisome proteomics method, optimized to assess whole tissue ECM. Tissues were solubilised in 200 µL 8 M urea buffer, 20 mM HEPES (pH 8) supplemented with protease inhibitors (100 mM Na3VO4, 0.5 M NaF, 1 M β-glycerol phosphate and 0.25 M Na2H2P2O7). Samples were sonicated 5 times for 30 s (on/off), then centrifuged at 17,000 × g for 10 min at 4 °C, supernatant transferred into a lo-bind Eppendorf. BCA assay measured protein concentrations by absorbance at 595 nm. Denaturation of protein used 10 µL 500 mM dithiothreitol (DTT) for 1 h in darkness at RT, followed by 20 µl 415 mM iodoacetamide (IAM), for 1 h in darkness at RT. Samples were diluted 1 in 4 with 20 mM 4-(2-hydroxyethyl)-1-piperazineethanesulfonic acid (HEPES), 1500 Units N-glycosidase F (PNGaseF) and incubated at 37 °C for 2 h, followed by 2 µl of 0.8 µg/µl LysC (Endoproteinase) incubated at 37 °C for 2 h. Trypsin beads conditioned with 20 mM HEPES buffer were added to each sample (80 µL) and incubated at 37 °C for 16 h. Samples were centrifuged at 2000 g for 5 min at 4 °C, supernatant transferred to lo-bind Eppendorf. De-salting used C-18 microspin columns (Glygen). Columns were washed with 100% acetonitrile (ACN; LGC), then 99% dH2O (+ 1% ACN, 0.1% Trifluoroacetic acid (TFA)), prior to passing the samples through the columns. Columns were washed with 99% distilled water (dH2O) and transferred into new 1.5 mL lo-bind Eppendorf. Protein samples were eluted in 300 µL 70/30 ACN/H2O + 0.1% formic acid (FA) and lyophilized using a speed-vac, before reconstitution in 0.1% TFA to 0.5 µg/µL and loaded into a Q-Exactive plus mass spectrometer connected to a Ultimate 3000 liquid chromatography (Thermo Scientific).
Tissue glycomics
Before isolation and purification of glycans from membrane and ECM proteins, we firstly isolated different compartmental proteins from patients tissue: Cytoplasmic, Nuclear, Membrane, Cytoskeleton and ECM Proteins, using CNMCS Compartmental Protein Extraction Kit (Cat no: C6012-25, US Biological) previously described (PMID: 26273955; PMID: 22159717) and also shown in Supplementary Fig. 1, which can enrich ECM proteins from tissues, digest into peptides for Mass Spectrometry Analysis (PMID: 22159717; PMID: 29196464), and avoid glycans mixtures among different protein fractions.
The ECM protein samples were reduced by dithiothreitol (DTT, 10 mg/5 mL) solution in degassed 0.6 M Tris pH 8.5 and incubated at 37 °C for 1 h, and carboxymethylated by iodoacetic acid (IAA, 60 mg/5 mL) in 0.6 M degassed Tris pH 8.5 and incubation of the sample at RT in the dark for 90 min. The homogenate was transferred to a dialysis cassette, and dialyzed for 24 h at 4 °C with continuous stirring. Then the samples were digested by trypsin (1 μg/μL, pH 8.4) and incubated at 37 °C for 14–16 h and the proteolytic digestion was terminated by dispensing 1 drop of acetic acid with a Pasteur pipette. Digested products were purified by reversed-phase chromatography (Classic C18 cartridge, Waters) against propan-1-ol/5% (v/v) acetic acid. N-glycans were released by PNGaseF (Roche) following a 24 h incubation at 37 °C, and were permethylated by sodium hydroxide and methyl iodide in dimethyl sulfoxide. The permethylated glycans were cleaned by Sep-Pak C18 cartridge and freeze dried before mass spectrometry analysis. O-glycans were released by the addition of four hundred microliters of 0.1 M potassium hydroxide containing potassium borohydride (54 mg/ mL) to dried glycopeptide samples and incubated at 45 °C for 14–16 h. The reaction was terminated by adding a few drops of 5% (v/v) acetic acid followed by purification with Dowex 1-X8 desalting column. Excess borates in the samples were subsequently removed by co-evaporating with 10% (v/v) acetic acid in methanol under a stream of nitrogen at room temperature. The purified native O-glycans were then permethylated following the NaOH procedure. Glycan profiling was done on AB Sciex 4800 MALDI-TOF/TOF mass spectrometer. The methylated glycans were dissolved in 10 ul methanol. 1 μL of sample was mixed with 1 μl of 10 mg/ml DABP matrix in 75% ACN. The mixture was spotted on a MALDI plate for MALDI-TOF-MS and MS/MS analysis. N- and O-glycan assignments are based on molecular ion composition information, tandem MS/MS and knowledge of biosynthetic pathways.
Immunohistochemistry (IHC)
panCK and CD8 dual staining
Human TNBC formalin-fixed paraffin-embedded (FFPE) tissue sections were obtained from the BCN tissue bank. Slides were deparaffinized with xylene and rehydrated through a descending ethanol series. Antigen retrieval was performed using a citrate-based unmasking buffer (pH 6, H-3300, Vector). Endogenous peroxidases were blocked with 3% hydrogen peroxide in methanol for 30 min and 2.5% goat serum was used to block tissues for horseradish peroxidase (HRP) staining. Antibodies were diluted in blocking solution and incubated for 1 h at room temperature or 4 °C overnight. HRP stains were detected using Impress-HRP anti-rabbit (MP-7451, Vector). Conditions for each antibody are shown in Supplementary Table 1. 3,3′-Diaminobenzidine reagent (DAB, K3468, DAKO) and Vector VIP (SK-4600, Vector Laboratories) was used to detect dual stains. Hematoxylin counterstain was completed followed by dehydration with an ascending ethanol series and clearing in Xylene. Slides were mounted and scanned using a Pannoramic scanner (3D Histech).
ConA and SNA dual staining
Concanavalin A conjugated to AF488 (ConA-AF488) specific for to α-D-mannosyl and α-D-glucosyl residues (C11252, ThermoFisher) and elderberry lectin from Sambucus nigra (SNA, EBL, CY3), which binds preferentially to sialic acid attached to terminal galactose in α-2,6 and to a lesser degree, α-2,3 linkage (CL-1303-1, Vector Laboratories), were used for the lectin stains of tissue. Samples were blocked in 5% BSA PBS for 1 h then washed and treated with 400 μg/mL ConA-AF488 or 20 μg/mL SNA-FITC for 1 h at room temperature before a further wash and visualization. Tissues were stained with DAPI (1:10,000, Cat: 40043, Biotium). Slides were mounted with anti-fade mounting media (H-1000, Vector Laboratories) and scanned with Nanozoomer S60 (Hamamatsu, Japan).
Immunohistochemistry spatial analysis
QuPath 0.5.144 was used for image analysis of the TNBC tissues. panCK staining was used to threshold for tumor cells and then used as a mask and annotation for tumor area. Expansion of the tumor annotation was used to create a mask and annotation for stroma area surrounding tumor nests. CD8 staining was used to threshold for T cell detection using StarDist segmentation and then we analysed T cells within tumor and stroma annotations45.
TNBC tissue decellularization
TNBC tissues were decellularized according to Puttock et al.18. In brief, tissue samples were frozen at −80 °C and sliced into small sections using a Vibratome. Sections were then washed under agitation with a hypertonic buffer solution (Tris 10 mM, EDTA 5 mM, PMSF 0.1 mM, H2O) for 4 h at room temperature (RT), 100% acetone overnight at 4 °C, washed twice with PBS + 1% pen/strep, then 4% or 2.5% sodium deoxycholate was added to the tumor or surrounding/adjacent tissues respectively, for 4 h at RT, the tissue washed as before, next benzonase solution (Tris 50 mM, MgCl2 1 mM, BSA 0.1% (w/v), benzonase 40units/ml, H2O) for 20 h at 37 °C. The samples were then washed as before and clean PBS + 1% pen/strep added, and the samples were then left in agitation at 4 °C for 48 h with a change in PBS + pen/strep. Decellularised tissue was then stored at −80 °C.
Nucleic acid
Nucleic acid was extracted from the decellularised samples using the DNeasy blood and tissue kit (Qiagen) according to the manufacturer’s instructions and quantified using a NanoDrop 2000 (ThermoFisher).
SEM
Tissue samples were fixed for 3 h with 2.5% glutaraldehyde in water at room temperature. The hydrogels were gradually dehydrated with increasing concentrations of ethanol (20, 50, 70, 80, 90, 96, and 100%, v/v), twice per solution for 10 min. Dehydrated samples were then subjected to critical point drying (K850, Quorum Technologies, UK). SEM micrographs of the tissue were acquired on Inspect F50 (FEI Comp, the Netherlands) after sputter-coating with gold.
Tissue stiffness
Tissue stiffness was measured by Instron 3342 with a 10 N load cell. The samples were applied an initial tare load of 0.1 N, and subjected to a 20% uniaxial unconfined compressive strain at a strain rate of 20%/min. This was followed by a stress relaxation period in which the load was recorded for a further 300 s. Stress–strain and stress–time curves were generated for each specimen and the mechanical properties of the samples determined according to the following equations where, σ1 and σ2 are the stress at 18% and 20% strain during the loading phase.
Histochemistry
Tissue samples were cut with a scalpel and a sample from each was preserved in formalin overnight at 4 °C. The samples were then paraffin embedded and sliced using a microtome. Haematoxylin and eosin (H&E), and Masson’s trichrome staining was then performed using standard protocols.
Collagen alignment analysis
Masson’s trichrome stain was performed and collagen ECM patterns were analyzed using The Workflow Of Matrix BioLogy Informatics (TWOMBLI) as described before46.
Immunohistochemistry
Paraffin embedded tissue slides were heated at 60 °C to remove paraffin and then rehydrated. Slides were then placed into an unmasking buffer (Vector) and incubated in a pressure cooker for antigen retrieval, except for fibronectin staining. Hyaluronic acid and chondroitin sulphate stains were then enzyme treated for 2 h at 37 °C. All slides were then treated with an endogenous peroxidase solution (H2O2 2% (v/v) in methanol). Tissue samples on the slides were circled with a PAP pen (DAKO). Blocking buffer (2.5% BSA (w/v), 2.5% goat serum (v/v) in 1X PBS) was then added and the primary antibody solution was then added to the slides with blocking buffer; fibronectin (FN1) (1:500, Abcam: ab23750), versican (VCAN) (1:200, ATLAS: HPA004726), collagen 1A1 (COL1A1) (1:300, ATLAS: HPA011795), chondroitin sulphate (CS) (1:600, Abcam: ab11570), cathepsin B (CTSB (1:400, Abcam: ab58802), cartilage oligomeric matrix protein (COMP) (1:80, Abcam: ab11056), and incubated overnight at 4 °C. The secondary antibody and blocking buffer (1:200) was then added. ABC kit vectastain (Vector labs) was added and washed and then DAB reagent (DAKO) was added and allowed to develop. Slides were then counterstained with 50% Gills haematoxylin and dehydrated. Hyaluronic acid (HA) staining followed the same steps as above until the primary, which was added and then incubated for 1 h at RT instead, (1:100, Merck: 385911). These stains were then washed and did not require a secondary antibody, so the slides had ABC vectastain added and followed the same steps as above from then onwards. Slides were then imaged using a Pannoramic 250 slide scanner (3DHistech) and quantified using Definiens™ software.
Staining score
Stain data including the intensity marker stain area (IMSA) was collected from Definiens, and was analysed using the following equation in order to produce the staining score for that image.
$$({{\mathrm{highIMSA}}}\times 3)+({{\mathrm{mediumIMSA}}}\times 2)+({{\mathrm{lowIMSA}}})({{\mathrm{totaltissuearea}}}\times 3)100$$
Decellularized tissue cancer cell culture
Breast adjacent/surround and tumor tissue was sliced using a scalpel into pieces roughly 5 mm in diameter and then decellularized as described previously. This decellularized tissue was then placed into a 96-well plate. 100,000 cells from each of the cultured cell lines was added to each of the gels in 10 μl of media, these were then incubated for 2 h 5% CO2 incubator at 37 °C before 200 μl media added to each tissue. The next day, tissues and their attached cells were then transferred to a 96-well plate with 200 μl of media and incubated for a further 6 days in a CO2 incubator, with a media change every 2–3 days.
Live/Dead
LIVE/DEAD Viability/Cytotoxicity Kit (Cat: L3224, Thermo Fisher Scientific) was performed according to manufacturer’s instructions and imaged using a Nikon Eclipse TE Spinning Disk Confocal microscope.
Decellularized slice CAR-T cell co-culture, immunostaining and spinning disk confocal real-time timelapse imaging and analysis
The immunostaining method was adapted from Laforêts et al.47. Slices were transferred to a coated plastic petri dish and a stainless steel ring washer was placed around the tumor slice to hold drops of antibody mix, washing medium and T cells/CAR-Ts. Slices were incubated with an antibody mix diluted in phenol red-free RPMI 1640 medium (Cat: 11835030, Thermo Fisher Scientific) for 30 min at 37 °C and washed twice 2 min with phenol red-free RPMI 1640. T cells/CAR-T cells were stained at 37 °C with an antibody mix in phenol red-free RPMI 1640 medium for 15 min, and then washed in phenol red-free RPMI 1640 and then plated onto the recellularized slices at effector:target ratios of 1:1 for 1 h at 37 °C, before the slices were transferred to a glass bottom dish. 3 mL phenol red-free RPMI1640 was added to the imaging dish after securing the slice with a tissue slice anchor.
The real-time imaging method was performed according to Laforêts et al.47. In brief, tumor slices were imaged with a Nikon Eclipse TE equipped with a spinning disk and a temperature-controlled chamber set on 37 °C and 5%CO2 with phenol red-free RPMI 1640 bubbled with carbogen (95% O2, 5% CO2) perfused in the imaging dish.
Analysis was performed according to Laforêts et al.47. In brief, still-frame images were analyzed in 3D and time-lapse recordings were projected to a single z-plane (maximum intensity projection) with the Nikon NIS-Elements software and imported in Imaris 9.1 (Oxford Instruments, Bitplane) for analysis of CAR-T movement and location within the tissue slice.
Decellularized tissue slice glycan cleavage enzyme treatment
N-glycans of the decellularised tissue were cleaved using the amidase PNGase F (Cat: P0704S, New England Biolabs), according to the manufacturer’s protocol with slight modifications. Tissue samples were plated into a flat bottom 96-well plate and 15 μL of PNGase F was used with 10 μL of Glycobuffer in a final volume of 115 μL made up with ddH2O per well. Samples were incubated at 37 °C for 24 h. Terminal sialic acid residues on N- and O- linked glycans were removed using a Neuraminidase Clostridium perfringens (Cat: 11585876001, Roche). Neuraminidase (5 U/ml in a final volume of 100 μL acetate buffer at pH 5) was added onto tissue samples in a 96-well plate. Samples were incubated at 37 °C for 24 h. After treatment with either PNGase F or Neuraminidase samples were washed with PBS + 1% P/S.
Decellularized tissue slice lectin staining
ConA- AF488 specific for to α-D-mannosyl and α-D-glucosyl residues (C11252, ThermoFisher); SNA-FITC, specific for sialic acids with the α2,6 linkage (FL-1301-2, Vector Laboratories); Maackia Amurensis Lectin I (MALI), Fluorescein (FL-1311-2, 2B Scientific), specific for sialic acids with α2,3 linkage; Lycopersicon Esculentum (Tomato) Lectin (LEL), DyLight 488 (FL-1151, 2B Scientific) which recognizes poly-LacNAc structures; Galanthus Nivalis Lectin (GNL) Fluorescein (FL-1241-2, 2B Scientific) which recognizes high mannose structures; and PNA From Arachis hypogaea (peanut), AlexaFluor 488 (L21409, Thermo Fisher Scientific), specific for Galβ1-3GalNAc linkage found in O-glycans were used for the lectin stains of decellularized tissue. Samples were blocked in 5% BSA PBS for 1 h then washed and treated with 200 μL 100 μg/mL ConA-AF488 or 10 μg/mL SNA-FITC, MALI, LEL, GNL, PNA for 1 h at RT before a further wash and imaging using the Nikon TE Eclipse microscope.
Decellularized tissue slice CAR-T cell Siglec phenotype flow cytometry
After co-culture on decellularized tissue for 1 h at 37 °C, CAR-T cells were collected by gently pipetting up and down to detach cells. Cells were then washed and stained with a flow cytometry antibody cocktail and analyzed by flow cytometry. Staining panel used: CD4 (BV605, 1:250, Cat:, Biolegend), CD8 (AF647, 1:100, Cat: 344725, Biolegend), Siglec-5 (PE, 1:100, Cat: 352003, Biolegend), Siglec-7 (AF700, 1:100, Cat: 339209, Biolegend), Siglec-9 (BV421, 1:100, Cat: 743363, BD Biosciences), Siglec-10 (PE Cy7, 1:100, Cat: 347607, Biolegend), Siglec-15 (AF488, 1:100, Cat: FAB9227G, R&D Systems), Zombie NIR (1:1000, Cat: 423106, Biolegend),
Decellularized tissue macrophage culture
Sliced decellularized tissues were equilibrated with RPMI 10% FBS 1% L-Glutamine 1% P/S at 4 °C overnight. Decellularized tissues were removed from RPMI 10% FBS 1% L-Glutamine 1% P/S and excess liquid removed. Decellularized tissue slices were placed into the wells of 96-well plate. To the decellularized tissues, 20 μL of isolated monocytes were added to the center of the tissue at seeding density of 2 × 10⁵/20 μL. The monocytes were incubated with the decellularized tissue at 37 °C for 2 h to allow the cells to attach to the tissue. After 2 h, 200 μL RPMI 10% FBS 1% L-Glutamine 1% P/S was added carefully to the cultures, not to disturb the tissue adhered cells. Cultures were maintained for 14 days and media changed every 48 h.
Decellularized tissue macrophage flow cytometry
Macrophages were harvested, washed and stained with a flow cytometry antibody cocktail and analyzed by flow cytometry. Staining panel used: CD45 (FITC, 1:100, Cat: 368508, Biolegend), CD36 (BV421, 1:100, Cat: 336229, Biolegend), CD163 (BV605, 1:100, Cat: 333616, Biolegend), CD86 (BV650, 1:100, Cat: 105035, Biolegend), HLADR (BV711, 1:100, Cat: 307643, Biolegend), Siglec-9 (BV786, 1:100, Cat: 743366, BD Bioscience), CD209 (APC, 1:100, Cat: 330107, Biolegend), SIRpa (AF700, 1:100, Cat: 323816, Biolegend), Siglec-1 (PE, 1:100, Cat: 346003, Biolegend), CD11b (AF594, 1:100, Cat: 301340, Biolegend), CD206 (PE-Cy7, 1:100, Cat: 321123, Biolegend), Fixable Viability Dye eFluor™ 780 (1:1000, Cat: 65-0865-14, Invitrogen). Samples were acquired on a LSR Fortessa II (BD Bioscience) and analysed using FlowJo v10.8.1 (BD FlowJo LLC).
T cell isolation
Pan-T cell negative selection was performed by magnetic cell sorting (Pan T Cell Isolation Kit, human, 130-096-535, Miltenyi) from frozen PBMCs of autologous samples according to the manufacturer’s instructions. Isolated T cells were activated for 24 h using T Cell TransAct™, human (130-128-758, Miltenyi) with 1:500 IL-2 (1 × 10⁵ IU/mL, 200-02-100UG, ThermoFisher) according to manufacturer’s instructions.
Decellularized tissue T cell and macrophage co-culture
Activated T cells were collected and stained with CellTracker Green (C2925, ThermoFisher) in RPMI, 1:1000 for 30 min at 37 °C. Decellularized tissues with macrophages were removed from media, and 1 × 10⁵/20 μL activated T cells were added to the center of the tissue. The T cells were incubated with the decellularized tissue at 37 °C for 2 h to allow the cells to attach to the tissue. After 2 h, 200 μL RPMI supplemented with 10% HS (human serum, H4522-100ML, Sigma-Aldrich) + 1:500 IL-2 was added carefully to the cultures, not to disturb the tissue adhered cells. Co-culture was maintained for 48 h. In some conditions, cancer cell media derived from HCC38 were used in 1:1 ratio with RPMI to culture macrophages and macrophages – T cell co-culture.
Decellularized tissue T cell and macrophage co-culture flow cytometry
At the end of the 14 days, tissues were dissociated with 1 mg/ml Liberase TL (05401020001, Sigma) and T cells and macrophages collected for flow cytometry staining. Staining panel used: PD1 (PerCP, 1:100, Cat: 329937, Biolegend), CD206 (AF700, 1:100, Cat: 321132, Biolegend), CLA (AF647, 1:100, Cat: 321310, Biolegend), TIM3 (BUV805, 1:100, Cat: 368-3109-42, ThermoFisher), CD8 (BUV563, 1:100, Cat: 612915, BD Bioscience), CD11b (SparkUV 387, 1:100, Cat: 301366, Biolegend), ICOS (BV785, 1:100, Cat: 313533, Biolegend), CD62L (BV711, 1:100, Cat: 304860, Biolegend), Siglec-9 (BV650, 1:100, Cat: 743366, BD Bioscience), CD163 (BV605, 1:100, Cat: 333616, Biolegend), TIGIT (BV510, 1:100, Cat: 372737, Biolegend), LAG3 (BV421, 1:100, Cat: 369314, Biolegend), CD209 (PE-Cy7, 1:100, Cat: 330114, Biolegend), CD162 (Pe, 1:100, Cat: 328806, Biolegend), Fixable Viability Dye eFluor™ 780 (1:1000, Cat: 65-0865-14, Invitrogen).
Samples were acquired on a BD Symphony A3 1 (BD Bioscience) and analysed using FlowJo v10.8.1 (BD FlowJo LLC).
Cytokine quantification by flow cytometry
At the end of 48 h macrophage–T cell co-culture, supernatants were collected and diluted 1:1 in RPMI. The concentration of eight cytokines (IFN-γ, TNF, IL-6, IL-10, IL-12p70, IL-17A, IL-18 and IL-23) was measured by flow cytometry using a multiplex bead-based assay (Cat: 740809, LEGENDplex™; Biolegend), according to the manufacturer’s instructions. Briefly, standards and cell culture supernatant samples were incubated with capture beads in polypropylene 96-well V-bottom plates for 2 h. After washing the plate, biotinylated detection antibodies were added to each well and incubated for 1 h. Streptavidin-phycoerythrin (SA-PE) was subsequently added and incubated for 30 min. The plate was washed, and samples were resuspended in wash buffer and transferred to 5 mL FACS tubes for analysis. Sample acquisition was performed on a LSR Fortessa II (BD Bioscience) flow cytometer using FACSDiva 6.0 software (BD Biosciences, San Diego, CA, USA), and the data were analyzed with LEGENDplex™ Data Analysis Software. Cytokines were identified based on the bead size, their intrinsic fluorescence, and the fluorescent signal emitted from the anti-cytokine antibody/SA-PE complex. Cytokine concentration in samples was determined from the geometric mean fluorescence intensity of PE interpolated on the standard curves calculated from eight standard dilutions measured in duplicate.
Statistical analysis
All statistical analyses were performed using either GraphPad Prism software version 8.3.0 for Windows, GraphPad Software, San Diego, California, USA, www.graphpad.com or the statistical programming language RStudio (2022.02.3 + 492 “Prairie Trillium” Release) and R (version 4.1.1) using the following software plugins: Hmisc for correlation analysis, gplots for correlation scatter plots, ggplot2 for bar charts, pheatmap for heatmaps, dendextend for dendrograms and ggpubr for editing Figs to publication standard. Multivariate correlations were calculated using Spearman’s or Pearson’s correlation as appropriate, applied on linear or log transformed data, where p < 0.05 is considered significant unless otherwise specified and indicated with asterisk: *p < 0.05, **p < 0.01, ***p < 0.005. Statistical tests used were indicated in the Fig. legends.
Reporting summary
Further information on research design is available in the Nature Portfolio Reporting Summary linked to this article.
