


Ethical statement
We confirm that the research performed in the present study complies with all ethical regulations. All animal experiments were performed with the approval of the Institutional Animal Care and Use Committee (IACUC) at Cleveland Clinic (00003354) and Northwestern University (IS00017004 and IS00015772). Both male and female mice were included to account for sex as a biological variable but the therapeutic effects were observed to be not sex dependent.
Cell culture
U87, U251, CT2A (gifted by R. DePinho, cell bank at MD Anderson Cancer Center) and 293 T (American Type Culture Collection, CRL-11268) cells were cultured in DMEM (Gibco, 11995-065) with 1:100 antibiotic–antimycotic (Gibco, 15140-122) and 10% FBS (Fisher Scientific, 16140071). The 005 GSCs (provided by S. D. Rabkin, Massachusetts General Hospital) were cultured in NSC proliferation medium (Millipore, SCM005) containing 20 ng ml−1 epidermal growth factor (PeproTech, AF-100-15) and basic fibroblast growth factor (PeproTech, 100-18B). Raw264.7 and JURKAT cells were cultured in RPMI 1640 medium, containing 10% FBS and 1:100 antibiotic–antimycotic. Raw264.7 cells were treated with 40 ng ml−1 mouse recombinant GM-CSF (315-03-100UG, PeproTech) and 80 ng ml−1 mouse recombinant IL-13 (130-094-070, Miltenyi Biotec) for 3 days before the experiment. All cells were confirmed to be free of Mycoplasma and were maintained at 37 °C and 5% CO2.
Mice and intracranial xenograft tumor models
C57BL/6 (0000664), nude (007850) and ERα-KO (026176) mice were purchased from the Jackson Laboratory. Galr2-KO mice were generated through a targeted mutation in the intron of the Galr2 gene, resulting in premature termination of translation. The original mouse line was obtained from Lexicon Genetics and provided by M. Picciotto’s lab at Yale University to the laboratory of B.K. Galr3-KO mice were originally obtained from the European Mouse Mutant Archive and generated by homologous recombination, targeting both coding exons of the Galr3 gene. Both Galr2-KO and Galr3-KO lines were backcrossed to the C57BL/6N background. Mice were housed in a specific-pathogen-free animal facility under controlled environmental conditions with a 12-h light–dark cycle, an ambient temperature of 20–24 °C and a relative humidity of 30–70%. Animals had ad libitum access to standard chow and water and were monitored daily in accordance with institutional guidelines. The intracranial xenograft GBM models were generated using a previously described protocol6. As approved by the IACUC protocols, animals showing distress, neurological signs (for example, lethargy, hemiparesis, ataxia and seizures) or a moribund appearance were killed. At the end of the experiment, mouse brains were collected for cryosection or immune cell analysis using flow cytometry.
Human samples
The plasma and brain tumor formalin-fixed paraffin-embedded sections of individuals with GBM (Supplementary Table 1) were obtained from the Northwestern CNS Tissue Bank. According to The George Washington University Institutional Review Board (IRB) and the guidelines from the Office of Human Research Protection, the conducted research met the criteria for exemption 4 (45 CFR 46.101(b) Categories of Exempt Human Subjects Research) and did not constitute human research.
Isolation of mouse BM-MDSCs
Mouse BM cells were isolated using the previously described method7. To isolate different MDSC subpopulations, BM-MDSCs were stained with fixable viability dye (Invitrogen, 65-0865-14) and blocked using anti-CD16/CD32 cocktail (BioLegend, 101320) in 2% BSA. Cells were further stained with PE/Cy7 anti-mouse/human CD11b (BioLegend, 101216), AlexaFluor 700 anti-mouse Ly6C (BioLegend, 128024), PE anti-mouse CD68 (BD Bioscience, 566386) and FITC anti-mouse Ly6G (BioLegend, 127606) for 1 h. The following cell subsets were sorted using BD FACSAria (BD Biosciences): mMDSCs (CD11b+CD68−Ly6ChighLy6Glow), gMDSCs (CD11b+CD68−Ly6ClowLy6Ghigh), non-MDSCs (CD11b+CD68−Ly6C−Ly6G−) and macrophages (CD11b+CD68+).
BM chimera generation
BM cells were isolated from WT and Galr3-KO C57BL/6 donor mice. Recipient mice (at least 6 weeks of age) were subjected to 1,100 cGy of total-body irradiation using an X-RAD320 irradiator (Precision). Following irradiation, mice were intravenously transplanted with BM cells from either WT or Galr3-KO donors. To prevent infections during BM reconstitution, Baytril was administered in the drinking water.
Isolation of human MDSCs and mouse CD8+ T cells
Healthy human whole peripheral blood was purchased from StemCell Technologies (70508.1), which was obtained from healthy donors using IRB-approved consent forms and protocols. Samples were provided to the investigators in deidentified form and no donor-identifiable information was accessible to the research team. PBMCs were isolated using Lymphoprep (StemCell Technologies, 07801) density gradient medium and SepMate tube (StemCell Technologies, 85450). The isolated PBMCs were incubated with human IL-6 (Miltenyi Biotec, 130-093-929) and human recombinant GM-CSF (StemCell Technologies, 78140.1) for 6 days to derive MDSCs. Subsequently, the EasySep human CD33 positive selection kit II (StemCell Technologies, 17876) and EasySep magnet (StemCell Technologies, 18000) were used to enrich CD33+ MDSCs.
The mouse primary CD8+ T cells were isolated as we reported previously6. Briefly, CD8+ T cell isolation kit (Miltenyi Biotec, 130-104-075) or EasySep mouse CD8+ selection kit (StemCell Technologies, 18953) were used to sort CD8+ cells from the spleen of C57BL/6 mice. Then, 30 U per ml mouse IL-2 and Dynabeads mouse T-activator CD3/CD28 (Gibco, 11456D) were added to RPMI with 10% FBS for expansion and activation of T cells.
Immunoblotting
Western blotting analysis was used to determine protein expression in cells as a standard protocol we described previously6. After running gels and transferring proteins to the blots, primary antibodies (1:1,000 dilution), including GAL (Invitrogen, PA5-95500), ERα (Invitrogen, MA1-80216), ERβ (Invitrogen, PA1-311), histone H3 (Cell Signaling Technology, 9715S), USP51 (Invitrogen, PA5-68358) and actin (Cell Signaling Technology, 4967S) were incubated with the membrane overnight at 4 °C. After washing, membrane was incubated with corresponding horseradish-peroxidase-linked secondary antibodies (for example, anti-mouse (Cell Signaling Technology, 7076) and anti-rabbit (Cell Signaling Technology, 7074S)). Membranes were developed with enhanced chemiluminescence or Femto maximum-sensitivity substrates (Thermo Scientific, 32209 and 34096). All experiments were repeated at least 2–3 times.
Plasmids and viral transfections
To generate shRNA expression cells, shRNAs targeting mouse Gal, Usp51 and human GAL in the pLKO.1 vector (Sigma, SHC001) were used in this study. Then, 293T cells were used to generate lentiviral particles, which were assembled by 8 μg of pLKO.1 vector and packaging plasmids, including 2 μg of pMD2.G (Addgene, 12259) and 4 μg of psPAX2 (Addgene, 12260). After 48 h of transfection, CM containing lentiviral particles was collected and added to the target cell for 48 h of incubation. Infected cells were selected by 2 μg ml−1 puromycin (Millipore, 540411). Immunoblots were used to determine the protein expression. The following shRNA sequences (from Sigma) were selected for further use after validation: Gal 3, TRCN0000240594; Gal 4, TRCN0000240595; Usp51 3, TRCN0000255143; Usp51 4, TRCN0000255145; Mboat1 1, TRCN0000262727; Mboat1 2, TRCN0000262729; GAL 1, TRCN0000083173; GAL 2, TRCN0000083174; GAL 3, TRCN0000083176.
Migration assays
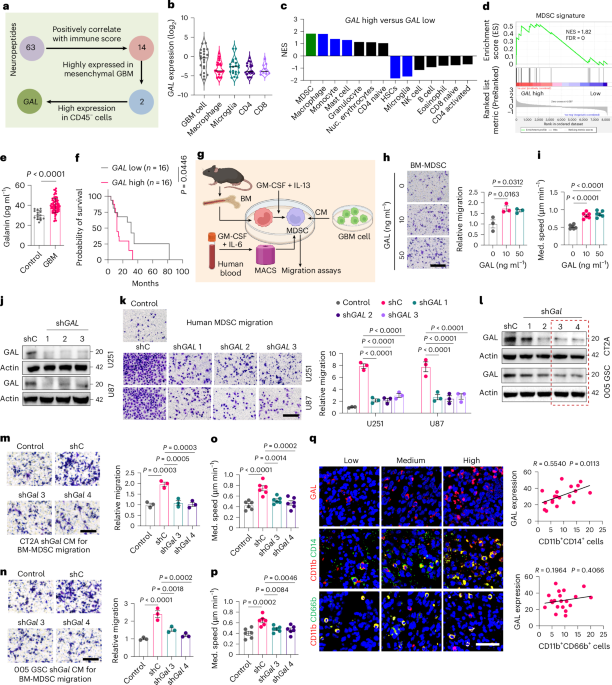
To monitor the MDSC migration in real-time, we used Incucyte live-cell analysis system and TrackMate trajectories analysis system to determine the movement speed of MDSCs6,64. Briefly, BM-MDSCs were cultured in a 96-well plate overnight and then transferred into the Incucyte after the treatment. The images were captured every 30 min and a LoG detector was used for segmentation. The linear assignment problem was used to link images on the basis of the respective distances between MDSCs over the time frames. Additionally, a transwell migration assay was performed on MDSCs as described previously6,49. Briefly, 1 × 10⁴ MDSCs were suspended in the medium with pretreatment, such as GALRs antagonists (SNAP, M40 and M871), Ful, RSL3 and different cell death pathway inhibitors. After the pretreatment, MDSCs were washed with PBS and seeded into 5.0-μm permeable polycarbonate membrane inserts (Corning, 07-200-149) with serum-free medium. The receiver wells contained GAL recombinant protein (OriGene, TP307053) in serum-free medium or GBM cell-derived CM. After 24 h, the migrated MDSCs were fixed in 10% PFA and stained with crystal violet (Sigma, C-3886). The number of migrated MDSCs was recorded using an EVOS microscope and analyzed by ImageJ (National Institutes of Health).
Incucyte live-cell proliferating assay
Cells were seeded into 96-well plates (Corning, 3599) and cultured overnight. Cell growth was then monitored for 72 h using the IncuCyte Zoom live-cell analysis system (Sartorius). Cell proliferation rate was calculated using the following formula: (cell confluency at the indicated timepoint − cell confluency at 0 h)/cell confluency at 0 h.
Viability assay
MDSCs were isolated from ERα-KO mice or from WT mice in which cells were either transfected with shMboat1 or pretreated with GAL recombinant protein, SNAP, Ful and E2 for 1 h. RSL3 was added to the corresponding group to induce ferroptosis for 1–6 h. After treatment, MDSCs were collected and washed with PBS. Fixable viability dye (Invitrogen, 65-0865-14) was added to MDSCs for 10 min on ice. Following washing with PBS and fixing with fixation buffer (BioLegend, 420801), the signal of the ferroptotic MDSCs was read in a BD FACSymphony A5 flow cytometer. Cell viability was calculated using FlowJo version 10.10.
Measurement of lipid peroxidation
MDSCs were seeded at appropriate density in six-well plates and subjected to RSL3 with or without the pretreatment of GAL and SNAP. After the treatment, MDSCs were collected and stained with BODIPY 581⁄591 C11 reagent (Fisher Scientific, D3861) for 30 min. The labeled MDSCs were collected and washed with PBS. A BD FACSymphony A5 flow cytometer and FlowJo version 10.10 were used to analyze fluorescence signals. The ratio of intensity in Texas red to the intensity in FITC represents the oxidation of BODIPY C11.
Detection of labile iron(II) ions
MDSCs were seeded in six-well plates and left overnight. The MDSCs were then treated with or without SNAP and GAL, with or without supplementation of FAC (MedChemExpress, HY-B1645). After the treatment, MDSCs were collected and stained with BioTracker far-red labile Fe2+ live-cell dye (MilliporeSigma, SCT037) for 1 h at 37 °C. The signal of labile Fe2+ was detected using a BD FACSymphony A5 flow cytometer, followed by analysis using FlowJo version 10.10.
CHX chase assay
To determine the protein stability of ERα, 50 mg ml−1 CHX (MilliporeSigma, 239763-M) was added to the medium at a 1:1,000 ratio for culturing MDSCs with or without GAL pretreatment. The cells were scraped at different time points and lysed to extract proteins. The ERα expression was determined by western blotting.
Immunofluorescence
Fresh brain tumor samples were isolated from GBM mouse models and subjected to cryosectioning. The mouse or human tumor slides were blocked with 5% goat serum at room temperature for 30 min and then incubated with primary antibodies (1:100 dilution), including CD69 (Santa Cruz, sc-373799), CD11b (Abcam, ab8878), F4/80 (Cell Signaling, 30325S), ERα (Invitrogen, MA1-80216), ERβ (Invitrogen, PA1-311), 4-HNE (Invitrogen, MA5-27570), CD14 (Abcam, ab181470) or CD66b (NOVUS, NB100-77808) overnight at 4 °C. The secondary antibody cocktail was then applied to slides for 1 h at room temperature. Coverslips were mounted to the slides using DAPI and antifade mounting medium (Vector Laboratories, H-1200-10). The signals in tumor tissues were captured using a Nikon AX/AX R confocal microscope.
RT–qPCR
RNA of MDSCs was isolated using the RNeasy Mini Kit (Qiagen, 74106). The concentration of RNA was determined by the NanoDrop spectrophotometers. cDNA was synthesized with all-in-one 5× RT master mix (Applied Biological Materials, G592) in a T100 thermal cycler (Bio-Rad). qPCR reactions were performed using a CFX Connect real-time PCR detection system (Bio-Rad) and SYBR green PCR master mix (Bio-Rad, 1725275). For quantifying mRNA expression levels, the threshold cycle values for targeted genes were normalized to the expression levels of Actb. RT–qPCR primers (from Sigma) are listed in Supplementary Table 2.
Flow cytometry
To assess myeloid cell infiltration in mouse brain tumor tissues, we conducted flow cytometry analysis using a previously established protocol6,7. The cells were incubated with an antibody cocktail (1:100) containing PE/Cy7 anti-mouse/human CD11b, AlexaFluor 700 anti-mouse Ly6C and FITC anti-mouse Ly6G for 1 h on ice. Following this, the surface proteins-labeled cells were fixed in a fixation buffer (BioLegend, 420801) and stored overnight at 4 °C. GALR antibodies (1:100), including GALR1 (G-Biosciences, ITT1844), GALR2 (G-Biosciences, ITT1845) and GALR3 (Abcam, ab190694), were added to the antibody cocktail followed by the corresponding AlexaFluor 594-conjugated secondary antibody to evaluate GALR expression in each cell subpopulations. For staining intracellular proteins, cells were incubated in fixation buffer for 20 min at room temperature after surface protein staining as mentioned above. The permeabilization was conducted by incubating cells with perm buffer (0.1% Triton X-100 in PBS) for 5 min. Single-cell suspensions were then washed with perm buffer two times and incubated with PE anti-mouse CD68 and ERα antibody (Invitrogen, MA1-80216; 1:100), followed by corresponding AlexaFluor 594-conjugated secondary antibody. After two washes with perm buffer, myeloid cells were subsequently analyzed using either the BD FACSymphony A5 or BD LSRFortessa and the resulting data were analyzed using FlowJo.
To analyze the splenic T cells in GBM mouse models, we followed a standard protocol to isolate splenic cells6. T cells were labeled with the following antibodies (1:100): AlexaFluor 488 anti-mouse CD3 (BioLegend, 100210), PerCP/Cyanine5.5 anti-mouse CD45 (BioLegend, 103132), PE/Cy7 anti-mouse CD69 (BioLegend, 104512), BV711 anti-mouse CD8 (BioLegend, 100747) and BUV395 anti-mouse CD4 (BD Bioscience, 740208). The single-cell suspensions were then analyzed using BD FACSymphony A5 or BD LSRFortessa and the data were analyzed with FlowJo. Gating strategies are shown in Supplementary Fig. 1.
ELISA
The concentration of GAL in human plasma and supernatant of GBM cell-derived cell culture medium was measured by ELISA using the human GAL ELISA kit (MyBioSource, MBS2505508) according to the manufacturer’s instructions. The Biotek Synergy 2SL microplate reader was used to read the optical density (OD) value of the ELISA plate.
MDSC–T cell coculture
The MDSCs were preincubated with or without CM derived from CT2A or U87 cells before being cocultured with T cells. Mouse primary CD8+ T cells were activated using Dynabeads mouse T-activator CD3/CD28 (Gibco, 11456D). The cancer cell CM-treated MDSCs were then incubated with GAL and SNAP. After washing, the MDSCs were added to a six-well plate to coculture with the activated T cells at a ratio of 1:1, 1:2 or 1:4. At the end of the coculture period, all cells were collected and analyzed for the CD45+CD8+IFNγ+ CD8+ T cell and CD11b−IFNγ+ and CD11b−CD69+ JURKAT cell populations using the BD FACSymphony A5, following a previously described protocol6.
Cytotoxicity assay
The Cytotox96 nonradioactive cytotoxicity assay kit (Promega, G1780) was used to determine the cytotoxicity of CD8+ T cells on GBM cells. Briefly, activated mouse primary CD8+ T cells or human JURKAT T cells were first cocultured with matched MDSCs with different pretreatments and CT2A or U87 cell-derived CM. T cells were then collected for further coculturing with CT2A or U87 cells (target cells). T cell-induced cytotoxicity was determined according to the manufacturer’s instructions. The OD in 96-well plates was measured using a Biotek Synergy 2SL microplate reader. Relative lactate dehydrogenase release was calculated as follows: (OD value of coculture − OD value of effector spontaneous − OD value of target spontaneous)/(OD value of target maximum − OD value of target spontaneous).
RNA-seq
BM-MDSCs were derived from mouse primary BM cells and treated with recombinant GAL protein (10 ng ml−1) or CT2A cell-derived CM. RNA was then extracted from the MDSCs and sequenced using a previously established protocol6. Oligo-dT-based libraries were prepared and analyzed using the Novaseq 6000 system (paired-end) at The University of Chicago Functional Genomics facility (RRID: SCR_019196). RNA-seq quality control and mapping were performed on the Galaxy server7. Raw FASTQ data were trimmed using the Trimmomatic function and the trimmed reads were then mapped to the mouse (mm10) genome using the HISAT2 program. BAM data from two flowcells were merged using SAMtools and gene expressions were calculated using FeatureCounts. Differentially expressed genes were identified using the Limma model and GSEA was conducted on the basis of the differential expression table.
Co-immunoprecipitation assay
Co-immunoprecipitation was performed using the Invitrogen Dynabeads protein G IP kit (Thermo Fisher Scientific, 10007D)6,25. Briefly, MDSCs were isolated from ERα-KO and WT mice in which cells were either transfected with shUsp51 or treated or without recombinant GAL protein and SNAP and then subjected to RIPA lysis buffer to extract protein. Next, 1.5 mg of magnetic beads were separated with a magnetic stand and incubated with ERα antibody or IgG isotype control (Cell Signaling Technology, 2729) for 10 min at room temperature. The MDSC lysate was then incubated with the antibody-conjugated magnetic beads overnight at 4 °C with rotation. The immunoprecipitated antibody–antigen complex was eluted from the beads and subjected to immunoblotting to detect ubiquitination by detecting the binding of ubiquitin on purified ERα from MDSC using ubiquitin antibody (Cell Signaling Technology, 43124S).
Lipidomic analyses
To investigate the role of GAL in early ferroptosis-associated lipid remodeling, we pretreated BM-MDSCs with GAL protein (10 ng ml−1) in combination with a 4-h stimulation of RSL3 (20 μM) overnight before conducting a lipidomic analysis. After the treatment, MDSCs were collected and washed with PBS. The fresh cell pellets were then sent to the Metabolomics Platform at the University of Chicago for analysis. Lipid was extracted by a modified liquid–liquid extraction method65. Lipid species were separated by chromatography using a Thermo Scientific Accucore C30 (2.1 × 150 mm, 2.6 μm) column coupled to a Vanquish Horizon ultrahigh-performance liquid chromatography system and an IQ-X tribrid mass spectrometer. The Thermo Scientific LipidSearch software (version 5.0) was used to generate the list of identified lipids using the following parameters: precursor tolerance, ±3 ppm; production tolerance, ±5.0 ppm; product threshold, 1.0. The [M + H] adduct was used to identify and quantify hexosylceramide, sphingomyelin, sphingosine, methylPC, coenzyme Q, acylcarnitine, LysoPC, LysoPE, PC and PE species, whereas the [M + NH] adduct was for the TG, diglyceride and cholesteryl ester species. These identified lipid species were quantify using the Compound Discoverer 3.3 and Skyline software.
Bioinformatic analysis of human GBM datasets
The 63 neuropeptide genes encoding secreted proteins were downloaded from the HGNC database. TCGA GBM dataset or other available datasets from GlioVis and cBioPortal were used to conduct gene correlation analyses, signature score calculations, GSEA (hallmark pathways) and survival analyses, as we previously described7,25. The single-cell sequencing data of tumors from individuals with GBM were downloaded and analyzed by using the BBrowser BioTuring under Talk2Data platform. Data from public repositories were integrated and used in this study, including GSE182109 (ref. 27) and GSE135045 (ref. 28). The single-cell gene expression pattern of GAL in GBM/GSC cells was analyzed. On the basis of GAL expressions in tumor cells, individuals were regrouped into GAL-low and GAL-high subgroups. MDSCs from each group were selected for GSEA analysis. The brain TIME dataset66, generated by RNA-seq of isolated CD45− tumor cells, macrophages, microglia, CD4 and CD8 T cells from tumors of individuals with GBM, was used to assess GAL expression. The 38-gene MDSC signature (Supplementary Table 3)30 was used for analyzing MDSC content in GBM TCGA tumors and clustering them into MDSC-high and MDSC-low subgroups.
Statistical analysis
No statistical methods were used to predetermine sample sizes but our sample sizes are similar to those reported in previous publications5,6,7,8,23,64,67. Data collection and analysis were not performed blind to the conditions of the experiments. Randomization was not relevant for certain mechanistic in vitro experiments because all treatment conditions were applied to genetically and biologically comparable cell populations derived from the same source. For in vivo experiments, randomization was not performed because animals were genetically identical and housed under identical conditions; as such, no baseline differences were expected between groups. No data were excluded from analysis. Statistical analysis for comparisons between groups was performed using GraphPad Prism 10 (GraphPad Software). All the measurement data were presented as the means ± s.e.m. and assumed to be t-distributed. Correlation analysis was conducted using the Pearson test to determine the Pearson R correlation coefficient and associated P value. The survival analysis for animal models was determined by conducting a log-rank (Mantel–Cox) test. Comparisons between two groups were conducted using Student’s t-tests and comparisons among multiple groups were evaluated using a one-way analysis of variance (ANOVA) with Tukey’s post hoc test. All experiments shown in the figures represent biological replicates and each sample was analyzed with three technical replicates. The numbers of independent samples were noted in the figure legends. Data distribution was assumed to be normal but this was not formally tested.
Reporting summary
Further information on research design is available in the Nature Portfolio Reporting Summary linked to this article.
