


Cohort characteristics
A total of 112,204 individuals (10,039 with non-European genetic ancestry) from CHB were included in the study, of whom 9246 were diagnosed with CRC (2849 with rectal cancer and 6397 with colon cancer). Furthermore, 8995 individuals were diagnosed with a minimum of one colorectal adenoma. The median age of first CRC was 72 years (lower quartile (LQ): 64 years; upper quartile (UQ): 79 years) and 44% were female. The median age of first adenoma was 70 years (LQ: 63 years; UQ: 75 years) and 40% were female. Demographics, clinical and tumour characteristics of all individuals are provided in Table 1. Supplementary Table S2 provides the same characteristics stratified by European or non-European genetic ancestry. The median follow-up time was 76.5 years (95% CI: 76.4, 76.6) for CRC as the outcome and 76.4 years (95% CI: 76.3, 76.5) for adenomas.
Table 1 Demographics, clinical and tumour characteristics.
Lifetime risk of CRC in PRS groups and across sex
Population-recalibrated cumulative incidence showed that PRS identifies individuals at both higher and lower risk, and that incidence was higher in men than in women (Fig. 2a, b). For men the cumulative incidence for CRC at age 80 was 12.22% (95% CI: 9.87, 14.76) for individuals in the ≥99th and 8.81% (95% CI: 8.00, 9.73) in the 80–99th percentile group. In contrast, among individuals in the reference group (20th-80th percentile), 5.82% (95% CI: 5.30, 6.44) developed CRC by age 80. For those in the 0-20th percentile, only 3.07% (95% CI: 2.71, 3.48) developed CRC. For woman the cumulative incidence for CRC at age 80 was 9.54% (95% CI: 7.64, 12.11), 6.57% (95% CI: 5.80, 7.33), 4.30% (95% CI: 3.83, 4.74), 2.55% (95% CI: 2.21, 2.92) for individuals in the ≥99th, 80–99th, 20–80th and 0–20th percentile, respectively. The PRS groupings showed similar behaviour across both ancestry groups (see Supplementary Figs. S1 and S2). Among individuals of European ancestry, the cumulative incidence of CRC at age 80 was 16.12% (95% CI: 13.72–18.54), 10.39% (95% CI: 9.94–10.84), 6.58% (95% CI: 6.38–6.79) and 3.72% (95% CI: 3.44–3.99) for individuals in the ≥99th, 80th–99th, 20th–80th and 0–20th percentiles, respectively. Corresponding estimates for individuals of non-European ancestry were 11.32% (95% CI: 5.47–17.17), 9.81% (95% CI: 9.41–11.22), 6.34% (95% CI: 5.67–7.01) and 3.15% (95% CI: 2.39–3.90) (Fig. 2).
Fig. 2: Cumulative incidence for lifetime risk of CRC by PRS.
a Cumulative incidence with 95% confidence bands for lifetime risk of CRC across PRS groupings in males. b Cumulative incidence with 95% confidence bands for lifetime risk of CRC across PRS groupings in females.
At age 50, when the national screening program begins in Denmark, the cumulative incidence is 0.20% for men and 0.21% for women [32]. In the 20–80th percentile, the same incidence is reached also at age 50. By contrast, individuals in the ≥99th percentile reach this incidence earlier, at ages 45 for males and 44 for females, and those in the 80–99th percentile group reach it at age 47. In contrast, for the lowest-risk group (0–20th percentile), the same incidence is not reached until age 54. A similar pattern was observed between ages 45 and 60, where individuals with a high PRS reached the incidence levels of low-PRS individuals roughly 10 years earlier (see Supplementary Table S3).
Cox models showed that compared to individuals in the 20–80th percentile, individuals in the 80–99th and ≥99th percentiles had significantly higher risk of developing CRC, with hazard ratio (HR) of 1.55 (95% CI: 1.48–1.62, p < 0.001) and 2.22 (95% CI: 1.92–2.57, p < 0.001), respectively. In contrast, individuals in the 0-20th percentile had a reduced risk (HR: 0.55, 95% CI: 0.51–0.59, p < 0.001). Males had a higher risk of developing CRC compared to females with a HR of 1.20 (95% CI: 1.15–1.25, p < 0.001). There was no significant interaction between sex and PRS. There was no difference between European and non-European in the ancestry-stratified analysis (Supplementary Fig. S3).
Lifetime risk of adenoma in PRS groups and across sex
Cox models showed that a CRC PRS can stratify risk of adenomas almost as well as for CRC, see Supplementary Fig. S3. Compared to individuals in the 20–80th percentile, the risk of adenoma was higher for individuals in the 80–99th and ≥99th percentiles with HR of 1.44 (95% CI: 1.37–1.51, p < 0.001) and 1.92 (95% CI: 1.64–2.25, p < 0.001), respectively, and lower for individuals in the 0–20th percentile (HR: 0.70, 95% CI: 0.66–0.74, p < 0.001). Males had a higher risk of developing adenomas compared to females with a HR of 1.43 (95% CI: 1.37–1.49, p < 0.001). There was no significant interaction between sex and PRS.
Association of PRS with lifetime CRC risk across tumour characteristics
Cause-specific Cox models showed that, across histology types and CRC sites, individuals in the ≥99th and 80–99th percentiles had higher CRC risk compared to the reference group, while those in the 0–20th percentile had lower risk, see Fig. 3. Exceptions were observed in small subgroups, such as unspecified colon site CRC (N = 10), where sample size was low.
PRS also stratified risk among individuals with pMMR tumours but not among the 623 individuals with dMMR tumours. For dMMR tumours, no differences were observed between high-percentile groups and the reference group. Individuals in the 0–20th percentile had lower risk (HR = 0.81, 95% CI = 0.65–1.01, p = 0.05), but still markedly higher than pMMR tumours in the same percentile (HR = 0.48, 95% CI = 0.43–0.54, p < 0.001).
Fig. 3: Cause-specific hazard ratios (HRs) with 95% CIs for lifetime CRC risk across PRS groups.
HRs above 4 are truncated. AC adenocarcinoma, dMMR deficient mismatch repair, pMMR proficient mismatch repair.
Cumulative incidence analyses confirmed that PRS stratifies risk in pMMR but not in dMMR tumours (Supplementary Fig. S4). Demographics, clinical and tumour characteristics for individuals with pMMR tumours and dMMR tumours are provided in Supplementary Table S4.
CRC and adenoma risk prediction
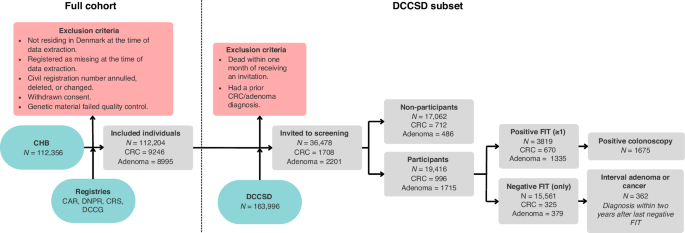
Screening invitations were sent to 36,478 individuals in the CHB cohort, of whom 19,416 participated at least once. A total of 35,145 screenings (FIT tests) were conducted, meaning that they on average had participated 1.81 times. Among the participants, 996 individuals were diagnosed with CRC and 1715 with adenoma, with 296 and 1396 of these cases identified through screening (positive FIT followed by positive colonoscopy), respectively. Using the screening participants three analyses were conducted. Summary statistics for all analyses are reported in Supplementary Table S5 and boxplots of fold-wise performance are presented in Fig. 4.
Fig. 4: Boxplots showing fold-wise performance of models assessing the contribution of baseline variables, FIT and PRS, individually and in combination, across three analyses.
a Prediction of adenoma or CRC at first screening using Cox proportional hazards models, evaluated by the C-index. b Prediction of negative colonoscopy outcome among FIT-positive participants using logistic regression, evaluated by AUC. c Prediction of adenoma or CRC within 2 years after a negative FIT result using logistic regression, evaluated by AUC. Baseline models included age, sex, PC1-PC4 and genotyping chip.
First, risk of adenoma or CRC was predicted from the time of first screening. A total of 3547 participants were aged ≤56 years at screening initiation, of whom 281 were diagnosed with adenoma or CRC by the end of follow-up. Compared to the baseline + FIT model (median C-index = 0.78, IQR = 0.02), adding PRS (median C-index = 0.79, IQR = 0.05) did not markedly improve predictive performance.
Second, colonoscopy outcomes (1660 positive vs. 1625 negative) were predicted among FIT-positive participants. Predictive performance for colonoscopy outcomes was generally low (median AUC ≤ 0.59). Overall, the PRS + baseline model (median AUC = 0.58, IQR = 0.02) showed slightly better performance than the FIT + baseline model (median AUC = 0.56, IQR = 0.01). Adding FIT to the PRS + baseline model (median AUC = 0.58, IQR = 0.02) only marginally increased the AUC.
In the third analysis, the prediction of adenoma or CRC (interval cancer) within 2 years following a negative FIT result was examined. Among the 15,561 participants with only negative FIT results, 362 individuals developed an adenoma or interval cancer. Overall model performance was modest (median AUC < = 0.60). While the FIT + baseline model (median AUC = 0.59, IQR = 0.03) performed slightly better than the PRS + baseline model (median AUC = 0.57, IQR = 0.03), adding PRS to the FIT + baseline model resulted in a modest improvement in predictive performance (median AUC = 0.60, IQR = 0.02).
Sensitivity analysis
In the sensitivity analysis restricted to individuals of European ancestry (N = 102,165), the genome-wide PRS showed stronger stratification of the population recalibrated cumulative incidence at age 80, compared to the PRS based on 203 significant SNPs. In the ≥99th percentile cumulative incidence was 11.52% (95% CI: 9.35–14.33) vs 10.37% (8.30–13.14) for women, and 14.74% (11.99–17.68) vs 12.73% (10.27–15.43) for men, for respectively the genome-wide and 203-SNP PRS. Similarly lower estimates were found in the bottom percentile (women: 2.29% (1.96–2.64) vs 2.55% (2.20–2.92); men: 2.86% (2.51–3.25) vs 3.12% (2.75–3.54)), and across intermediate PRS groups (Supplementary Material 2).
When exploring the association between PRS and lifetime CRC risk across tumour characteristics, the genome-wide PRS also provided stronger risk stratification with more pronounced HR between PRS groups (Supplementary Material 2).
The CRC and adenoma risk prediction analysis restricted to individuals of European ancestry showed that the PRS estimated from 203 SNPs and the genome-wide PRS perform very similarly, with only small differences in all three prediction analyses. The genome-wide PRS showed slightly better predictions in analyses 2 and 3 but did not outperform the 203-SNP PRS in analysis 1 (Supplementary Material 2).
