


Patient cohort
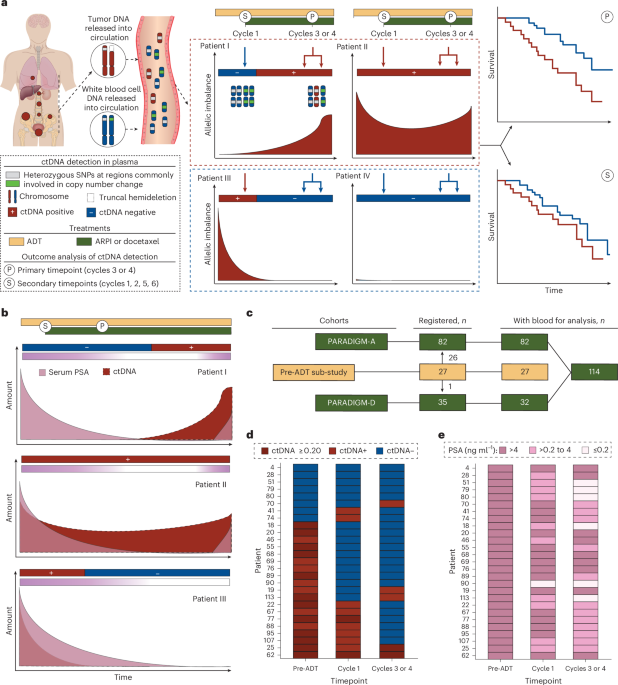
Between September 2019 and February 2023, 117 patients from 14 centres around the United Kingdom (Extended Data Fig. 1 and Supplementary Table 1) were recruited to the PARADIGM study. Of these, 114 commenced doublet therapy (32 with docetaxel and 82 with an ARPI) and gave a blood sample (Fig. 1c). To address the risks of multiple testing when evaluating associations of ctDNA and outcomes at multiple timepoints, we a priori defined ctDNA detection at cycles 3 or 4 as the primary timepoint of interest, as it would be early enough to institute a change in treatment. In total, 104 patients provided blood samples at this primary timepoint: either at both cycles (n = 59), or exclusively at cycle 3 (n = 38) or cycle 4 (n = 7). Of these, 31 patients received docetaxel in addition to ADT (PARADIGM-D) and 73 patients received an ARPI (PARADIGM-A). Baseline characteristics by treatment cohort and the types of ARPIs used in PARADIGM-A are outlined in Supplementary Tables 2 and 3. For the study population included in the primary timepoint analysis, the median age was 68 years, the median PSA before starting ADT was 171 ng ml−1, 72% (75 out of 104) of patients had a Gleason score of ≥8 and 92% (96 out of 104) had metastatic disease at diagnosis (synchronous). Docetaxel or ARPI were started a median of 57 days after initiation of ADT (range, 12–108 days). At cycle 3 or 4, 27% (28 out of 104) of patients had a serum PSA > 4 ng ml−1, 52% (54 out of 104) had a PSA of 0.2–4 ng ml−1 and the remainder (21%; 22 out of 104) had a PSA of ≤0.2 ng ml−1 (Supplementary Table 4).
Consistent with our pre-specified estimate, 29% (30 out of 104) of patients at cycles 3 or 4 had detectable ctDNA (32%; 10 out of 31) in PARADIGM-D and 27% (20 out of 73) in PARADIGM-A; the median ctDNA fraction among patients who were ctDNA-positive was 0.03 with an interquartile range (IQR) of 0.02–0.14. Patient baseline characteristics according to ctDNA detection at cycles 3 or 4 are listed in Table 1. Among patients who were ctDNA-positive, none had metachronous metastases, and only 7% of patients had visceral metastases (versus 24% of those who were ctDNA-negative).
Table 1 Patient characteristics according to ctDNA status at cycles 3 or 4
Circulating tumor DNA detection in sequential sampling from initiation of ADT
For patients with suspected metastatic disease, ADT is often started immediately at diagnosis. Obtaining a research blood sample before starting ADT may therefore not be feasible for every patient. To confirm the extent of ctDNA change with treatment in individual patient sequential samples, we conducted a sub-study that included 27 (out of 104) patients who, in addition to having blood samples taken at cycle 1 and cycles 3 or 4, also had blood samples taken before ADT. Comparing sequential timepoints in individual patients, ctDNA detection declined significantly after the start of ADT: 19 out of 27 samples (70%) collected before ADT were ctDNA-positive (median ctDNA fraction, 0.22; IQR, 0.04–0.31) compared to ten samples (37%; median ctDNA fraction, 0.04; IQR, 0.02–0.11) at cycle 1 (P = 0.02) and four samples (15%; median ctDNA fraction, 0.07; IQR, 0.01–0.15) at cycles 3 or 4 (P < 0.001) (Fig. 1d). One patient (4%) had ctDNA at cycle 3 or 4 but no ctDNA before ADT or at cycle 1. There was no notable difference in the ctDNA detection rate between samples collected at cycle 1 and cycles 3 or 4 (P = 0.23). Similarly, comparing high ctDNA levels (defined in our ctDNA calling algorithm as ≥0.20 tumor fraction; see Methods) in sequential ctDNA from individual patients, 12 out of 27 patients (44%) had a high ctDNA fraction before ADT compared to two out of of 27 patients (7%) at cycle 1 (P = 0.002) and two out of 27 patients (7%) at cycles 3 or 4 (P = 0.002) (Fig. 1d,e).
Major outcomes according to detection of circulating tumor DNA at cycle 3 or 4
Progression-free survival
After a median follow-up of 41 months, 44 patients had died and 66 had progressed or died. Progression-free survival (PFS) for PARADIGM-D (median, 11.66 months; 95% CI, 8.90–13.37 months) and PARADIGM-A (median, 32.62 months; 95% CI, 21.68 months to not reached) (Supplementary Table 5) are reported separately owing to different definitions of disease progression for patients treated with docetaxel versus ARPI. In PARADIGM-D, the 12 month PFS rates were 10% (95% CI, 1–36%) for patients who were ctDNA-positive and 62% (95% CI, 38–79%) for those who were ctDNA-negative. In PARADIGM-A, patients who were ctDNA-positive had a 12 month PFS rate of 70% (95% CI, 45–85%), and those who were ctDNA-negative had a rate of 81% (95% CI, 68–89%) (Supplementary Table 6). In the PARADIGM-D cohort, the hazard ratio (HR) was 3.87 (95% CI, 1.60–9.34; P = 0.003), while the HR for PFS in the PARADIGM-A cohort was 1.46 (95% CI, 0.73–2.90; P = 0.29) (Fig. 2a–c). Consistent with this finding, in the PARADIGM-A cohort, age was the only variable associated with PFS (Supplementary Table 7; multivariable adjustments were not performed for PARADIGM-D owing to the smaller number of events). The landmark analyses showed a similarly strong association for ctDNA with PFS in PARADIGM-D (HR, 3.57; 95% CI, 1.43–8.90) but no association in PARADIGM-A (HR, 1.20; 95% CI, 0.57–2.51; Supplementary Table 8).
Fig. 2: Primary endpoint: circulating tumor DNA at cycles 3 or 4.The alternative text for this image may have been generated using AI.
a, Forest plot of adjusted HR estimates for PFS in PARADIGM-A (n = 73 patients) and PARADIGM-D (n = 31 patients). b, PFS Kaplan–Meier curve for PARADIGM-A (n = 73 patients). c, PFS Kaplan–Meier curve for PARADIGM-D (n = 31 patients). d, Forest plot of adjusted HR estimates for OS for the total cohort included in primary analysis (n = 104 patients), PARADIGM-A and PARADIGM-D. e, Kaplan–Meier curve for OS for the total cohort included in primary analysis (n = 104 patients). For the forest plots, HRs were estimated by multivariable Cox proportional hazard models. The points marked by a circle represent the adjusted HR estimates, and the horizontal whiskers denote the corresponding 95% confidence intervals. The area to the right of the dotted line represents increasing risk of death or shorter time to progression in patients who were ctDNA-positive. Exact P values were reported from the Wald z-test without adjustments for multiple comparisons, and all statistical tests were two-sided. Event rates at pre-specified timepoints are indicated by the dotted lines. Tick marks indicate censored data. An unadjusted HR is stated on the Kaplan–Meier curve. Survival distributions were compared using the two-sided log-rank test.
Source data
Overall survival
Unlike PFS, median overall survival (OS) was similar in PARADIGM-D (42.87 months, (95% CI, 23.95 months to not reached) and PARADIGM-A (49.02 months; 95% CI, 35.55 months to not reached; Supplementary Table 5)). The OS rate in both cohorts combined at 12 months was 73% (95% CI, 54–86%) for patients who were ctDNA-positive compared to 99% (95% CI, 91–100%) in those who were ctDNA-negative. The corresponding 24 month OS rates were 50% (95% CI, 31–66%) and 85% (95% CI, 75–91%), respectively. At 36 months, only 39% (95% CI, 22–56%) of the patients who were ctDNA-positive were alive compared to 68% (95% CI, 56–78%) of those who were ctDNA-negative (Supplementary Table 6). The median OS was shorter in patients who had detectable ctDNA at cycles 3 or 4 compared to those who were ctDNA-negative (median, 24 months versus not reached; HR, 3.07; 95% CI, 1.64–5.74; P < 0.001; Fig. 2d,e). The association was strongest in the PARADIGM-D cohort (HR, 11.86; 95% CI, 3.71–37.94; P < 0.001; Fig. 2d). Landmark analysis at treatment cycle 4 was consistent with these estimates, with median OS of 21.39 months (95% CI, 11.56 months to not reached) for patients who were ctDNA-positive, and not reached (95% CI, 40.80 months to not reached) for patients who were ctDNA-negative (HR, 3.01; 95% CI, 1.61–5.64; Supplementary Table 9). In multivariable models including ctDNA and all clinical variables used for adjustment, ctDNA at the primary timepoint was the only factor that had a significant association with OS (Supplementary Table 10).
OS according to circulating tumor DNA detection at secondary timepoints
Having met the primary objective, we proceeded to evaluate the association of ctDNA at cycles 1, 2, 5 and 6. OS was prioritized as a more reproducible and clinically relevant endpoint. Of the 114 patients who started doublet therapy, 112 gave a blood sample at cycle 1. Amongst these patients, 102 also had ctDNA testing at cycles 3 or 4 (a blood sample was not collected from the other two patients at cycle 1). At cycle 1, 27 out of 102 patients (27%) were ctDNA-positive (median ctDNA fraction, 0.03; IQR, 0.02–0.30). CtDNA detection at cycle 1 was associated with PFS in PARADIGM-A (HR, 2.20; 95% CI, 1.08–4.47) but not in PARADIGM-D (HR, 1.59; 95% CI, 0.70–3.62) (Fig. 3a–c). There was an association between ctDNA detection at cycle 1 and worse OS (HR, 2.54; 95% CI, 1.34–4.79) (Fig. 3d,e). This result was similar in PARADIGM-A (HR, 2.39; 95% CI, 1.06–5.39) and PARADIGM-D (HR, 2.32; 95% CI, 0.83–6.46; Fig. 3d). Time-dependent analysis (adjusted for baseline variables) demonstrated that at any given time during follow-up, among all evaluable patients (n = 104), those who were ctDNA-positive had a higher hazard of death compared to patients who were ctDNA-negative (HR, 2.74; 95% CI, 1.35–5.59; P = 0.005) (Fig. 3f). Patients who were ctDNA-positive both at cycle 1 and cycles 3 or 4 had significantly worse OS (median, 8.5 months, 95% CI, 3.7–13.1 months; HR, 17.00, 95% CI, 6.64–43.47, P < 0.0001) compared to those who were ctDNA-negative at both timepoints (Supplementary Table 11).
Fig. 3: ctDNA at exploratory timepoints.The alternative text for this image may have been generated using AI.
Analyses by ctDNA status at cycle 1. a, Forest plot of adjusted HR estimates for PFS for PARADIGM-A (n = 72 patients) and PARADIGM-D (n = 30 patients). b, Kaplan–Meier curves of PFS for PARADIGM-A (n = 72 patients). c, Kaplan–Meier curves of PFS for PARADIGM-D (n = 30 patients). d, Forest plot of adjusted HR for OS for all patients with a cycle 1 sample (n = 102 patients), PARADIGM-A and PARADIGM-D. HRs in forest plots were estimated from a multivariable Cox proportional hazard model. The points marked by a circle represent the adjusted HR estimates, and the horizontal whiskers denote the corresponding 95% confidence intervals. Exact P values were reported from two-sided Wald z-tests without adjustments for multiple comparisons. e, Kaplan–Meier curves of OS for all patients with a cycle 1 sample (n = 102 patients). Survival distributions were compared using the two-sided log-rank test. Event rates at pre-specified timepoints are indicated by dotted lines. Tick marks indicate censored data. Unadjusted HR is stated on the Kaplan–Meier curve. f, Forest plot for time-varying analysis using information from every timepoint from all patients with a cycle 3 or 4 sample (n = 104 patients) for OS and for PFS split by PARADIGM-A (n = 73 patients) or PARADIGM-D (n = 31 patients). HRs were estimated from a time-dependent Cox proportional hazard model. The points marked by a circle represent HRs, and the horizontal whiskers denote the 95% confidence intervals. Exact P values were reported from two-sided Wald z-tests without adjustments for multiple comparisons. The area to the right of the dotted line represents increasing risk of death or shorter time to progression in patients who were ctDNA-positive.
Source data
Secondary analyses of combined circulating tumor DNA and PSA for predicting survival
ctDNA and PSA at cycles 3 or 4
The secondary objective of the study was to evaluate combinations of serum PSA categories, previously shown to be prognostic after 6–12 months of treatment10,11, and ctDNA. First we compared patients with PSA ≤ 0.2 ng ml−1 at cycles 3 or 4 to higher PSA values at this timepoint and identified that OS was worse for patients with PSA > 0.2 to 4 ng ml−1 (HR, 3.22; 95% CI, 0.94–11.05) or PSA > 4 ng ml−1 (HR, 9.07; 95% CI, 2.51–32.83) (Extended Data Fig. 2). In multivariable analyses, we identified that the associations between ctDNA and OS were at least as strong as between PSA and OS, and, importantly, that both ctDNA and PSA were independent risk factors for shorter survival (HR, 3.63; 95% CI, 1.94–6.81 for ctDNA and HR, 5.52; 95% CI, 1.65–18.39 for PSA > 0.2 ng ml−1) (Table 2). Including patients who were ctDNA-negative with PSA ≤ 0.2 ng ml−1 as the reference group, survival was significantly shorter for those who were ctDNA-positive with PSA > 0.2 to 4 ng ml−1 (HR, 9.24; 95% CI, 1.84–46.38) and PSA >4 ng ml−1 (HR, 20.34; 95% CI, 4.06–101.90) (Fig. 4a). To illustrate the value of a combination liquid biopsy, we also compared OS for ctDNA detection in patients within PSA categories. Although for patients with PSA ≤ 0.2 ng ml−1, ctDNA detection did not associate with shorter OS, OS was significantly shorter for ctDNA-positive patients with PSA > 0.2 to 4 ng ml−1 (HR, 2.93; 95% CI, 1.16–7.40) or >4 ng ml−1 (HR, 8.08; 95% CI, 2.06–31.70) (Supplementary Table 12).
Fig. 4: Combined circulating tumor DNA and PSA.The alternative text for this image may have been generated using AI.
a, Kaplan–Meier curves for OS by ctDNA status at cycles 3 or 4 split by serum PSA categories ≤0.2 ng ml−1 (n = 22 patients), >0.2 to 4 ng ml−1 (n = 54 patients) and >4 ng ml−1 (n = 28 patients) measured at cycle 4 or, if not available at cycle 4, at cycle 3 (n = 26 of 104 patients). b, Kaplan–Meier curves for OS by ctDNA status at cycle 1 (n = 110 patients) split by serum PSA ≤ 4 ng ml−1 (n = 46 patients) or >4 ng ml−1 (n = 64 patients). Tick marks indicate censored data. c,d, Receiver operating characteristic (ROC) curve for ctDNA prediction of deaths at 12 months for cycles 3 or 4 (n = 104 patients) (c) and for cycle 1 (n = 110 patients) (d). AUC, Area under the ROC Curve.
Source data
Table 2 Multivariable analysis of ctDNA and PSA with OS
ctDNA and PSA at cycle 1
Next, we examined the combination of ctDNA and PSA at cycle 1 (110 patients). In keeping with a slower dynamic for PSA, only five out of 110 patients (5%) had PSA < 0.2 ng ml−1 at cycle 1. We therefore categorized patients by PSA > 4 ng ml−1 or PSA ≤4 ng ml−1. On multivariable analysis, PSA at cycle 1 was not associated with OS, while ctDNA was (HR 2.46; 95% CI, 1.25–4.82) (Table 2). This was independent of ctDNA at cycles 3 or 4. ctDNA detection was associated with OS both when PSA was ≤4 ng ml−1 (HR, 3.88; 95% CI, 1.29–11.62) or >4 ng ml−1 (HR, 3.54; 95% CI, 1.54–8.10) (Fig. 4b).
Dynamic improvement in survival prediction when circulating tumor DNA is combined with PSA
OS models including baseline clinical variables had a better fit when including ctDNA in addition to serum PSA (likelihood P < 0.001 for cycle 3 or 4 measurements and likelihood P = 0.012 for cycle 1 testing). We then tested the accuracy of survival prediction at 12 or 24 months after the start of treatment, chosen because all evaluable patients had follow-up of at least 24 months. Firstly, adding ctDNA to serum PSA collected at cycle 3 or 4 led to an increase in area under the curve for predicting OS at 12 months from 0.82 (95% CI, 0.68–0.95) to 0.91 (95% CI, 0.79–1.00) (Fig. 4c) and 24 months from 0.69 (95% CI, 0.57–0.82) to 0.73 (95% CI, 0.60–0.86). At cycle 1, the area under the curve for predicting OS at 12 months increased from 0.74 (95% CI, 0.58–0.91) to 0.95 (95% CI, 0.89–1.00) (Fig. 4d) and at 24 months, from 0.70 (95% CI, 0.58–0.82) to 0.74 (95% CI, 0.62–0.87).
