


CDCA-mediated tumor growth inhibition is driven by immune responses
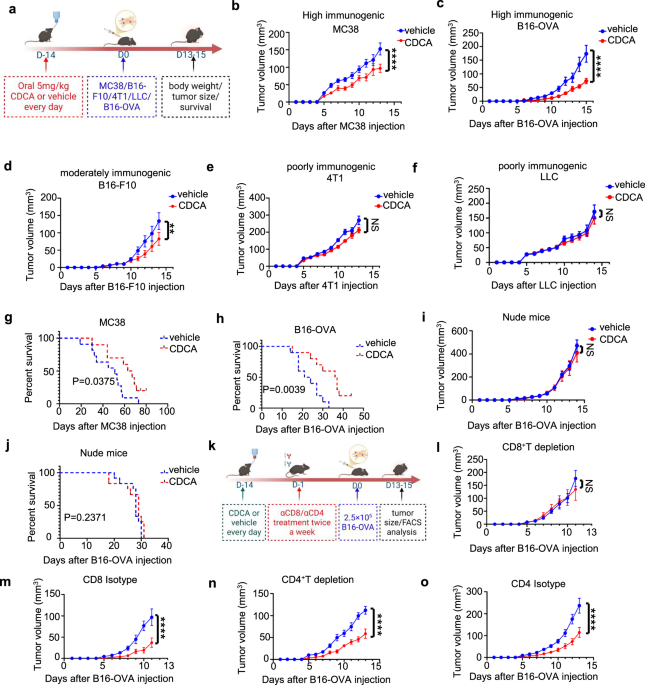
To investigate the effects of CDCA on tumor growth, C57BL/6J mice aged 6 weeks were randomized to receive either vehicle or 5 mg/kg CDCA via oral gavage to establish tumor models in mice. (Fig. 1a). Two weeks after gavage administration, no significant difference in body weight was observed between the CDCA-treated and vehicle control mice (Supplementary Fig. 1a–e). Subcutaneous tumor xenograft models were established in mice via syngeneic MC38 colon cancer cells, B16‒F10 melanoma cells, B16‒OVA melanoma cells, 4T1 breast cancer cells, or LLC Lewis lung cancer cells. Interestingly, MC38 and B16-OVA tumors, which are characterized by high immunogenicity, exhibited significantly slower growth in CDCA-treated mice than in vehicle-treated mice (P < 0.0001) (Fig. 1b, c). Similarly, moderately immunogenic B16-F10 tumors exhibited a reduced growth rate with CDCA treatment (P < 0.01) (Fig. 1d). In contrast, the growth of poorly immunogenic 4T1 and LLC tumors did not significantly differ between the CDCA-treated and vehicle groups (Fig. 1e, f). Survival analysis revealed that compared with vehicle treatment, CDCA treatment significantly prolonged survival in mice bearing MC38 and B16-OVA tumors (Fig. 1g, h). However, no significant differences in survival were observed between the CDCA-treated and vehicle groups in mice bearing B16-F10, 4T1, or LLC tumors (Supplementary Fig. 1f–h).
Fig. 1
Tumor growth and survival analysis in various mouse models. a A schematic diagram of the experimental setup for the prophylactic treatment regimen. Two weeks prior to the inoculation of 2.5 × 10⁵ B16-OVA cells, 5 × 10⁵ LLC cells, 2.5 × 10⁵ B16-F10 cells, or 2 × 10⁶ MC38 cells, BALB/c or C57BL/6J mice fed a normal chow diet were orally gavaged with the candidate agents (vehicle or 5 mg/kg CDCA) until the end of the experiment. The body weights of the mice were monitored, and tumor size measurements and survival monitoring were initiated once the tumors became detectable. Tumor growth curves of the mice inoculated with 2 × 10⁶ MC38 (b), 2.5 × 10⁵ B16-OVA (c), 2.5 × 10⁵ B16-F10 (d), 5 × 10⁵ 4T1 (e), or 5 × 10⁵ LLC (f) cells (n = 8‒12 per group). Survival curves of WT C57BL/6J mice inoculated with 2 × 10⁶ MC38 (g) or 2.5 × 10⁵ B16-OVA (h) cells (n = 8‒12 per group). i Tumor growth curves of nude mice inoculated with 2.5 × 10⁵ B16-OVA cells (n = 8–12 per group). j Survival curves of nude mice inoculated with 2.5 × 10⁵ B16-OVA cells (n = 8–12 per group). k Schematic representation of the experimental design for isotype-matched control or anti-CD8/CD4 antibody treatment. On day 0, 2.5 × 10⁵ B16-OVA cells were subcutaneously inoculated into each group of WT mice. For two weeks prior to tumor implantation, the mice were orally gavaged daily with either vehicle or 5 mg/kg CDCA. Starting the day before tumor inoculation, the mice were intraperitoneally injected twice a week with isotype or anti-CD8/CD4 antibodies (50 μg, i.p.). l‒m. Tumor growth of C57BL/6J WT mice treated with anti-CD8 antibodies (l) or isotype-matched controls (m) in combination with vehicle or CDCA (n = 8‒12 per group). Tumor growth of C57BL/6J WT mice treated with anti-CD4 antibodies (n) or isotype-matched controls (o) in combination with vehicle or CDCA, as indicated in (k) (n = 8–12 per group). The data are presented as the means ± SEMs. Statistics were analyzed by two-way ANOVA followed by the Bonferroni post hoc correction (b–f, i, l–o). Statistical analysis was performed via the two-sided log-rank test (g, h, j). (*p ≤ 0.05, **p ≤ 0.01, ***p ≤ 0.001, and ****p ≤ 0.0001; ns not significant)
To determine whether CDCA-mediated tumor inhibition is immune dependent, nude mice were injected with B16-OVA cells. The results revealed that CDCA had no effect on the body weights of the two groups of nude mice (Supplementary Fig. 1i) and did not affect tumor growth or survival (Fig. 1i, j). Additionally, to investigate whether CDCA suppresses tumor growth through T-cell-mediated immune responses, we systematically employed T-cell subset depletion strategies in a B16-OVA tumor-bearing mouse model (Fig. 1k). The experimental results revealed no CDCA-dependent changes in B16-OVA tumor growth in mice after CD8+ T-cell depletion (Fig. 1l, m, Supplementary Fig. 1j–l). CD4+ T-cell depletion reduced B16-OVA tumor growth under both conditions (Supplementary Fig. 1m–o); however, it did not eliminate the tumor growth inhibition caused by CDCA treatment (Fig. 1n, o).
Taken together, these results suggest that the impact of CDCA on tumors is linked to immune regulation. especially CD8+ T cells.
CDCA reshapes the immune microenvironment of tumors in mice
These results suggest that CDCA may play a regulatory role in tumor immunity. To understand how CDCA gavage alters the immune microenvironment of B16-OVA tumors, tumor-draining lymph nodes (tdLNs) and tumor-infiltrating immune cell populations were investigated by flow cytometry (Fig. 2a). In CDCA-treated B16-OVA tumor-bearing mice, an increase in CD45+ leukocyte infiltration within the tumor was observed (Fig. 2b). We employed the following protocol to analyze T lymphocytes (Supplementary Fig. 2a). The results of the T lymphocyte analysis revealed an increased ratio of CD8+ T cells to live cells, as well as an increase in CD3+ T cells, in both the tumor and tumor-draining lymph nodes of the CDCA-treated mice (Fig. 2c, d, Supplementary Fig. 2b, c). The ratio of CD4+ T cells to regulatory CD4+CD25+ Foxp3+ (Tregs) cells did not significantly change (Supplementary Fig. 2d, e).
Fig. 2
CDCA enhances the number and functionality of CD8+ T cells and DCs. a A schematic representation of the experimental setup for FACS analysis. Two weeks prior to the inoculation of 2.5 × 10⁵ B16-OVA cells, the mice were orally gavaged daily with either vehicle or 5 mg/kg CDCA until the end of the experiment. b The ratio of CD45+ cells to live cells (n = 6 per group). Ratios of CD8+ T cells to live cells (c) and CD3+ T cells (d) (n = 6 per group). Quantification of IFN-γ (e), TNF-α (f), GzmB (g), CD69 (h), and Ki67 (i) expression in CD8+ T cells (n = 6 per group). j The ratio of tetramer-SIINFEKL+ CD8+ T cells to live cells (n = 6 per group). k Representative flow plots (left) and the ratio of tetramer-SIINFEKL+ to CD8+ T cells (right) (n = 6 per group). l The ratio of CD3+CD8+ T cells to live cells in mice inoculated with MC38 cells (n = 7 per group). m Representative flow plots (left) and the ratio of tetramer-Adpgk+ to CD8+ T cells (right) with MC38 (n = 7 per group). n The ratio of CD11c+ dendritic cells to CD45+ cells (n = 6 per group). o Representative flow plots (left) and quantification of the percentages of CD103+ dendritic cells and CD11b+ dendritic cells among dendritic cells (right) in tumors and tumor-draining lymph nodes (tdLNs) (n = 6 per group). Mean fluorescence intensity (MFI) of CD40 (p) and H-2Kb (q) on dendritic cells in tumors and tdLNs (n = 6 per group). The data are presented as the means ± SDs. Statistical significance was determined by a two-tailed Student’s t-test. (*p ≤ 0.05, **p ≤ 0.01, ***p ≤ 0.001, and ****p ≤ 0.0001; ns not significant)
To investigate the effect of CDCA on CD8+ T cells in B16-OVA tumor-bearing mice, we analyzed markers indicative of CD8+ T-cell function and activity. CDCA treatment increased the levels of interferon gamma (IFN-γ), granzyme B (GzmB), tumor necrosis factor alpha (TNFα), CD69, and Ki67 in CD8+ T cells (Fig. 2e–i, Supplementary Fig. 2f). Confocal microscopy analysis revealed that CDCA treatment significantly increased the infiltration of Ki67+CD8+ T cells in tumor tissues (Supplementary Fig. 3a, b), suggesting that CDCA may promote the intratumoral recruitment of proliferative CD8+ T cells. The expression of PD-1, LAG-3, and CD39 on CD8+ T cells in tumors and tdLNs was comparable between the CDCA and vehicle-treated groups (Supplementary Fig. 3c). Consistent with the increase in CD8+ T cells, we further detected an elevated percentage of tetramer-SIINFEKL-specific CD8+ T cells in both the tumor and tdLN of the CDCA-treated group (Fig. 2j, k). In line with the results of the flow cytometric analysis, the immunohistochemical staining results revealed that CDCA treatment promoted massive CD8 + T-cell infiltration throughout the tumor, including both the edges and the center (Supplementary Fig. 3d, e). This finding suggested that the increased presence of CD8+ T cells within the tumor following CDCA treatment may be due to either the proliferation of cells within the tumor or an increase in the migration of peripheral cells. To validate the generalizability of the immunoregulatory effects of CDCA on CD8+ T cells, we established an MC38 tumor xenograft model for assessment. We also observed an increased percentage of CD8+ T cells (Fig. 2l) and tetramer-Adpgk-specific CD8+ T cells (Fig. 2m) following CDCA treatment, along with elevated levels of IFN-γ, GzmB, and TNFα in CD8+ T cells (Supplementary Fig. 3f–h). These results suggest that CDCA treatment leads to the activation of CD8+ T cells.
In addition to CD8+ T cells, we investigated the effects of CDCA on other immune cell populations in B16-OVA tumors, as shown in Supplementary Fig. 4a. We found that CDCA had no effect on CD3-NK1.1+ NK cells, F4/80+CD11b+ macrophages, or CD45+CD11b+Gr1+ MDSCs (Supplementary Fig. 4b–d). However, the numbers of CD11c+ cells and CD11c+MHC II+ cells were increased in tumors after CDCA treatment (Fig. 2n, Supplementary Fig. 4e). Recent studies have shown that cDC1s primarily activate CD8+ T cells, whereas cDC2s primarily promote CD4+ T cells.3,4 Therefore, we evaluated CD103+ CD11b- DCs (cDC1s) and CD103-CD11b+ DCs (cDC2s) (Supplementary Fig. 4a). The results indicated that the proportion of cDC1 cells increased in tumors following treatment with CDCA, whereas the proportion of cDC2 cells in the tumors decreased. (Fig. 2o, Supplementary Fig. 4f). We also examined DC activation markers and found that the mean fluorescence intensity (MFI) of the costimulatory molecules CD40 and MHC I (H-2Kb) was increased in tumors and tdLNs treated with CDCA (Fig. 2p, q). However, the expression levels of CD86, CD80, C-C motif chemokine receptor 7 (CCR7), and MHC II did not significantly change (Supplementary Fig. 4g–j). To refine the flow cytometry sorting strategy for the cDC1 and cDC2 subsets, we systematically analyzed DC subpopulations within the CD45+Lineage-CD11c+MHC II+ cell population (Supplementary Fig. 4k). The results demonstrated that CDCA treatment significantly increased the proportion of CD45+Lineage-CD11c+MHC II+ DCs (Supplementary Fig. 4l) and increased the frequency of cDC1s, whereas cDC2s tended to decrease in the two sorting strategies (Supplementary Fig. 4m).
These findings suggest that CD8+ T cells and cDC1s are the immune cell types most dramatically impacted by CDCA in the B16-OVA tumor microenvironment (TME).
Single-cell RNA-seq reveals CDCA modifications within tumor-infiltrating immune cell subsets
To further investigate the alterations in intertumoral immune cell populations, we performed single-cell RNA sequencing (scRNA-seq) on purified CD45+ immune cells isolated from B16-OVA tumors in mice fed either vehicle control or CDCA-supplemented diets. This approach provides unbiased and comprehensive profiling of the tumor-immune transcriptome (Fig. 3a). To delineate major cell populations, we conducted unsupervised clustering analysis on the integrated single-cell datasets from both treatment conditions, identifying 11 distinct cell clusters, all of which contained cells from both dietary groups (Fig. 3b). On the basis of the expression patterns of known genetic markers (Supplementary Fig. 5a) and immune cell signatures (Supplementary Fig. 5b), these clusters were annotated into 11 immune cell types. Comparative analysis revealed that CDCA-treated animals presented significantly increased proportions of T lymphocytes, circulating T cells, and natural killer (NK) cells, whereas the relative abundance of dendritic cell (DC) populations remained unchanged (Fig. 3c, d).
Fig. 3
scRNA-seq reveals CDCA modifications within tumor-infiltrating immune cell subsets. a Schematic overview of the single-cell RNA-sequencing (scRNA-seq) experimental design and analytical workflow. b Identification of tumor-infiltrating immune cell populations. Uniform manifold approximation and projection (UMAP) visualization of integrated scRNA-seq profiles from all cells, with 11 distinct cell types identified through integrative analysis (color-coded by cell type). c Comparative UMAP visualization of immune cell populations derived from vehicle-treated and CDCA tumor samples. d Quantitative analysis of leukocyte infiltration patterns. The bar plot shows proportional differences in immune cell subsets, including T cells, NK cells, macrophages, neutrophils, DCs, B cells, and plasmacytoid DCs (pDCs), mast cells, monocytes, cycling T cells, cycling macrophages, and cycling DCs (as identified in c), between vehicle-treated and CDCA-treated tumors. Differential gene expression analysis of tumor-infiltrating T cells (e) and cycling T cells (f). Volcano plots comparing the transcriptional profiles between vehicle-treated and CDCA-treated tumors (log₂-fold change vs. −log₁₀ p-value). g Gene Ontology (GO) enrichment analysis of biological process (BP) terms associated with genes significantly upregulated in CDCA tumor-infiltrating T cells. h Comparative UMAP visualization of CD8+ T-cell populations derived from vehicle-treated and CDCA tumor samples. i Stacked bar charts representing the relative proportions of CD8+ T-cell subsets, including TEML, Transitory CD8+ T, Intermediate CD8+ T, Terminal CD8+ T, Proliferative CD8+ T, and CD8+ T _IFN subsets, between vehicle and CDCA conditions. Differential gene expression analysis of tumor-infiltrating DCs (j) and cycling DCs (k). Volcano plots displaying transcriptional differences between vehicle-treated and CDCA tumor conditions. l Gene Ontology (GO) enrichment analysis of biological process (BP) terms associated with the significantly upregulated genes in CDCA tumor-infiltrating DCs. m UMAP visualization of DC clusters isolated from vehicle-treated (left) and CDCA-treated (right) samples. n Quantitative analysis of the proportional distributions of DC subsets, including classic cDC1s, MregDCs, cDC2s, ISG+ DCs, proliferative DCs, and pDCs, across the two experimental groups. o Schematic diagram of the CDCA/vehicle and FTY720/DMSO treatment regimens. On day 0, 2.5 × 10⁵ B16-OVA cells were subcutaneously inoculated into each group of WT mice. For two weeks prior to tumor implantation, the mice were orally gavaged daily with either vehicle or 5 mg/kg CDCA. Starting the day before tumor inoculation, the mice were intraperitoneally injected every other day with either dimethyl sulfoxide (DMSO) or FTY720 (1 mg/kg) until the end of the experiment. p Tumor growth curves of C57BL/6J WT mice treated with vehicle or CDCA in combination with DMSO or FTY720, as indicated in (k) (n = 8‒12 per group). q Tumor growth curves of C57BL/6J WT mice treated with isotype-matched control or anti-CD11c antibodies in combination with vehicle or CDCA, as indicated in panel c of Supplementary Fig. 6c (n = 8–12 per group). r Tumor growth curves of C57BL/6J WT and Batf3-/- mice treated with vehicle or 5 mg/kg CDCA (n = 8–12 per group). The data are presented as the means ± SEMs. Statistics were analyzed by two-way ANOVA followed by the Bonferroni post hoc correction (q, r). (*p ≤ 0.05, **p ≤ 0.01, ***p ≤ 0.001, and ****p ≤ 0.0001; ns not significant)
Transcriptomic analysis of T-cell and circulating T-cell populations further demonstrated that CDCA-treated mice presented upregulated CD8a expression without significant changes in CD4 levels. Notably, tumor-infiltrating T cells from CDCA-treated mice exhibited marked upregulation of genes encoding T-cell activation markers (e.g., Cd69 and ICOS), effector molecules (GzmB, FasL, and Prf1), and chemokine receptors (CXCR6) (Fig. 3e, f). Pathway enrichment analysis revealed that genes upregulated in CDCA-treated tumor-infiltrating T cells were involved primarily in transcriptional regulation, mRNA splicing and processing, and T-cell differentiation, all of which are associated with innate and adaptive immunity (Fig. 3g). These findings suggest that CDCA treatment promotes the accumulation of a more antitumorigenic CD8+ T-cell population within the TME. To characterize the CDCA-induced CD8+ T-cell landscape at single-cell resolution, we performed scRNA-seq on CD8+ T cells. UMAP visualization revealed distinct clustering patterns between the vehicle- and CDCA-treated groups for both lineages (Fig. 3h). Within the CD8+ T-cell compartment, CDCA treatment led to a marked expansion of the proliferative CD8+ T-cell population and a contraction in the relative proportion of the TEML (T effector memory-like) population following CDCA treatment (Fig. 3i). These data suggest that CDCA may drive the mobilization of memory-like T cells, facilitating their differentiation into active effector states characterized by enhanced proliferative capacity and cytolytic function.
Subsequent transcriptomic profiling of DC populations (Fig. 3j) and circulating DC subsets (Fig. 3k) revealed that CDCA-treated mice presented increased expression of transcription factors linked to cDC1 development (Clec9a, IRF8) but reduced expression of those associated with cDC2 differentiation (IRF4). Additionally, the expression of chemokines that recruit CD8+ T cells (CXCL9 and CXCL10), the chemokine receptor XCR1 (critical for DC-CD8+ T-cell interactions), antigen presentation-related genes (H2-K1), and cytokines that enhance CD8+ T-cell activation (IL-2) was upregulated in CDCA-treated mice (Fig. 3j, k). Gene Ontology (GO) enrichment analysis revealed that the upregulated genes in DCs were predominantly involved in the interferon response and antigen presentation pathways (Fig. 3l). Similarly, the DC landscape underwent significant remodeling (Fig. 3m). Notably, the proportion of classic cDC1s, which are essential for antigen cross-presentation, substantially increased following CDCA administration, whereas the relative frequencies of MregDCs and cDC2s were altered (Fig. 3n). These findings suggest that CDCA promotes a transition toward a more activated and immunogenic microenvironment characterized by enhanced cDC1 recruitment and CD8+ T-cell proliferation.
To address this, we first sought to determine whether CDCA treatment enhances the recruitment of CD8+ T cells into tumors from lymphoid organs. We used fingolimod (FTY720), a functional antagonist of the S1P1 receptor,18 to block the egress of T cells from lymphoid organs (Fig. 3o). As expected, FTY720 treatment dramatically reduced the number of CD45+ and CD8+ T cells in the peripheral blood (Supplementary Fig. 5c, d). The B16-OVA tumor progression results showed that FTY720 administration promoted tumor growth but did not completely abrogate the inhibitory effect of CDCA treatment (Fig. 3p). Although FTY720 treatment reduced the infiltration of CD45+ cells, CD8+ T cells, and CD11c+MHC II+ DCs in tumors, it did not affect the CDCA-induced increase in these immune cells (Supplementary Fig. 5e–g). Confocal images of cDC1s were consistent with the results of the flow cytometric analysis (Supplementary Fig. 6a, b). These results indicate that the inhibition of tumor growth by CDCA treatment is associated with both the egress of immune cells from lymphoid organs and the presence of immune cells in tumors.
To investigate whether the reduced growth rates of B16-OVA tumors in CDCA-treated mice were due to DC cells, vehicle- and CDCA-treated mice were subcutaneously inoculated with B16-OVA cells and administered either an anti-CD11c antibody or an isotype-matched control antibody (IgG) (Supplementary Fig. 6c, d). Although the growth rate of B16-OVA tumors remained reduced in CDCA-treated mice injected with anti-IgG, CDCA treatment failed to affect tumor growth rates when anti-CD11c antibodies were administered (Fig. 3q). Accordingly, CDCA did not affect the ratio of CD3+CD8+ T cells or tetramer-SIINFEKL+CD8+ T cells to live cells after anti-CD11c antibody treatment (Supplementary Fig. 6e, f). Similarly, the levels of IFN-γ, GzmB, and TNF-α in CD8+ T cells followed the same trend (Supplementary Fig. 6g). Moreover, to elucidate the critical role of cDC1s in CDCA-mediated antitumor immunity, we generated Batf3−/− mice lacking cDC1s19 (Supplementary Fig. 6h–j). Consistent with previous findings, compared with vehicle treatment, CDCA treatment decelerated the growth of B16-OVA tumors in WT mice. However, this antitumor effect was completely abrogated in Batf3−/− mice (Fig. 3r). Furthermore, the increase in the proportions of SIINFEKL-H-2Kb complex-specific CD8+ T cells and effector CD8⁺ T cells observed after CDCA treatment in WT mice was not detected in Batf3−/− mice (Supplementary Fig. 6k‒m). These findings conclusively demonstrate that the antitumor effect of CDCA strongly depends on the presence of cDC1s.
Taken together, these data provide evidence that CDCA decreases B16-OVA tumor growth by limiting antitumor CD8+ T-cell and cDC1 cell responses.
CDCA regulates tumors independently of the gut microbiota
Upon entering the intestine, CDCA can be metabolized by the gut microbiota into other secondary bile acids, which may mediate its effects.20,21 To investigate whether CDCA exerts its biological effects through modulation of the gut microbiota, we initially performed 16S rRNA gene sequencing analysis on fecal samples collected from CDCA-gavaged and vehicle control mice prior to tumor inoculation. Alpha diversity analysis, including the number of operational taxonomic units and the inverse Simpson index, revealed that CDCA treatment did not significantly alter microbial richness or diversity (Supplementary Fig. 7a). However, principal component analysis (PCA) demonstrated that CDCA treatment significantly modified the β diversity of the microbial community (Fig. 4a), suggesting that CDCA may influence the overall structural composition of the gut microbiota. Despite these structural changes, CDCA treatment did not significantly affect the relative abundance of major phyla, including Bacillota, Bacteroidota, and Verrucomicrobiota (Supplementary Fig. 7b, c). Genus-level analysis revealed that CDCA treatment primarily increased the abundance of Akkermansia (Fig. 4b, c).
Fig. 4
CDCA regulates tumors independently of the gut microbiota. a Principal component analysis (PCA) of the gut microbiota of vehicle-treated and CDCA-treated mice (n = 5 per group). b Relative abundances of gut commensal microorganisms at the genus level in vehicle-treated and CDCA-treated mice (n = 5 per group). c Relative abundances of norank_f__Muribaculaceae, Ligilactobacillus, Allobaculum, Akkermansia and Lactobacillus (n = 5 per group). d A schematic diagram illustrating the experimental design for the intestinal microbiota depletion tumor model. Starting 21 days before the inoculation of 2.5 × 10⁵ B16-OVA cells, the mice were orally gavaged daily with ABX for 7 days. For the 14 days prior to tumor implantation, the mice were gavaged with ABX twice a week and 5 mg/kg CDCA daily until the end of the experiment. e Principal component analysis (PCA) of the gut microbiota of ABX-treated mice (n = 8–12 per group). f Relative abundances of gut commensal microorganisms at the genus level in vehicle, CDCA, ABX-vehicle, and ABX-CDCA mice (n = 5 per group). g Tumor growth curves of mice inoculated with 2.5 × 10⁵ B16-OVA cells and treated with ABX (n = 8–12 per group). h On the day of tumor inoculation with either 2.5 × 10⁵ B16-OVA cells or 2 × 10⁶ MC38 cells, C57BL/6J mice maintained on a standard diet were commenced via oral gavage with vehicle or CDCA (10 mg/kg) and maintained on treatment until study termination. i B16-OVA tumor growth curves of mice treated with vehicle or CDCA (10 mg/kg). j MC38 tumor growth curves of mice treated with vehicle or CDCA (10 mg/kg). The data are presented as the means ± SEMs. Statistics were analyzed by two-way ANOVA followed by the Bonferroni post hoc correction (g, i, j). Statistical analysis was performed via the two-sided log-rank test (c). (*p ≤ 0.05, **p ≤ 0.01, ***p ≤ 0.001, and ****p ≤ 0.0001; ns not significant)
To determine whether the gut microbiota mediates the antitumor effects of CDCA, we established pseudogerm-free mice through broad-spectrum antibiotic mixture (ABX) treatment followed by B16-OVA melanoma cell inoculation (Fig. 4d). Microbiological culture and 16S rRNA sequencing of fecal samples collected before and after ABX treatment confirmed successful microbiota depletion: plate culture completely eliminated cultivable bacteria (Supplementary Fig. 7d); sequencing analysis revealed significantly reduced microbial richness and diversity (Supplementary Fig. 7e); PCA demonstrated a complete loss of microbiota structural features (Fig. 4e); and there was a marked reduction in the relative abundance of dominant taxa, including norank_f__Muribaculaceae, Allobaculum, and Akkermansia (Fig. 4f, Supplementary Fig. 7f-g). Importantly, under complete microbiota depletion conditions, CDCA still significantly inhibited tumor growth (Fig. 4g) and promoted the infiltration of CD3+ CD8+ T cells and SIINFEKL-H-2Kb complex-specific CD8+ T cells (Supplementary Fig. 7h). These results strongly suggest that the antitumor effects of CDCA may not depend on gut microbiota modulation.
On the basis of these findings, we hypothesized that CDCA might directly target tumors. To test this hypothesis, we administered CDCA treatment after tumor implantation (Fig. 4h). The results showed that CDCA significantly suppressed the growth of both B16-OVA melanoma (Fig. 4i) and MC38 colon carcinoma (Fig. 4j) cells. Flow cytometry analysis further demonstrated that CDCA treatment significantly increased the number of tumor-infiltrating CD8+ T cells (Supplementary Fig. 7i), including both the Tetramer-SIINFEKL-specific and the Tetramer-Adpgk-specific CD8+ T-cell populations (Supplementary Fig. 7j). These results collectively indicate that the antitumor effects of CDCA in mouse transplantation tumor models are mediated primarily through direct biological actions rather than through indirect modulation of the gut microbiota.
TCDCA is enriched within the tumor interstitial fluid and directly inhibits tumor growth
Tumor interstitial fluid (TIF) constitutes the local perfusate of the tumor microenvironment (TME), exerting a significant influence on immune cell function and behavior within tumors.22,23 To investigate whether CDCA treatment regulates antitumor immunity by affecting the composition of metabolites in mice, plasma and TIF were collected 24 h after treatment with vehicle or CDCA for untargeted metabolomics analysis. Partial least squares discriminant analysis (PLS-DA) revealed significant differences in the plasma and TIF metabolite profiles between the vehicle and CDCA treatment groups (Fig. 5a, b). Bile acids (BAs) are classified into primary and secondary types. Primary BAs include cholic acid (CA) and chenodeoxycholic acid (CDCA) in humans and CA and muricholic acid (MCA) in mice.21,24 These BAs are conjugated with glycine or taurine (taurine predominates in mice). Approximately 90–95% of BAs are reabsorbed via enterohepatic circulation, whereas the remaining 5% are metabolized by gut bacteria into secondary BAs.25,26,27 Previous studies have shown that oral CDCA is absorbed by the intestine, extracted by the liver, conjugated with glycine and taurine, secreted into bile, and undergoes enterohepatic circulation with endogenous bile acids28 (Fig. 5c). Metabolic analyses revealed no significant differences in plasma primary BAs between the vehicle- and CDCA-treated groups (Supplementary Fig. 8a). The conjugated bile acid TCDCA significantly increased the TIF after CDCA treatment for 24 h (Fig. 5d). There were no differences in the composition of secondary bile acids in both the plasma and TIF between the vehicle- and CDCA-treated groups (Supplementary Fig. 8b, c). Additional analyses revealed elevated levels of pyruvate, D-sphingosine, and cortisol in the CDCA group, indicating that glucose and lipid metabolism pathways in plasma were impacted (Supplementary Fig. 8d–f). An increase in purine metabolites, such as xanthine, was also observed, suggesting alterations in the purine metabolism pathway in TIFs (Supplementary Fig. 8g–i). The observed increase in these metabolites may be attributed to the effects of CDCA following oral administration, which affects both brown and white adipose tissues through the TGR5 or farnesoid X receptor (FXR) signaling pathways. This interaction subsequently facilitates lipolysis, enhances mitochondrial function, and elevates energy expenditure, thereby significantly augmenting systemic glucose and lipid metabolism and amino acid metabolism.29,30,31,32
Fig. 5
TCDCA is enriched within the tumor interstitial fluid and directly inhibits tumor growth. a Partial least squares discriminant analysis (PLS-DA) of negative metabolites from TIFs and plasma in animals fed CDCA or vehicle (n = 6 per group). b PLS-DA of positive metabolites from the TIF and plasma of animals fed CDCA or vehicle (n = 6 per group). c Schematic diagram illustrating bile acid metabolism in mice. d Primary bile acid levels in TIFs from tumor-bearing mice fed CDCA or vehicle (n = 6 per group). e Schematic of the CDCA pharmacokinetic study. The mice were administered 10 mg/kg CDCA-d4 by oral gavage. Plasma, TIF, feces, and liver samples were collected at 1, 12, and 24 h post-dose and analyzed by LC–MS/MS. f Schematic of the in vivo metabolism of d4-labeled bile acids. After oral administration, CDCA-d4 undergoes 6β-hydroxylation to form α-MCA-d4, which is subsequently conjugated to Tα-MCA-d4. Interconversion between LCA-d4 and UDCA-d4 is mediated by 7α-dehydrogenase (7α-DH) and 7α/7β-hydroxysteroid dehydrogenases (7α/7β-HSDH). Free bile acids (LCA-d4, UDCA-d4, and CDCA-d4) are further converted to their taurine conjugates (TLCA-d4, TUDCA-d4, and TCDCA-d4). The solid blue arrows denote the reaction direction; the dotted arrows indicate putative or microbiota-dependent steps. g LC–MS/MS settings for targeted quantification of d4-labeled bile acids. Multiple-reaction monitoring (MRM) transitions, retention times (RT, min), and ion modes used to quantify CDCA-d4, TCDCA-d4, LCA-d4, TLCA-d4, UDCA-d4, TUDCA-d4, α-MCA-d4, and Tα-MCA-d4 are listed in the table. Concentrations of CDCA-d4 (h) and TCDCA-d4 (i) in the liver, plasma, feces, and TIF at 1, 12, and 24 h after dosing. The data are the means ± SDs. “N/A” indicates not detected or below the limit of detection (LOD). j On the day of tumor inoculation with either 2.5 × 10⁵ B16-OVA cells or 2 × 10⁶ MC38 cells, C57BL/6J mice maintained on a standard diet were subjected to oral gavage administration of candidate treatments (vehicle control or 10 mg/kg TCDCA), which continued throughout the experimental period until termination. k B16-OVA tumor growth curves of mice treated with vehicle or TCDCA (10 mg/kg). l MC38 tumor growth curves of mice treated with vehicle or TCDCA (10 mg/kg). The graphs display the means ± SDs (d) or means ± SEMs (k, l). Statistics were analyzed via two-way ANOVA followed by the Bonferroni post hoc correction (k, l). Statistical analysis was performed via the two-sided log-rank test (d). (*p ≤ 0.05, **p ≤ 0.01, ***p ≤ 0.001, and ****p ≤ 0.0001; ns not significant)
To comprehensively delineate the pharmacokinetics of orally administered chenodeoxycholic acid (CDCA) and its enrichment within tumors, we conducted a stable-isotope tracing study in B16-OVA tumor-bearing mice 14 days after implantation, administering a single gavage dose of CDCA-d4 (10 mg/kg) and collecting plasma, liver, tumor, and fecal samples at 1, 12, and 24 h. (Fig. 5e). Prior work has shown that oral CDCA remodels the hepatic bile acid pool in mice—including CDCA, TCDCA, lithocholic acid (LCA), taurolithocholic acid (TLCA), ursodeoxycholic acid (UDCA), tauroursodeoxycholic acid (TUDCA), α-muricholic acid (α-MCA), and tauro-α-muricholic acid (Tα-MCA)33,34,35—we propose an in vivo metabolic map for CDCA (Fig. 5f) and establish a quantitative LC–MS/MS (MRM) assay using authentic standards to define characteristic spectra (Supplementary Fig. 9a), retention times, ionization modes, m/z transitions (Fig. 5g) and calibration curves (Supplementary Fig. 9b) for each analyte.
Following dosing, CDCA-d4 was rapidly absorbed in plasma (1 h: 3.09 ± 1.01 ng/mL), maintained for a period of time (12 h: 4.02 ± 1.64 ng/mL), and decreased to below the limit of quantification by 24 h. Hepatic amounts were modest (1 h: 3.10 ± 0.87 ng/mL; 12 h: 1.40 ± 0.41 ng/mL; 24 h: 1.60 ± 0.42 ng/mL), whereas fecal amounts increased consistently with hepatobiliary elimination and enterohepatic recirculation (12 h: 110.95 ± 41.77 ng/mL; 24 h: 3.90 ± 1.36 ng/mL). In the TIF, CDCA-d4 was detectable at 1 h (1.26 ± 0.10 ng/mL) but became undetectable thereafter (Fig. 5h). In contrast, the principal conjugate TCDCA-d4—formed via hepatic taurine conjugation—showed high and sustained hepatic exposure (1 h: 72.53 ± 65.17 ng/mL; 12 h: 96.72 ± 41.54 ng/mL; 24 h: 75.87 ± 19.45 ng/mL), low-to-moderate plasma levels (1 h: 1.49 ± 0.88 ng/mL; 12 h: 1.87 ± 1.51 ng/mL; 24 h: 2.48 ± 2.32 ng/mL), measurable fecal excretion (1 h: 12.83 ± 8.50 ng/mL; 24 h: 16.84 ± 2.25 ng/mL), and notably sustained accumulation within the TIF (1 h: 2.69 ± 0.88 ng/mL; 12 h: 5.56 ± 1.32 ng/mL; 24 h: 1.42 ± 0.20 ng/mL), indicating prolonged interstitial residency relative to systemic compartments (Fig. 5i).
For minor metabolites, UDCA-d4 (epimerization product) was detectable in the liver (1 h: 1.15 ± 0.83 ng/mL; 12 h: 3.58 ± 1.00 ng/mL; 24 h: 4.58 ± 0.37 ng/mL) and feces (1 h: 2.16 ± 0.47 ng/mL; 12 h: 10.76 ± 2.28 ng/mL; 24 h: 16.84 ± 6.75 ng/mL) but not in the plasma or TIF. The taurine conjugate TUDCA-d4 was present at relatively low concentrations, with liver concentrations of 14.26 ± 12.36 ng/mL (1 h), 11.39 ± 6.83 ng/mL (12 h), and 5.42 ± 0.29 ng/mL (24 h); plasma concentrations of 0.94 ± 0.37 ng/mL (1 h), 0.55 ± 0.42 ng/mL (12 h), and 1.60 ± 0.82 ng/mL (24 h); feces concentrations of 2.19 ± 1.00 ng/mL (1 h), 4.67 ± 2.14 ng/mL (12 h), 5.20 ± 2.60 ng/mL (24 h); and TIF concentrations of 0.74 ± 0.43 ng/mL (1 h), 0.75 ± 0.40 ng/mL (12 h), and 0.10 ± 0.08 ng/mL (24 h); in contrast, LCA-d4, TLCA-d4, α-MCA-d4, and Tα-MCA-d4 were below the limit of quantification under our conditions (Supplementary Fig. 10a–f). Collectively, these data establish that CDCA-d4 is rapidly absorbed, extensively metabolized in the liver, and eliminated primarily via the fecal route, whereas its major metabolite TCDCA-d4 is persistently exposed in the tumor interstitium, supporting a model in which hepatobiliary cycling and tumor-specific transport/clearance constraints permit local retention with potential implications for immune modulation within the tumor microenvironment.
Consistent with this finding, oral TCDCA (10 mg/kg) reduced tumor growth in both the B16-OVA and MC38 models (Fig. 5j–l) and was associated with increased infiltration of total and antigen-specific intratumoral CD8⁺ T cells (Supplementary Fig. 10g, h), suggesting that sustained interstitial TCDCA-level exposure may contribute to enhanced antitumor immunity.
CDCA suppresses tumor growth via the antigen-specific immunity of cDCs
The results demonstrated that TCDCA levels were elevated in TIFs, along with increases in CD8+ T cells and cDC1s in vivo, prompting us to further explore the role of TCDCA in subsequent analyses. Reports in the literature indicate that the physiological concentration of bile acid (BA) in the portal vein of humans and mice ranges from 10 to 80 μM and from 2 to 10 μM in the peripheral circulation.36 BA concentrations can reach approximately 100 μM in the tumor interstitial fluid of liver cancer patients.37 Therefore, we used concentrations up to 100 μM for our study. First, we investigated whether TCDCA affects the activation of naive splenic CD8+ T cells ex vivo following stimulation with anti-CD3/anti-CD28 antibodies. Our findings revealed no significant differences in proliferation, IFN-γ expression, GzmB expression, or TNFα expression in CD8+ T cells after TCDCA treatment (Supplementary Fig. 11a, b). Next, we examined whether TCDCA altered the activation of OT-I naive splenic CD8+ T cells ex vivo after stimulation with 5 mg/ml or 0.5 mg/ml OVA257–264 peptide. The results indicated that TCDCA treatment did not affect the proliferation or cytotoxicity of OT-I naive splenic CD8+ T cells (Supplementary Fig. 11c, f). Overall, these results suggest that TCDCA does not modulate the function of CD8+ T cells.
We further induced cDC1s from bone marrow-derived cDC1s (Supplementary Fig. 12a) to examine their differentiation after TCDCA treatment. Cell viability assays and LDH release tests indicated that TCDCA had no cytotoxic effects at concentrations less than 100 μM ex vivo (Supplementary Fig. 12b–e). Consequently, we investigated the effects of TCDCA at 0 μM, 5 μM, 10 μM, and 50 μM. The results revealed no significant differences in the expression of immune costimulatory molecules (CD80, CD86, and CD40), MHC II, MHC I (H-2Kb), or CCR7 between the TCDCA-treated cells and the control (0 μM) cells after 6 h of treatment (Supplementary Fig. 12f–h). cDC1s were cocultured with OVA-FITC antigen for 6 h to assess antigen uptake, and we found that 50 μM TCDCA treatment ex vivo significantly increased OVA-FITC uptake (Fig. 6a, Supplementary Fig. 12i). Additionally, antigen presentation by SIINFEKL was also enhanced by 50 μM TCDCA treatment (Fig. 6b, Supplementary Fig. 12j). This phenomenon may be attributed to the enhanced endocytic activity of cDC1s subsequent to treatment with TCDCA, which consequently augments their capacity for antigen uptake and presentation.38 When cDC1s were treated with TCDCA for 24 h ex vivo, MHC I (H-2Kb) expression was upregulated with increasing TCDCA concentrations (Fig. 6c), whereas CD80, CD86, CD40, MHC II, and CCR7 expression remained unchanged (Supplementary Fig. 12k–m). Antigen uptake and antigen presentation by SIINFEKL were also enhanced with increasing concentrations of TCDCA (Fig. 6d, e). Next, we investigated whether cDC1s treated with TCDCA could activate CD8+ T cells. cDC1s were treated with TCDCA for 24 h and cocultured with OT-I naive splenic CD8+ T cells ex vivo. The proliferation of OT-I CD8+ T cells (Fig. 6f), as well as the production of IFN-γ, GzmB, and TNFα, was greater than that of the corresponding control (0 μM) T cells (Fig. 6g). These results indicated that TCDCA treatment enhanced MHC I (H-2Kb) expression, along with antigen uptake and the cross-presentation ability of cDC1s, thereby promoting the proliferation and effector functions of CD8+ T cells when they were coincubated with cDC1s.
Fig. 6
TCDCA promotes antigen cross-presentation in cDC1s. MFI of OVA-FITC (a) and H-2Kb bound to SIINFEKL (b) in cDC1s treated with 0 μM, 5 μM, 10 μM, or 50 μM TCDCA for 6 h (n = 3 per group). c Representative flow plots (left) and MFI of H-2Kb (right) in cDC1s treated with 0 μM, 5 μM, 10 μM, or 50 μM TCDCA for 24 h (n = 3 per group). Representative flow plots (d, left) and MFI of OVA-FITC (d, right) and representative flow plots (e, left) and MFI of H-2Kb bound to SIINFEKL (e, right) in cDC1s treated with 0 μM, 5 μM, 10 μM, or 50 μM TCDCA for 24 h (n = 3 per group). f Representative flow plots (left) and the ratio of proliferation in OT-I CD8+ T cells (right) cocultured with cDC1s treated with 0 μM, 5 μM, 10 μM, or 50 μM TCDCA for 24 h and incubated with OVA overnight. g Quantification of IFN-γ, TNFα, and GzmB expression in CD8+ T cells (n = 3 per group). h Schematic representation of the experimental design for isotype-matched control or anti-MHC I (H-2Kb) and MHC I-SIINFEKL peptide antibody treatment. On day 0, 2.5 × 10⁵ B16-OVA cells were subcutaneously inoculated into each group of WT mice. For two weeks prior to tumor implantation, the mice were orally gavaged daily with either vehicle or 5 mg/kg CDCA. Starting the day before tumor inoculation, the mice were intraperitoneally injected twice a week with isotype or anti-MHC I (H-2Kb) and MHC I-SIINFEKL peptide antibodies (250 μg, i.p.). i Tumor growth curves of C57BL/6J WT mice treated with vehicle or CDCA in combination with IgG2b or MHC I (H-2Kb) antibodies (n = 8–12 per group). j The ratio of CD3+ CD8+ T cells (left) and tetramer-SIINFEKL+ to CD8+ T cells (right) in tumors treated with vehicle or CDCA in combination with IgG2b or MHC I (H-2Kb) antibodies (n = 7 per group). k Quantification of IFN-γ, GzmB, and TNF-α expression in CD8+ T cells treated with vehicle or CDCA in combination with IgG2b or MHC I (H-2Kb) antibodies (n = 7 per group). l Tumor growth curves of C57BL/6J WT mice treated with vehicle or CDCA in combination with the IgG1 or MHC I-SIINFEKL peptide antibody, as indicated in (i) (n = 8–12 per group). m The ratio of CD3+ CD8+ T cells (left) and tetramer-SIINFEKL+ to CD8+ T cells (right) in tumors treated with vehicle or CDCA in combination with IgG1 or MHC I-SIINFEKL peptide antibodies (n = 7 per group). n Quantification of IFN-γ, GzmB, and TNFα expression in CD8+ T cells treated with control or CDCA in combination with the IgG1 or MHC I-SIINFEKL peptide antibody (n = 7 per group). Statistical significance was assessed by Student’s t-test (a‒g, j, k, m, n), two-way ANOVA followed by the Bonferroni post hoc correction (i‒l), and the graphs display the means ± SDs (a‒g, j, k, m, n) or means ± SEMs (i‒l). (*p ≤ 0.05, **p ≤ 0.01, ***p ≤ 0.001, and ****p ≤ 0.0001; ns not significant)
Since TCDCA enhances MHC I (H-2Kb) expression, antigen uptake, and antigen presentation, we hypothesized that the reduced growth rates of tumors in CDCA-treated mice are mediated by MHC I (H-2Kb). To test this hypothesis, we used an anti-MHC I (H-2Kb) antibody or an isotype-matched control antibody (IgG2a) to block MHC I in B16-OVA tumor-bearing mice (Fig. 6h). The results showed that depletion of MHC I (H-2Kb) eliminated tumor growth suppression in CDCA-treated mice (Fig. 6i). The proportions of CD8+ T cells, tetramer-SIINFEKL+CD8+ T cells (Fig. 6j), and cytokines produced by CD8+ T cells (Fig. 6k) were significantly lower in MHC I (H-2Kb)-blocked mice than in IgG2a-injected control mice. However, no significant differences in these metrics were detected between the CDCA- and vehicle-treated groups of MHC I (H-2Kb)-blocked mice. Additionally, we used an antibody specific to the SIINFEKL peptide (OVA residues 257–264) (MHC I-SIINFEKL) along with an isotype-matched control antibody (IgG1) in B16-OVA tumor-bearing mice treated with CDCA and vehicle (Fig. 6h). Consistent with the anti-MHC I (H-2Kb) antibody results, blocking MHC I-SIINFEKL abolished the differences in tumor growth (Fig. 6l), the ratio of CD8+ T cells to tetramer-SIINFEKL+CD8+ T cells (Fig. 6m), and the levels of IFN-γ, GzmB, and TNFα in CD8+ T cells (Fig. 6n) between CDCA- and vehicle-treated mice. Collectively, these findings demonstrate that the CDCA-induced suppression of B16-OVA tumor growth is dependent on the antigen-specific immunity of DCs.
TCDCA promotes MHC I expression in a TGR5-dependent manner
MHC class I expression is an essential function, and its modulation may involve multiple mechanisms. To elucidate the mechanism by which TCDCA induces MHC I (H-2Kb) expression in cDC1s, we performed RNA sequencing (RNA-seq) on cDC1s treated with TCDCA or vehicle. CDC1 cells treated with TCDCA in vitro exhibited extensive changes in signal transduction and immune system-related signaling pathways (Supplementary Fig. 13a). KEGG enrichment analysis was performed on these two types of gene sets, selecting pathways with P-values < 0.05 and Padjust < 0.05. The analysis revealed significant differences between vehicle- and TCDCA-treated cDC1s. Treatment of cDC1 cells with TCDCA primarily altered the expression of genes associated with Th1 (CD4+IFNγ+), Th2 (CD4+IL4+), and Th17 (CD4+IL17A+) cell differentiation (Fig. 7a). However, oral administration of CDCA or TCDCA did not significantly change the proportions of Th1, Th2, or Th17 cells within tumor tissues (Supplementary Fig. 13b, c). Furthermore, when we cocultured bone marrow-derived cDC1s from Batf3−/− and WT mice with OT-I naive CD8+ T cells, Batf3−/− cDC1s, compared with WT cDC1s, failed to efficiently stimulate OT-I naive CD8+ T-cell proliferation (Supplementary Fig. 13d), indicating that Batf3−/− cDC1s were defective in an assay for the cross-presentation of cellular antigens to CD8+ T cells. Treatment of Batf3−/− cDC1s with varying concentrations of the TCDCA OT-I did not alter CD8+ T‑cell proliferation (Fig. 7b). These findings suggest that the observed effects may be linked to the activation of antigen processing and presentation pathways (in the immune system) (Fig. 7a). Additionally, pathways associated with MHC I regulation, such as the JAK-STAT and NF-kappa B signaling pathways, were altered (in signal transduction)39,40,41 (Fig. 7c). RNA sequencing confirmed the upregulation of MHC class I genes (H-2K2, H-2D1, H-2M2, H-2T24) and MHC I-related protein 2 (Mill2) and the change in transcription factors (Nfya, Ciita) (Fig. 7d). We also observed an enrichment of lysosomes (Supplementary Fig. 13e) and changes in proteasome subunits (Supplementary Fig. 13f) associated with antigen processing at the RNA level following TCDCA treatment, which is consistent with the flow cytometry results previously reported (Fig. 6b–e). To validate the RNA-sequencing results, we further investigated the expression of the MHC I gene (H-2K1) in cDC1s treated with or without TCDCA. Notably, treatment with TCDCA for 24 h resulted in the upregulation of H-2K1 mRNA expression (Supplementary Fig. 13g), which was confirmed at the protein level via Western blotting (Fig. 7e). However, no changes were observed in the antigen-processing machinery (APM) (e.g., B2M, TAP1, TAP2, TAPBP, or NLRC5). These results indicate that TCDCA upregulates MHC I expression in cDC1s and affects antigen processing and presentation through a TAP-independent mechanism.42,43
Fig. 7
TCDCA-mediated regulation of MHC I expression is associated with TGR5. a KEGG pathway enrichment analysis results for the immune system, ranked by Padjust < 0.05 and P-value < 0.05 from smallest to largest. Red indicates pathways enriched in upregulated genes, whereas blue indicates pathways enriched in downregulated genes. b The ratio of proliferation in OT-I CD8+ T cells cocultured with Batf3−/− cDC1s treated with 0 μM, 5 μM, 10 μM, or 50 μM TCDCA for 24 h and incubated with OVA overnight. c KEGG pathway enrichment analysis revealed that signal transduction was associated with Padjust < 0.05 and P-value < 0.05 from smallest to largest. Red indicates pathways enriched in upregulated genes, whereas blue indicates pathways enriched in downregulated genes. d Heatmap illustrating the RNA-level expression of MHC class I genes and transcription factors following TCDCA treatment. e cDC1 cells were treated with TCDCA at the indicated concentrations (0, 5, 10, and 50 μM) for 6 h and 24 h, respectively. MHC I protein expression was then analyzed via Western blotting. f ELISA detection of cAMP levels in cell supernatants after TCDCA treatment. Western blot analysis of PKA (g), CREB (h), and p65 (i) phosphorylation levels in cDC1 cells treated with 0.25 μM TGR5 inhibitor (SBI-115). Western blot analysis of MHC I expression (j) and flow cytometry analysis (k) of H-2Kb in cDC1 cells treated with 0.25 μM SBI-115. Western blot analysis of MHC I expression in cDC1 cells treated with 10 μM MDL12330A (l), 2 μM H89 (m), 2.5 μM QNZ (n), or 1 μM 666‒15 (o). p Correlation between MHC I and TGR5 expression signatures in SKCM within TCGA datasets. q Prognostic value of TGR5 expression levels for overall survival in SKCM patients. The data are presented as the means ± SDs. Statistical significance was evaluated via two-tailed Student’s t-tests (b, f, k), two-sided log-rank tests (q), and Pearson correlation tests (p). P-values for the RNA-sequencing data were adjusted for the false discovery rate (FDR) via the Benjamini–Hochberg method. (*p ≤ 0.05, **p ≤ 0.01, ***p ≤ 0.001, and ****p ≤ 0.0001; ns not significant)
TGR5 is a membrane-bound receptor activated by BAs, whereas FXR is a nuclear receptor involved in BA-mediated gene regulation.44 To investigate their roles in dendritic cell function, we examined the expression of these receptors in murine cDC1 cells. Notably, we found that TGR5 was expressed, whereas FXR was not. This finding aligns with data from the Human Protein Atlas, which shows similar results in human DC cells (Supplementary Fig. 13h). Mechanistically, TGR5 activation promotes adenylate cyclic AMP (cAMP) accumulation and protein kinase A (PKA) activation,44,45 which directly phosphorylates CREB and NF-κB to drive their transcriptional activity,46,47,48 thereby regulating downstream effector expression. (Supplementary Fig. 13i). In support of these findings, treatment of cDC1 cells with TCDCA for 24 h significantly elevated cAMP levels and increased the phosphorylation of PKA, CREB, and p65 (Supplementary Fig. 13j, k). To confirm the functional relevance of this pathway, we employed pharmacological inhibitors targeting key signaling components and validated the efficacy of these inhibitors (Supplementary Fig. 14a–e). The TGR5 inhibitor SBI-115 completely abolished TCDCA-induced increases in cAMP, PKA activity, and CREB/p65 activation (Fig. 7f–i) and abolished the TCDCA-mediated upregulation of MHC I in cDC1s (Fig. 7j, k). Additionally, a selective cAMP inhibitor (MDL12330A), a PKA inhibitor (H89), an NF-κB inhibitor (QNZ), and a CREB inhibitor (666-15) significantly reduced MHC I protein levels (Fig. 7l–o, Supplementary Fig. 14f). We further assessed OVA-FITC uptake and found that SBI-115, MDL12330A, H89, QNZ, and 666-15 significantly decreased OVA-FITC uptake (Supplementary Fig. 14g, h) and antigen presentation of SIINFEKLs in cDC1s (Supplementary Fig. 14i, j). To investigate whether TCDCA enhances the T-cell-priming capacity of cDC1s through TGR5 signaling, we pretreated cDC1s with 50 μM TCDCA in the presence or absence of various signaling inhibitors before they were cocultured with naive CD8+ T cells. As illustrated by the CFSE dilution assay (Supplementary Fig. 14k, l), cDC1s conditioned with TCDCA significantly potentiated the proliferation of CD8+ T cells. Crucially, this stimulatory effect was markedly abolished when cDC1s were pretreated with inhibitors targeting TGR5, cAMP, PKA, CREB, or NF-κB. Consistent with the proliferation data, TCDCA-primed cDC1s substantially increased the expression of effector molecules in CD8+ T cells, including IFN-γ, GzmB, and TNFα (Supplementary Fig. 14m–o). However, the pharmacological blockade of TGR5 and its downstream signaling pathway in cDC1s effectively neutralized their ability to enhance CD8+ T effector function. was effectively reversed by these inhibitors. These results indicate that TCDCA acts directly on cDC1s to augment their immunostimulatory potential via a TGR5-mediated canonical signaling cascade.
Finally, we assessed the correlation between these observations and disease outcomes. In the TCGA datasets for skin cutaneous melanoma (SKCM), we observed a highly significant positive correlation between MHC I molecules (HLA-A, HLA-B, HLA-C, HLA-E, HLA-F, and HLA-H) and TGR5 (Fig. 7p). Notably, higher expression of TGR5 genes in SKCM tumor samples was significantly associated with improved patient survival (Fig. 7q). Similar trends were observed in CESC, MESO, and SRAC tumor samples (Supplementary Fig. 15a–c), where a significant positive correlation between MHC I molecules and TGR5 was also identified. We observed a highly significant positive correlation between MHC I molecules (HLA-A, HLA-B, HLA-C, HLA-E, HLA-F, and HLA-H) and TGR5 in CESC, MESO, and SRAC tumor samples (Supplementary Fig. 15d–f). These results suggest that TCDCA-mediated regulation of MHC I expression relies primarily on TGR5 and its associated downstream signaling pathways.
CDCA shows promising preclinical potential for application in tumor therapy
Given the important role of dendritic cells (DCs) in activating T cells, numerous studies have focused on developing DC-based vaccines for cancer immunotherapy.49,50 Previous studies have demonstrated that cDC1s predominantly prime CD8+ T cells via antigen cross-presentation and that the extent of CD8+ T-cell activation is correlated with the number of MHC I/peptide complexes displayed on the cell surface.3,11,12 Therefore, we further investigated whether TCDCA could improve the therapeutic effect of cDC1 vaccines on tumors by modulating MHC I (H-2Kb) expression in cDC1s. First, we sorted cDC1s induced from bone marrow (Supplementary Fig. 16a) and validated the effectiveness of both IV injection and SC injection routes in delivering ovalbumen (OVA)-preloaded BM-cDC1s (cDC1 vaccine) (Supplementary Fig. 16b). Tetramer-SIINFEKL+CD8+ T cells were observed in the blood and tdLNs of the mice after IV or SC injection (Supplementary Fig. 16c, d). Next, we administered PBS- or TCDCA-treated cDC1 vaccines to mice bearing B16-OVA tumors (Fig. 8a). Tumor growth rates were significantly lower in the mice treated with the cDC1 vaccine than in those not receiving the vaccine, and the mice receiving the TCDCA-pretreated cDC1 vaccine exhibited slower tumor growth than did those receiving the PBS-pretreated cDC1 vaccine (Fig. 8b). Similarly, we assessed CD8+ T cells in tumors and found that the percentage of CD8+ T cells within tumors significantly increased following cDC1 vaccine injection. Compared with the PBS-pretreated cDC1 vaccine, the TCDCA-pretreated cDC1 vaccine significantly increased the number of CD8+ T cells, including tetramer-SIINFEKL+CD8+ T cells, as well as the production of cytotoxic cytokines by CD8+ T cells (Fig. 8c). These data suggested that TCDCA-treated cDC1 vaccines enhance the effectiveness of tumor treatment.
Fig. 8
CDCA shows potential preclinical application value for tumor treatment. a Schematic diagram illustrating the experimental design for cDC1 vaccine treatment. On day 0, the WT mice in all the experimental groups received a subcutaneous inoculation of 2.5 × 10⁵ B16-OVA cells. Following tumor engraftment, the mice were administered either PBS, the cDC1 vaccine with PBS treatment, or the cDC1 vaccine with 50 μM TCDCA treatment (1 × 10⁶ cells/mouse; subcutaneous injection on days 6 and 10 postinoculation). b Tumor growth curves of C57BL/6J WT mice treated with the cDC1 vaccine, as illustrated in (a) (n = 8–12 per group). c The ratios of CD3+ CD8+ T cells and tetramer-SIINFEKL+ CD8+ T cells to live cells, along with the quantification of IFN-γ, GzmB, and TNF-α expression among CD8+ T cells in tumors, were determined (n = 6 per group). d Schematic diagram illustrating the experimental design for TGR5-/- and WT-cDC1 vaccine treatment. On day 0, the mice in all the experimental groups received a subcutaneous inoculation of 2.5 × 10⁵ B16-OVA cells. Following tumor engraftment, the mice were administered either PBS or the TGR5-/- or WT-cDC1 vaccine with TCDCA treatment (1 × 10⁶ cells/mouse; subcutaneous injection on days 6 and 10 postinoculation). e Tumor growth curves of C57BL/6J WT mice treated with the cDC1 vaccine, as illustrated in (d) (n = 8–12 per group). f Potential benefits of combination therapy with CDCA and poly I:C. g Tumor growth curves of C57BL/6J WT mice treated with vehicle or CDCA in combination with poly I:C or DMSO, as indicated in (f) (n = 8–12 per group). h Quantification of CD8+ T cells in tumors (n = 8 per group). i cDC1 cell analysis based on Supplementary Fig. 17b; data represent quantification of 8 tumors. j Potential benefits of combination therapy with CDCA and anti-PD-1. k Tumor growth curves of C57BL/6J WT mice treated with vehicle or CDCA in combination with IgG2b or PD-1 antibodies as indicated in (d) (n = 8–12 per group). l Quantification of CD8+ T cells in tumors (n = 8 per group). m cDC1 analysis based on the data in supplementary Fig. 18b; the data represent the quantification of 8 tumors. Statistical significance was assessed by Student’s t-test (h, i, l, m), two-way ANOVA followed by the Bonferroni post hoc correction (b, e, g, k), one-way ANOVA followed by the Bonferroni post hoc correction (c), and the graphs display the means ± SDs (h, i, l, m, c) or means ± SEMs (b, e, g, k). (*p ≤ 0.05, **p ≤ 0.01, ***p ≤ 0.001, and ****p ≤ 0.0001; ns not significant)
Additionally, to investigate the role of TGR5 in TCDCA-mediated antitumor immunity, we generated TGR5−/− mice (Supplementary Fig. 16e–g) and adoptively transferred cDC1s derived from either WT or TGR5−/− mice, following TCDCA treatment, into B16-OVA tumor-bearing mice (Fig. 8d). The results demonstrated that in the B16-OVA tumor model, the tumor-suppressive effect was significantly weaker in the TGR5−/−-cDC1 treatment group than in the WT-cDC1 group (Fig. 8e). Flow cytometry analysis revealed that the proportion of SIINFEKL-H-2Kb complex-specific CD8+ T cells in the TME was approximately lower in the TGR5−/−-cDC1 group than in the WT-cDC1 group, and the ratio of CD8+ CD44+ T cells also showed the same trend (Supplementary Fig. 16h‒j). These findings indicate that TGR5 is a crucial molecule for TCDCA-enhanced cDC1-dependent antigen presentation and tumor suppression.
Immature DCs cannot efficiently prime T cells, highlighting the need to promote the maturation of cDC1s. cDC1s uniquely express Toll-like receptor 3 (TLR3),51 which recognizes viral double-stranded RNA and its synthetic analog polyriboinosinic acid-polyribocytidylic acid (poly I:C). We hypothesized that combining CDCA with poly I:C would enhance cDC1 maturation and thereby potentiate tumor growth inhibition (Fig. 8f). As further evidence of target engagement, CETSAs demonstrated that both CDCA and TCDCA induce thermal stabilization of TGR5 in cDC1s (Supplementary Fig. 16k–n). These results strongly support the direct binding of both bile acids to TGR5 and suggest that, in vivo, CDCA may act as a prodrug that is converted to TCDCA to mediate antitumor effects. To evaluate this combination strategy, mice bearing subcutaneous B16-OVA tumors were treated with CDCA, poly I:C, or both. While either agent alone showed limited efficacy, the combination of CDCA and poly I:C resulted in significantly enhanced suppression of tumor growth (Fig. 8g). Consistent with this outcome, although monotherapy with CDCA or poly I:C induced only modest increases in CD8⁺ T-cell and cDC1 infiltration, their combination led to substantial accumulation of both cell types throughout the tumor tissue (Fig. 8h, i, Supplementary Fig. 17a, b).
Moreover, the PD-L1/PD-1 signaling pathway induces T-cell exhaustion, thereby inhibiting the activation, proliferation, and antitumor function of tumor antigen-specific CD8+ T cells, resulting in tumor-immune escape. Anti-PD-1 therapy disrupts the PD-L1/PD-1 inhibitory signaling pathway in T cells within the TME, thereby increasing T-cell recognition and the response to tumor cells.52,53 cDC1s play a crucial role in the efficacy of anti-PD-1 therapy, as tumors lacking cDC1s exhibit poor responses to anti-PD-1 therapy in mice.4,54 Therefore, we hypothesized that combination therapy with CDCA and anti-PD-1 could enhance tumor treatment (Fig. 8j). To test this hypothesis, the mice were pretreated with CDCA and vehicle, followed by B16-OVA tumor injection and anti-PD-1 therapy. As expected, CDCA notably enhanced the efficacy of anti-PD-1 therapy against B16-OVA tumors (Fig. 8k). The frequency of intertumoral CD8+ T cells was significantly greater in the mice that received combined CDCA and anti-PD-1 treatment than in those that received either treatment alone (Fig. 8l). The distribution of cDC1s in tumors followed a similar trend to that of CD8+ T cells (Fig. 8m, Supplementary Fig. 18a, b). These data collectively highlight the potential of combining CDCA with anti-PD-1 therapy to stimulate potent antitumor immunity.
In summary, our study elucidates the specific mechanisms by which CDCA regulates tumors and reveals its significant potential for clinical translation (Fig. 9).
Fig. 9
Working model of CDCA-mediated cDC1 cross-priming upregulation. Working model of CDCA-mediated MHC I upregulation. Chenodeoxycholic acid (CDCA) accumulates in tumor interstitial fluid (TIF) through its binding with taurine to form TCDCA. It enhances the expression of MHC I (H-2Kb) in cDC1s through the TGR5 signaling pathway. The increase in MHC I expression subsequently increases the proliferation and activation of CD8+ T cells that are specific to tumors, thereby strengthening the antitumor-immune responses of both cDC1s and the CD8+ T-cell-mediated antitumor system in mice with tumors
