


Animals
All animal experiment protocols were approved by the Institutional Animal Care and Use Committee (IACUC) (INHA 230827-886) of Inha University. All animals were purchased from Orient Bio Inc. (Charles River, Korea). Animals were housed at the university-operated housing facility and monitored daily by a professional. Animals were additionally monitored by the researchers at least once every two days and euthanized upon reaching predefined humane endpoints approved by the IACUC, including significant body weight loss or excessive tumor burden. The tumor volumes were measured using calipers. Tumor volumes were calculated as {(length) × (width)2 × 0.5}, where length and width denote the longest and shortest diameters of the tumor, respectively. Bone marrow cells collected from the tibia and femur were flushed using syringes and strained with a 70 μm cell strainer. Red blood cells were lysed with RBC lysis buffer (#420301, BioLegend). The resulting cells were handled as described in the “Cells and cell culture” section.
Cells and cell culture
B16F10 and CT26 cells were purchased from the Korean Cell Line Bank (KCLB, Seoul, Korea). MC38 and MC38-OVA cells were maintained in Roswell Park Memorial Institute medium (RPMI 1640, #22400105) supplemented with 10% fetal bovine serum (FBS, #10082147) and 1% P/S (v/v) (#15140122), while other cells were maintained in Dulbecco’s Modified Eagle Medium (DMEM) (#11995073) supplemented with 10% FBS and 1% P/S (v/v). All media and supplements were purchased from GIBCO (Carlsbad, CA, USA). Cells were incubated at 37 °C in a 5% CO2 atmosphere. Bone marrow cells were differentiated into macrophages in macrophage medium (RPMI 1640) supplemented with 10% FBS, 1% P/S, and 20 ng/mL macrophage colony-stimulating factor (M-CSF) (#576404, BioLegend, San Diego, CA, USA). Macrophage media were exchanged on day 3. Only the adherent cell fraction was used on day 6.
Flow cytometry and antibodies
Single-cell suspensions of cell samples were prepared in cell staining buffer (#420201, BioLegend). Viability staining was performed using Zombie NIR fixable dye (#423105, BioLegend) for 15 min at room temperature. The cell suspension was treated with an anti-mouse CD16/32 antibody (1:50 dilution) (clone 93, BioLegend) for 10 min at room temperature prior to antibody staining. PerCP anti-mouse F4/80 antibody (clone BM8), fluorescein isothiocyanate (FITC) anti-mouse I-A/I-E (clone M5/114.15.2), Pacific Blue anti-mouse CD69 (clone H1.2 F3), and PerCP anti-mouse CD86 (clone GL-1) antibodies were all purchased from BioLegend, San Diego, CA, USA. Flow cytometry and cell sorting were performed using a FACSMelody (BD Biosciences). For immunological analysis, tumors and spleens were isolated on day 22. Tissues were made into single-cell suspensions using a gentleMAC dissociator (Miltenyi Biotec). Samples were stained with a viability dye, blocked with anti-mouse CD16/32 antibody, and stained with fluorophore-tagged antibodies (Supplementary Table 1). Stained samples were analyzed with an Attune Cytpix flow cytometer (Thermo Fisher).
Bacterial membrane extraction70
E. coli (ATCC #25922) and S. aureus (ATCC #29213) were grown on Luria–Bertani (LB) medium for 12 h at 37 °C, 200 rpm. Bacterial cells were purchased from ATCC, USA. The bacterial cell concentration was adjusted to an optical density (OD)600 of 0.7 and harvested by centrifugation (8000 × g, 5 min). The supernatant was discarded, and the cell pellet was resuspended with 200 μg/mL lysozyme (#L4919, Sigma‒Aldrich, St. Louis, MO, USA) (in 200 mM Tris-HCl, pH 8.0) and kept at room temperature for 10 min. The same volume of 10 μg/mL DNase I (#11284932001, Roche, Mannheim, Germany) (in 50 mM Tris-HCl, 2% Triton, pH 8.0) was added and incubated at 4 °C for 30 min. The samples were centrifuged at 1633 × g for 5 min. The supernatant was collected and centrifuged at 22,967 × g for 10 min. The pellet was resuspended in excess PBS and centrifuged at 22,967 × g for 10 min. The supernatant was discarded, and the pellets were collected in the required volume of PBS. The centrifugation temperature was maintained at 4 °C. The absorbance was measured using a V-730 spectrophotometer (Jasco, Japan).
BME charge adjustments and membrane association
DOTAP was first deposited as a thin film in a glass vial via argon purging. The extracted BME was mixed with DOTAP at the indicated ratios, and the mixture was vigorously vortexed. The mixture was sonicated (30 s, 2/2 s pulse, 25% amplitude) on an ice block using a probe-tip sonicator (VCX500; Sonics & Materials, Newtown, CT, USA). A BME:DOTAP ratio of 1:1.67 (wt.) was used for all subsequent experiments. For association quantification experiments, 18:1 NBD-PE was added at a 1% molar ratio to DOTAP. The same amount of 1,2-dioleoyl-sn-glycero-3-phosphocholine (DOPC) was used for charge-control particles. The resulting fluorescent-tagged particles were added to cell-seeded wells (2 × 10⁵ cells overnight in 6-well plates) at 20 μg/mL BME concentration. After incubation for 4 h, the medium containing free (unassociated) particles was removed, the cells were washed three times with PBS, and fresh medium was added. Cells were harvested for flow cytometry quantification at the denoted time points (0, 24, and 48 h). For the assessment of BMEplus treatment on macrophages, 2 × 10⁵ macrophages were seeded in 6-well plates and treated the same way as above. After incubation and washing, macrophages were stained with LysoTracker (#L7528, Invitrogen). All lipids (DOTAP, DOPC, DPPC, 18:1 NBD-PE) were purchased from Avanti Polar Lipids (Alabaster, AL, USA).
Primers (5′ ->3′)
Il6 forward/reverse: TGCTGGTGACAACCACGGCC/GCCACTCCTTCTGTGACTCCAGC
Arg1 forward/reverse: ACACTCCCCTGACAACCAGC/AGGGTCTACGTCTCGCAAGC
Il10 forward/reverse: ATCATGCCTGGCTCAGCACT/AAGGCAGTCCGCAGCTCTAG
Il1b forward/reverse: CTGCAGTGGTTCGAGGCCCTA/GGACAGCCCAGGTCAAAGGT
Tnfa forward/reverse: GGGACTAGCCAGGAGGGAGA/AGTTCCACGTCGCGGATCAT
Mhcii forward/reverse: GAAAGGACCTCGAGGCCCTC/CTCTGAGTCGGAGTGGCAGG
Il12p40 forward/reverse: TGCAGGGTCCGATCCTAGGA/ATTAGCTCCCTGGCTCTGCG
18S rRNA forward/reverse: ATGGTAGTCGCCGTGCCTAC/CGGGAGTGGGTAATTTGCGC
Primers were purchased from Integrated DNA Technology, Singapore.
Griess assay
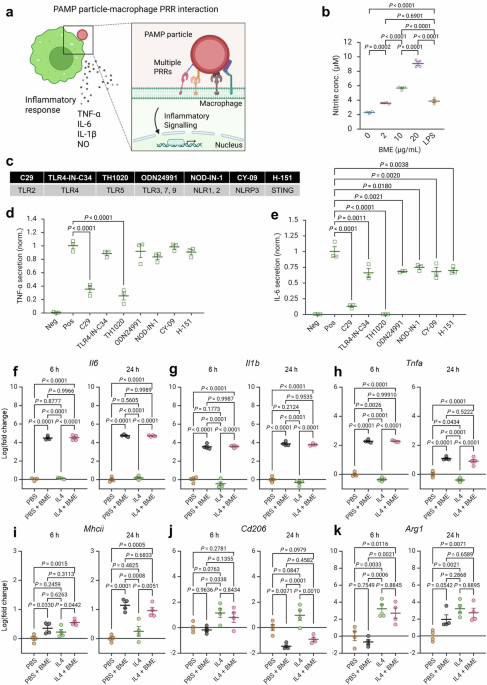
The Griess assay was performed according to the manufacturer’s instructions (Griess Reagent Kit, #G7921; Invitrogen, Eugene, OR, USA). The components N-(1-naphthyl)ethylenediamine and sulfanilic acid were mixed in a 1:1 (vol.) ratio to obtain Griess Reagent. In each well of a 96-well plate, 130 μL of deionized water, 150 μL of the sample, and 20 μL of Griess Reagent were added and incubated for 30 min at room temperature. For blank measurement, Griess Reagent was added to 150 μL of media mixed with 130 μL of deionized water immediately before the measurement. The absorbance was measured at 548 nm using a microplate reader (Varioskan Lux; Thermo Fisher Scientific, Bothell, WA, USA). For sample preparation, macrophages were seeded in a 24-well plate at 105 cells in 1 mL of medium and incubated overnight. Then, 100 μL of PBS containing BME or LPS (#L2880, Sigma‒Aldrich) was added to the wells. The supernatant was collected, and the assay was performed as described above.
Macrophage transcriptional and translational response to BME
One milliliter of 105/mL bone marrow-derived macrophages (BMDMs) was seeded per well in a 24-well plate. To induce the protumor phenotype, IL-4 (I1020, Sigma‒Aldrich) was added at a final concentration of 20 ng/mL. After 48 h of incubation, BME was added at a final concentration of 20 μg/mL. After 6 h or 24 h of incubation, the supernatant was analyzed using enzyme-linked immunosorbent assay (ELISA) (IL6 (#88-7064-88), and TNF-α (#88-7324-88), Invitrogen), and the RNA was extracted from cells and further processed for quantitative real-time polymerase chain reaction (qRT‒PCR).
qRT‒PCR
Total RNA was extracted using commercial kits (#9767, Takara, Shiga, Japan; or #K-3140, Bioneer, Daejeon, Korea) according to the manufacturer’s instructions. cDNA was synthesized (#RR047A, Takara, Japan, or #K-2249, Bioneer, Daejeon, Korea) using 500 ng of extracted total RNA, followed by RT‒PCR reaction (#K-6252, Bioneer). Forward and reverse primers (10 μM, 0.8 μL) were mixed with the synthesized cDNA (1 μL of total cDNA reaction mixture). Reactions were performed using the CFX Opus 96 RT‒PCR system (Bio-Rad) for 40 cycles, and mRNA expression was calculated through the ΔΔCt model.71
Endocytosis inhibition assay
A total of 2 × 10⁵ MC38 cells were seeded in each well of a 6-well plate. After overnight incubation, the cells were pretreated with cytochalasin D (#C8273, Sigma‒Aldrich), dynasore (#D7693, Sigma‒Aldrich), or nystatin (#N1400000, Sigma‒Aldrich) for 30 min. Fluorescently tagged (with NBD-PE, 1 mol%) BMEplus was added at a 20 μg/mL concentration. After incubation for 30 min, the cells were analyzed using flow cytometry for NBD-positive cells or imaged under a fluorescence microscope (Evos M7000, Invitrogen) after staining with Hoechst 33342 (H3570, Thermo Fisher Scientific).
Signaling pathway blockade
Macrophages were plated at a density of 105 cells/well in a 24-well plate and incubated overnight. The cells were treated with PRR antagonists such as TH1020 (#HY-116961), ODN 24991 (#HY-150746), TLR4-IN-C34 (#HY-107575), C29 (#HY-100461), CY-09 (#HY-103666), NOD-IN-1 (#HY-100691), and H-151 (#HY-112693) at final concentrations of 2, 1, 10, 70, 5, 15, and 0.5 μM and incubated for 30 min. BME was added to the wells at a final concentration of 20 µg/mL. Supernatants were collected at 6 h after treatment and analyzed using ELISA. All PRR antagonists were purchased from MedChem Express (Monmouth Junction, NJ, USA).
Phagocytosis analysis
For the phagocytosis assay, macrophages were seeded at a density of 2 × 10⁵ cells/well in a 6-well plate in 1 mL of RPMI 1640 medium (10% FBS, 1% P/S, and 10 ng/mL M-CSF). After overnight incubation, the cells were stained with 1 μM CellTracker Green CMFDA (#C7025, Invitrogen) for 15 min in an incubator. Stained macrophages were washed, and 1 mL of RPMI 1640 medium (supplemented with 10% FBS, 1% P/S, and 10 ng/mL M-CSF) was added. MC38 cells were collected and stained similarly with 5 μM CellTracker Red CMTPX (#C34552, Invitrogen). After washing, 2.5 × 10⁶ MC38 cells (in PBS) were transferred to a tube, and PBS, BMEctrl, or BMEplus was added at a final concentration of 50 µg/mL in 1 mL. After 15 min of incubation at room temperature, the cells were washed and added to macrophage-seeded wells at the indicated densities. After 2 h of incubation, adherent cells were scraped off, stained with a fixable viability dye, and fixed with 4% paraformaldehyde PFA for 20 min at room temperature. The fixed samples were analyzed using a cytometer to determine the percentage of phagocytic macrophages as well as the percentage of dead cancer cells among all cancer cells to evaluate direct cytotoxicity. The same procedure was repeated for confocal imaging, except that the cells were plated on a confocal imaging dish. Confocal images were acquired using an LSM 980 microscope.
Macrophage ovalbumin antigen peptide presentation
Macrophages were seeded in a 6-well plate at 2 × 10⁵ cells in 1 mL of RPMI 1640 medium (10% FBS, 1% P/S, and 10 ng/mL M-CSF) and incubated overnight. Then, 4 × 10⁵ MC38-OVA, MC38-OVA-BMEctrl, or MC38-OVA-BMEplus cells (prepared as described for the phagocytosis assay) were added, and the plates were incubated for 2 h or 6 h. Cells were scraped off and stained with APC anti-mouse H-2Kb bound to the SIINFEKL antibody (BioLegend #141606, clone 25-D1.16, 50:1 dilution).
Cytokine secretion analysis
MC38 cells were prepared as described in the “BME charge adjustments and membrane association” section, except that no NBD-tagged lipid was used. Cells harvested at different time points after membrane association (0, 24, and 48 h) were added to macrophage-seeded wells (2 × 10⁵ cells). After 6 h of coincubation, the supernatant was collected and analyzed for IL-6, TNF-α, and IL-12 (#88-7121-88, Invitrogen) using ELISA, following the manufacturer’s instructions.
Doxorubicin liposomes
Doxorubicin liposomes were prepared using the thin-film method. Initially, DPPC and cholesterol (#C8667; Sigma‒Aldrich) were dissolved in chloroform at a molar ratio of 2:1. The solvent was evaporated under argon gas, and the remaining solvent was completely removed under vacuum. The resulting film was hydrated with an (NH4)2SO4 solution adjusted to pH 5.5, followed by 11 cycles of extrusion through a 100 nm polycarbonate membrane. The buffer was subsequently replaced with PBS using a PD-10 desalting column (Cytiva). Doxorubicin hydrochloride (EDQM) was loaded into the liposomes by mixing them with the prepared solution at a drug-to-lipid ratio of 1:10 and incubating them for 1 h at 47 °C. To remove unencapsulated doxorubicin, the solution was passed through a PD-10 desalting column, and the encapsulated doxorubicin content was quantified using UV‒vis spectrometry at 480 nm.
Tumor models and treatments
For the MC38 tumor models, 6–8-week-old male C57BL/6 mice were inoculated with 5 × 10⁵ MC38 cells in the right flank on D + 0. For the macrophage depletion study, clodronate liposomes (#F70101C-N; FormuMax Scientific, Sunnyvale, CA, USA) were intratumorally injected on D + 8, D + 11, and D + 14. For therapy, treatments began from D + 9. For the two-tumor models, 3 × 10⁵ MC38 cells were inoculated in the left flank. For the CT26 tumor models, 6–8-week-old female BALB/c mice were inoculated with 1 × 10⁶ CT26 cells in the right flank on D + 0. Treatments began from D + 6. For EMT6 orthotopic tumors, 6- to 8-week-old female BALB/c mice were inoculated with 5 × 10⁵ EMT6 cells in the 2nd mammary fat pad. Treatments began from D + 6. PBS, BMEctrl, or BMEplus was intratumorally injected every 2 days for a total of 5 times, 20 μg per injection. For the combination therapy, doxorubicin liposomes were injected into the tail vein at 4 mg/kg every 3 days for a total of 3 times. For anti-PD-L1 therapy, 200 μg of atezolizumab was intraperitoneally injected on days 9, 12, 15, and 18 (total of 4 times). For anti-CD47 therapy, 50 μg of anti-CD47 antibody (#127518, clone miap301, BioLegend) was intratumorally injected on days 9, 11, 13, and 17 (total of 4 times). Injection routes, number of injections, and doses per injection for both ICIs were determined based on previous studies.44,72,73
In vivo particle distribution
After inoculation with 5 × 10⁵ MC38 cells, 50 μL of PBS, BMEctrl, or BMEplus was intratumorally injected on D + 9. BMEctrl and BMEplus were prepared as described above, except for the addition of 1 mol% (to DOTAP) 18:1 NBD-PE for fluorescence labeling. After 24 h, the mice were euthanized, and the tumor, inguinal and axillary lymph nodes (total 4), spleen, liver, kidney, and lungs were isolated. Each organ was transferred to absolute ethanol and homogenized by mechanical grinding, followed by tip sonication. The homogenized tissues were centrifuged at 10,000 × g for 3 min. The supernatants were transferred to black well plates, and NBD fluorescence was read at 488 nm excitation and 533 nm emission on a microplate reader.
Serum biochemical analysis
Blood samples were collected from mice, transferred to serum separator tubes (SST) (BD Microtainer), and allowed to clot at room temperature for 30 min. After clotting, the tubes were centrifuged to separate the serum from cellular components. The resulting serum supernatant was collected and sent to Dooyeol Biotech, Korea, for further sample preparation and biochemical analysis.
Tissue imaging
For confocal imaging, tumors were treated as previously described. Isolated tumor tissues were embedded in optimal cutting temperature (OCT) compound and immediately frozen at −80 °C. The cryopreserved tissues were sectioned into 10 μm slices and transferred to a slide glass. The tissues were washed with PBS, stained with Hoechst 33342 for 5 min, and then stained with CellMask Deep Red Plasma Membrane Stain (#C10046, Invitrogen) for 20 min. After washing, the stained tissues were embedded in mounting medium and imaged using an LSM 980 confocal microscope (Carl Zeiss). For histological analyses, the tumors were treated similarly, except that the injected BME particles did not contain 18:1 NBD-PE lipids. For hematoxylin & eosin (H&E) staining, the isolated organs were fixed in 4% PFA and sent to Celltis Bio (Cheongju, Korea) for further processing. For the TUNEL assay, the samples were stained and prepared by Histoire (Seoul, Korea), and the prepared TUNEL slides were imaged under an LSM 980 confocal microscope.
Transcriptome analysis
Following inoculation with 5 × 10⁵ MC38 cells, 50 µL of PBS or BMEplus was intratumorally injected on D + 9. After 24 h, the tumor tissue was isolated and digested into a single-cell suspension by treatment with collagenase type IV (#C4-28; Sigma‒Aldrich) and DNase I. The cells were stained with a viability dye and anti-mouse F4/80 antibody. Live F4/80-positive macrophages were sorted using the FACSMelody system and immediately frozen. The samples were sent to Bioneer Inc. for further preparation and analysis. Briefly, a library was prepared using the SMARTer Stranded Total RNA-Seq kit v2–Pico input mammalian kit (Takara). Transcriptome sequencing was performed on an Illumina NovaSeq 6000, 150PE platform with 6 GB of data output per sample.
Particle characterization
The hydrodynamic diameter of the particles was measured using dynamic light scattering (DLS). DLS and zeta potential were measured using a Zetasizer Pro (Malvern Panalytical). SEM samples were prepared as previously described.74 Samples were deposited onto a cover glass and dried. The samples were Pt-coated using Q15T-S (Quorum Technologies) at 20 mA current for 120 s. The coated samples were imaged with SU8010 SEM (Hitachi) at an accelerating voltage of 15.0 kV. For TEM, samples were deposited onto a copper TEM grid. The samples were negative-stained with Uranyless (#22409, Electron Microscopy Sciences) and imaged with field emission (FE)-TEM (JEM2100F, Jeol).
Software and statistical analysis
Flow cytometry data were analyzed using the web-based tools floreada.io and FlowJo (v10.10.0). Volcano plots were created using a web-based tool developed by the Molecular and Genomics Informatics Core Facility (MaGIC; Rutgers NJMS, https://volcano.bioinformagic.tools/).75 All other flow cytometry graphs and schematic figures were created using Biorender.com with statistical analysis, except Fig. 4a, and tumor volume line graphs and corresponding statistical analysis (Origin Pro ver. 2024b (10.15)). ImageJ software was used for line profile extraction, as shown in Fig. 4b.
