


Cells
Murine B16F10 and YUMM1.7 melanoma cell lines, along with human melanoma cell line, WM266-4, were kindly gifted by Dr. Ivana de la Serna, a Professor in the Department of Cell and Cancer Biology at the University of Toledo, OH, who purchased the cell lines from ATCC (Manassas, VA, USA). All cell lines were cultured in Dulbecco’s Modified Eagle’s Medium (DMEM) (Invitrogen, Carlsbad, CA, USA), supplemented with 10% fetal bovine serum (FBS) (Phoenix Scientific, San Marcos, CA, USA), 100 units/ml penicillin-streptomycin, 2 mM L-glutamine (Invitrogen, Carlsbad, CA, USA), and maintained at 37 °C in a humidified 5% CO2 environment. All cells were used at low passages, and comparable passages were used in different experiments.
Reagents
The reagents and chemicals were purchased commercially: LTD4, CysLT1R antagonist (MK571), and cys-LT ELISA kit from Cayman Chemicals, Ann Arbor, MI, USA, phospho- and total-antibodies of ERK, P38, AKT, YAP, and LOXL-2 from Cell signaling technology, Danvers, MA, USA, GAPDH antibody from Fitzgerald, Acton, MA, USA, all secondary antibodies from Jackson Immuno Research, West Grove, PA, USA, transcriptor first strand cDNA synthesis kit and light cycler 480 SYBR Green I Master Mix from Roche, Indianapolis, IN, USA, Inhibitors for ERK/MEK pathway (PD98059), PI3K/AKT pathway (LY294002), and P38/MAPK pathway (BIRB0796) from Tocris Bioscience, Minneapolis, MN, USA, CysLT1RsiRNA, NSsiRNA, and all reagents for receptor knockdown from DharmaconTM, Lafayette, CO, USA, all reagents for western blot analysis from Bio-Rad, Hercules, CA, USA, primers for qPCR from Integrated DNA Technologies, Coralville, IO, USA, Fura-2AM from Thermo Fisher ScientificTM, Waltham, MA, USA, WoundMakerTM from Essen BioScience, Ann Arbor, MI, USA, 8.0 µm trans-well inserts from Corning, NY, BrDU proliferation assay kit from EMD Millipore Corporation, La Jolla, CA, USA.
Animals
All in vivo experiments were performed on 6-8-week-old WT and Cysltr1–/– mice. WT mice were purchased from The Jackson Laboratory, and Cysltr1–/– mice on a C57BL/6 background were kindly provided by Dr. K. Frank Austen’s lab, Brigham and Women’s Hospital, Boston [23]. Both strains were maintained at the Department of Laboratory Animals and Research (DLAR) at the University of Toledo. All animal experiments were done in accordance with standard guidelines as approved by the Institutional Animal Care and Use Committee of the University of Toledo. Both male and female mice were used for the experiments.
Ethics statement
All animal experiments were approved by the Institutional Animal Care and Use Committee of the University of Toledo (Protocol No: 400209) and performed in accordance with institutional guidelines and the NIG Guide for the Care and Use of Laboratory Animals. Publicly available TCGA datasets were analyzed in accordance with their data access policies and required no additional ethical approval. We used BioRender to create some of the illustrations, and we have obtained permission from them to publish them in a journal.
TCGA database
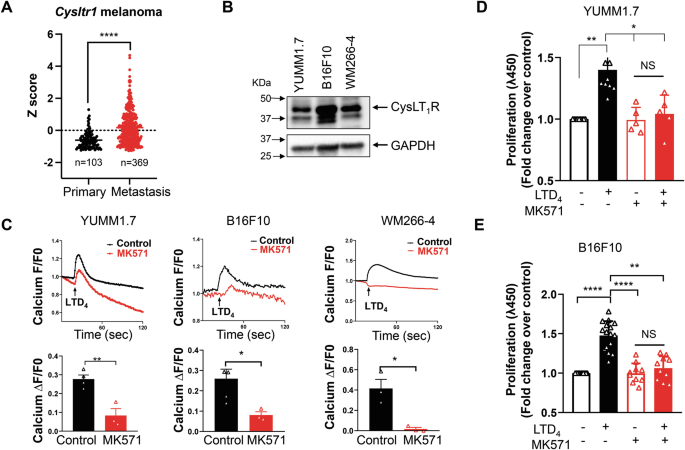
Raw bulk RNA sequence data of 472 melanoma patients were extracted from The Cancer Genome Atlas (TCGA) database. CysLT1R gene expression in primary and metastatic tumors was segregated and represented as Z scores based on the stage of melanoma progression at the time of biopsy collection.
Calcium flux assay
YUMM1.7, B16F10, and WM266-4 cells were cultured on MatTek glass-bottomed dishes and pre-treated with Fluo-4 for 30 min. After incubation, cells were briefly washed thrice using calcium buffer (in mM: 136 NaCl, 4.7 KCl, 1.2 MgSO4, 1.1 CaCl2, 1.2 KH2PO4, 5 NaHCO3, 5.5 glucose, and 20 HEPES, pH 7.4). Cells were then imaged under a Leica confocal microscope (SP5), and calcium flux was observed in response to LTD4 stimulation with or without CysLT1R antagonist (MK571) pre-treatment for 10 min. Images were acquired every 1 s for 2 mins and analyzed using Leica software.
Cell activation and treatments
B16F10 and YUMM1.7 cells were pre-treated with antagonists of CysLT1R (MK571, 1 µM) and ERK (PD98059, 50 µM) for 30 min followed by stimulation with LTD4 (100 nM or 500 nM) for the indicated time to analyze the expression of p-ERK, p-P38, p-AKT, p-YAP, and their totals along with LOXL-2 and GAPDH.
CysLT1R knockdown using siRNA transfection
For all experiments involving CysLT1R knockdown, YUMM1.7 cells were transfected with siGENOME SMART pool (a mix of 4 pre-made siRNAs from DharmaconTM, Lafayette, CO, to block CysLT1R (20 nmol/L), or they were transfected with non-specific siRNA (negative control). Transfection was performed with siLentFect transfection reagent (Bio-Rad) as per the manufacturer’s instructions.
Cell lysates and western blotting
Following stimulations or gene knockdown, melanoma cells (2.5 × 10⁵ cells per well) were lysed with lysis buffer (BD Bioscience, San Jose, CA, USA) supplemented with Protease and Phosphatase Inhibitor Cocktails (Thermo Fisher Scientific, Waltham, MA). Immunoblotting was performed as described previously [15]. Briefly, lysates were subjected to 4-12% SDS-PAGE and transferred to a PVDF membrane. Membranes were incubated with respective primary phospho- and total antibodies diluted in 1x TBS, 5% dry milk, 0.1% Tween-20 (1:1000) overnight at 4°C on a shaker, and then with secondary antibody (peroxidase-conjugated anti-rabbit or anti-mouse) (1:5000). Western blot was incubated with ECL and the bands were visualized using an imager (Azure 500, Dublin, CA) and quantified using Image J. Densitometric analysis was performed by normalizing the respective bands to the loading control.
Real-time quantitative PCR
Gene expressions in all three murine and human melanoma cell lines with or without genetic knockdown of CysLT1R were determined by qPCR performed using LightCycler 480 (Roche). Total RNA was isolated from the cells after respective treatments and cDNA synthesis was performed as preciously described [24]. qPCR was performed using the primers mentioned in supplementary table 1. The expression levels of respective genes relative to GAPDH were analyzed and the 2-ΔCp values were calculated and expressed as a relative expression or fold change compared to the control.
Cell proliferation
To determine cell proliferation, 104 cells per well of melanoma cells were stimulated with LTD4 (10 nM or 100 nM) with or without MK571 (1 µM), PD98059 (50 µM), LY294002 (50 µM), BIRB0796 (1 µM), and verteporfin (1 µM) for 72 h. Proliferation was measured after the incubation period using the BrdU assay, according to the manufacturer’s protocol. BrdU label was added 24 h before the termination of the incubation.
2D cell migration
Melanoma cell migration was determined using the scratch wound assay. 104 cells (B16F10 and WM266-4) per well were seeded in a 96-well plate. When the cells reached almost 100% confluency, a scratch was made in the center of each well using the WoundMakerTM. Cells were stimulated with LTD4 (10 nM or 500 nM), and each treatment had a minimum of 6 replicates. Plate was then transferred to IncuCyte® S3 Live-Cell Analysis System to capture the closure of the scratch wound by the cells over a period of 24-48 h. Results were analyzed using Olyvia software.
2D cell invasion
Melanoma cell invasion was determined using a transwell assay. 3 × 10⁵ cells in 200 µL serum-free media were seeded on Matrigel® pre-coated trans-well inserts of 8.0 µm pore size placed in a 24-well plate. The bottom chamber was supplied with 750 μL of 10% FBS media acting as a chemoattractant for invading cells. Both top and bottom chamber media received stimulations with or without LTD4 (100 nM), MK571 (1 µM), PD98059 (50 µM), and verteporfin (1 µM). The plate was incubated for 24 h in a 5% CO2 humidified environment at 37°C. To end the experiment, cells on the bottom of the trans-well insert were fixed with 4% PFA for 15 min followed by staining with 0.1% crystal violet solution for 30 min. Cells on the top of the membrane were physically removed using a cotton swab. Membranes were then mounted onto glass slides, and five sites were randomly imaged under a light microscope. For quantification, membranes were de-stained with 100% methanol for 15 min. Intensity of crystal violet in methanol solution determined by the absorbance reading (590 nm) was considered to be directly proportional to the number of invaded cells.
Cys-LT ELISA
Concentration of cys-LTs in the supernatant of YUMM1.7, B16F10, and WM266-4 cells treated in the presence or absence of TNF-α (10 ng/mL) for a period of 12 h for YUMM1.7 and WM266-4 cells, and 24 h for B16F10 cells, was assayed using cys-LT ELISA kit from Cayman chemicals, Ann Arbor, MI, according to the manufacturer’s protocol.
Ectopic tumor model
For in vivo ectopic tumor induction, B16F10 and YUMM1.7 cells (106 per flank of each mouse) were subcutaneously injected under the flank of 6-8-week-old WT and Cysltr1–/– mice with 27-G needles. Tumor volume was measured using a digital caliper at 7, 14, 18 and 21 days after tumor cell injections. Tumor volumes were determined using the formula 4/3*π*(l/2)*(w/2)2, where “l” is the longest diameter and “w” is the perpendicular length of the tumor. On day 21, mice were euthanized, and primary tumors were harvested.
Orthotopic tumor model
To mimic the natural tumor microenvironment, we performed intradermal implantation of melanoma cells in mice. 0.1×10⁶ YUMM1.7 cells in 50 μL of HBSS media were intradermally injected into each flank of WT and Cysltr1−/− mice of either sex with 30-G needles. Tumor volumes were measured as above. Mice were euthanized on day 21, and tumors were harvested. RNA and protein were isolated from the tumors, and qPCR and western blot were performed to analyze the expression of YAP, LOXL-2, and ECM markers.
Pharmacological inhibition of CysLT1R in vivo
After ectopically or orthotopically inducing tumors in WT mice using YUMM1.7 and B16F10 cells, when tumors were palpable on the seventh day (around 100mm3), WT mice were divided into 2 cohorts. First cohort of mice received 150 µL of saline by intraperitoneal (i.p) injection, whereas the second cohort received MK 571 (3 mg/kg of body weight in 150 µL of saline) by intraperitoneal (i.p) injection. Saline and MK571 were administered every three days till day 21, when mice were euthanized, and primary tumors were harvested. Tumor volumes were measured as previously described. Upon euthanasia, RNA and protein were isolated from tumors and analyzed for the same markers as above.
Statistical analysis
All results are representative of at least three independent experiments performed, and data were expressed as mean ± SD except where otherwise indicated. D’Agostino & Pearson test was performed to test if the sample distribution is normal, and significance was determined using Student t-test for two groups and one-way analysis of variance (ANOVA) for more than two groups, followed by Tukey’s multiple comparisons test for post hoc analysis using GraphPad Prism 8.
