


Patient characteristics comparing STAS+ versus STAS−
Between 1 January 2016 and 31 March 2024, 378 patients with stage 1 LUAD were included, of whom 205 (54.2%) were STAS+ and 280 (74.1%) were EGFR-mutant. Of 729 patients diagnosed with stage 1 LUAD at our institution during the study period, 584 (80.1%) had documented STAS assessment. Of these, 378 patients with at least 2 years of follow-up post-surgery were included in this study, representing 64.7% of those with documented STAS status (Supplementary Table S1). Table 1 summarises the clinicopathologic characteristics comparing STAS+ and STAS − . Most patients had a lobectomy performed (86.5%), with lobectomy being performed more frequently in STAS+ patients (90.2% versus 82.1%, p = 0.024). Comparing STAS+ and STAS − , there was no significant difference in median age, ethnicity, the proportion of never-smokers, females and EGFR mutation subtype. In contrast, STAS+ tumours were more frequently associated with stage 1B disease (40.0% versus 22.0%, p < 0.001), lymphovascular invasion (LVI) (30.7% versus 9.2%, p < 0.001 comparing LVI present versus absent), poorly differentiated histological grade (18.5% versus 2.9%, p < 0.001 comparing poorly differentiated versus well/moderately differentiated) and micropapillary or solid predominant adenocarcinoma subtypes (10.7% versus 1.2%, p < 0.001 comparing micropapillary/solid versus all other subtypes). STAS+ tumours also showed significantly higher PD-L1 expression, with 46.4% having PD-L1 TPS ≥ 1% versus 27.2% in STAS− tumours (p < 0.001 comparing PD-L1 TPS ≥ 1% vs <1%.
Table 1 Patient characteristics stratified by STAS status.
Patient characteristics comparing EGFR-mutant versus EGFR-wildtype
Patient characteristics stratified by EGFR mutation status are summarised in Supplementary Table S2. Compared with EGFR-wildtype tumours, EGFR-mutant LUAD had a higher proportion of never-smokers (77.5% versus 54.1%, p < 0.001) and stage 1B disease (35.0% versus 22.4%, p = 0.023). Adenocarcinoma subtype distributions differed significantly by EGFR status (p < 0.001). Acinar/papillary-predominant histology was more common in EGFR-mutant than EGFR-wildtype tumours (81.1% vs 52.1%; p < 0.001), whereas micropapillary/solid-predominant histology was more common in EGFR-wildtype than EGFR-mutant tumours (14.3% vs 3.6%; p < 0.001). EGFR-wildtype tumours were also numerically more frequently poorly differentiated than EGFR-mutant tumours (15.3% vs 10.0%), although this difference did not reach statistical significance (p = 0.13). EGFR-wildtype tumours exhibited significantly higher PD-L1 expression than EGFR-mutant tumours, with PD-L1 TPS ≥ 1% observed in 52.0% versus 32.5% of tumours, respectively (p = 0.002). Among EGFR-wildtype tumours, other oncogenic alterations were detected in 27.6% (27/98) of patients, including ALK rearrangements (9.2%), KRAS G12C mutations (7.1%), RET rearrangements (5.1%), ROS1 rearrangements (4.1%), and BRAF V600E mutations (2.0%). Adjuvant systemic therapy was administered in fewer than 5% of patients in both groups (Supplementary Table S2).
Disease-free survival by STAS and EGFR status
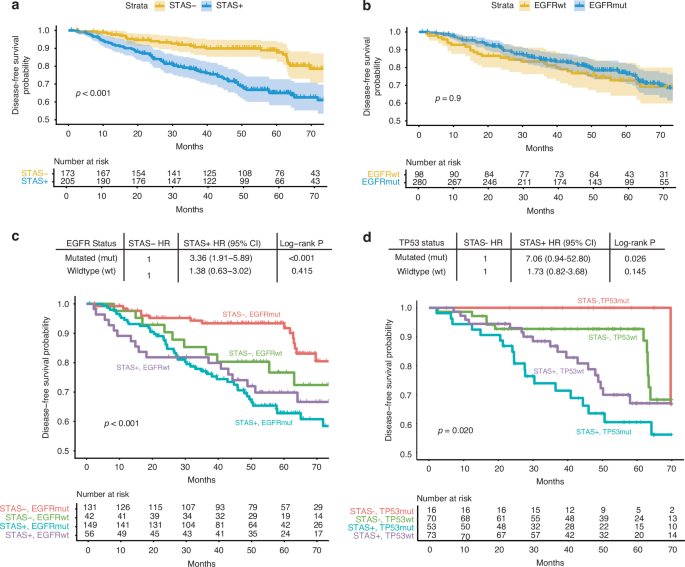
In the overall cohort, patients with STAS+ tumours demonstrated significantly inferior DFS compared with those with STAS− tumours (Fig. 1a). The estimated 2-year DFS was 85.5% (95% confidence interval [CI] 80.8–90.5) in the STAS+ group versus 94.0% (95% CI 90.4–97.7) in the STAS− group (p = 0.009), while the corresponding 5-year DFS rates were 65.0% (95% CI 58.1-72.7) and 88.9% (95% CI 84.0-94.1), respectively (p < 0.001). When the analyses were performed separately for stage 1 A and stage 1B disease, STAS+ was consistently associated with significantly inferior DFS (Supplementary Fig. S1A and S1B). In contrast, DFS did not differ significantly between EGFR-mutant and EGFR-wildtype tumours (p = 0.9) (Fig. 1b). When survival was examined separately by EGFR and STAS status, STAS+ was associated with significantly inferior DFS in EGFR-mutant patients (5-year DFS 62.8% versus 93.4%, p < 0.001). A similar trend was observed in EGFR-wildtype patients (5-year DFS 69.8% versus 76.7%, p = 0.415), though statistical significance was not reached, likely reflecting the smaller subgroup size and limited number of events (Fig. 1c). To assess whether the prognostic impact of STAS was confounded by TP53 co-mutation enrichment, DFS was further stratified by both STAS and TP53 mutation status. Among patients with available TP53 co-mutation status, STAS+ was significantly associated with inferior DFS in TP53-mutated tumours overall (p = 0.026, Fig. 1d) and in the stage IA subgroup (p = 0.018, Supplementary Fig. S1C). In the stage IB subgroup, a similar trend was observed but did not reach significance, likely due to the small sample size in this subgroup (HR 1.89, p = 0.55, n = 18 STAS+ versus n = 4 STAS − , Supplementary Fig. S1D). In TP53-wildtype tumours, no subgroup reached statistical significance, although a trend toward inferior DFS with STAS+ was observed overall (HR 1.73, p = 0.145, Fig. 1d) and in stage IB disease (HR 2.57, p = 0.12, Supplementary Fig. S1D), but not in the stage IA subgroup (HR 0.63, p = 0.488, Supplementary Fig. S1C). Together, these findings suggest that the prognostic association between STAS and DFS was observed more consistently in TP53-mutated tumours, though the relationship between STAS and DFS in TP53-wildtype tumours will need further evaluation in a larger cohort.
Fig. 1: Disease-free survival by STAS and EGFR status.
a DFS stratified by STAS status. b DFS stratified by EGFR mutation status. c DFS stratified by STAS and EGFR mutation status. d DFS stratified by STAS and TP53 co-mutation status. DFS, disease-free survival; STAS, spread through air spaces; EGFR, epidermal growth factor receptor.
Univariable and multivariable regression analyses were performed to identify clinicopathologic features associated with DFS (Table 2). After adjustment for stage, surgery type, TP53 mutation status, LVI, EGFR mutation status and adjuvant therapy, STAS+ and sublobar resection were significantly associated with inferior DFS on multivariable analysis (HR 2.32, 95% CI 1.16–4.63; p = 0.017 and HR 2.64, 95% CI 1.12–6.22; p = 0.026, respectively) (Table 2). When the regression analysis was repeated for the full cohort of patients, including those without TP53 mutation status available, both stage 1B and STAS+ emerged as independent predictors of inferior DFS on multivariable analysis (Supplementary Table S3). In exploratory analysis, among 63 patients with known sites of recurrence, distant metastases comprised a higher proportion of recurrence sites in STAS+ compared with STAS− tumours (66.7% versus 53.3%, p = 0.373), whereas local recurrence was more frequent in STAS− tumours (46.7% versus 33.3%, p = 0.373). When restricted to the 55 patients who underwent lobectomy, a similar pattern was observed, with a higher proportion of distant metastases in STAS+ tumours (69.8% versus 58.3%, p = 0.499) and more local recurrence in STAS− tumours (41.7% versus 30.2%, p = 0.499). Given the modest number of patients with known recurrence sites available for this exploratory analysis, definitive conclusions on the implications of STAS+ on recurrence patterns need to be confirmed in a larger, independent cohort.
Table 2 Univariable and multivariable analyses of features associated with DFS.
Genomic and transcriptomic features associated with STAS+
A total of 212 patients had WES and RNA-seq performed, with the corresponding Oncoprint comparing genomic, transcriptomic and clinicopathologic features between STAS+ and STAS− shown in Fig. 2. STAS+ tumours demonstrated a higher frequency of TP53 mutations compared with STAS− tumours (42.1% versus 18.6%, p < 0.001). Additional co-mutations enriched in STAS+ tumours included CUX1 (7.1% versus 0%, p = 0.012), BRCA2 (5.6% versus 0%, p = 0.043), BCL11B (5.6% versus 0%, p = 0.043) and ATM (5.6% versus 0%, p = 0.043), although these alterations occurred at lower frequencies. Consistent with these findings, STAS+ tumours exhibited greater genomic instability, with whole genome doubling (WGD) observed in 59.5% of STAS+ compared with 41.9% of STAS− tumours (p = 0.012), alongside higher tumour mutational burden (median 2.58 versus 2.25 mutations/Mb, p = 0.010) as shown in Fig. 2 and expanded in Supplementary Fig. S2A and S2B. At the transcriptomic level, STAS+ tumours demonstrated a marked shift toward non-TRU transcriptomic subtypes, with PP and PI phenotypes observed in 55.7% of STAS+ compared with 23.3% of STAS− tumours (p < 0.001). In contrast, the TRU transcriptomic subtype predominated in STAS− tumours, accounting for 76.7% of cases versus 44.3% among STAS+ tumours (p < 0.001) as shown in Fig. 2 and expanded in Supplementary Fig. S2C. STAS+ tumours also showed significantly higher PD-L1 expression, with 47.8% having PD-L1 TPS ≥ 1% versus 25.3% in STAS− tumours (p = 0.005) as shown in Supplementary Fig. S2D. Although the top five most significantly different copy number alterations identified in Fig. 2 were more frequent in STAS− tumours, the overall genomic instability index (GII) was higher in STAS+ tumours (Supplementary Fig. S2E). As these copy number alterations were observed almost exclusively in EGFR-mutant tumours, we assessed whether their enrichment in STAS− tumours reflected the modestly higher proportion of EGFR-mutant tumours in this group (94.2%, 81/86) compared with STAS+ tumours (83.3%, 105/126). When the analysis was restricted to EGFR-mutant tumours only, STAS− tumours remained significantly enriched for focal deletions (5/81 versus 0/105, p = 0.015) and for gains in RAP1B (9/81 versus 3/105, p = 0.033), IL21R (8/81 versus 2/105, p = 0.022), IL32 (12/81 versus 6/105, p = 0.046), and NBPF1 (9/81 versus 3/105, p = 0.033), indicating that this pattern is not attributable to differences in EGFR mutation frequency alone. These findings indicate that while these specific copy number alterations arise predominantly in the context of EGFR mutations, STAS − EGFR-mutant tumours harbour these focal alterations more frequently than STAS + EGFR-mutant tumours, whereas STAS+ tumours overall carry a greater burden of copy number alterations distributed across the genome.
Fig. 2: OncoPrint plot comparing STAS+ and STAS − LUAD by clinicopathologic characteristics, genomic features such as TMB, WGD and transcriptomic subtype.
Among the cancer driver genes with p-value < 0.05, top 5 most significantly different co-mutations and copy number alterations are highlighted. STAS, spread through air spaces; PD-L1 TPS IHC, programmed death ligand 1 tumour proportion score immunohistochemistry; TMB, tumour mutational burden; WGD, whole genome doubling; NA, not available.
When these analyses were repeated stratified by EGFR mutation status, the associations between STAS+ and increased frequency of TP53 mutations, WGD, non-TRU transcriptomic subtype and PD-L1 expression were consistent across EGFR-mutant and EGFR-wildtype LUAD, although statistical significance was not reached in the EGFR-wildtype subgroup, likely reflecting smaller sample sizes (Supplementary Fig. S3A-D). Similarly, when comparing STAS+ and STAS− within stage 1 A and stage 1B LUAD, generally consistent patterns were observed (Supplementary Fig. S4A-D). The difference in TP53 co-mutation frequency between STAS+ and STAS− tumours was more pronounced in stage 1 A LUAD (51.5% versus 17.7%, p < 0.001) than in stage 1B LUAD (31.0% versus 22.2%, p = 0.56). In contrast, WGD was significantly more frequent in STAS+ compared with STAS− tumours in stage 1B LUAD (63.8% versus 33.3%, p = 0.030), whereas this difference did not reach statistical significance in stage 1 A disease (55.9% versus 44.1%, p = 0.230).
Gene expression pathways associated with STAS+
Gene expression analysis comparing STAS+ and STAS− stage 1 LUAD identified multiple genes significantly upregulated in STAS+ compared with STAS− tumours (Fig. 3a). Gene set enrichment analysis (GSEA) demonstrated significant enrichment of pathways related to DNA replication and cell cycle processes in STAS+ tumours (Fig. 3b). In contrast, STAS− tumours showed relative enrichment of pathways related to metabolic processes and homeostasis (Fig. 3b), indicating distinct biological processes between STAS+ and STAS − LUAD. At the individual tumour level, enrichment of DNA replication–related gene sets co-occurred with genomic instability features in STAS+ tumours, including WGD and TP53 co-mutations (Fig. 3c). When GSEA was repeated stratified by TP53 mutation status, STAS+ tumours consistently demonstrated upregulation of cell cycle–related pathways compared with STAS− tumours regardless of TP53 mutation status (Supplementary Fig. S5A and S5B). Enrichment of DNA replication pathways was observed predominantly in TP53-mutant STAS+ tumours, whereas immune-related pathways were enriched in TP53-mutant STAS− tumours (Supplementary Fig. S5A). To determine whether this was influenced by tumour cellularity, we compared tumour purity between STAS+ and STAS− tumours within each TP53 group; purity was comparable between groups in both TP53-mutant (p = 0.79) and TP53-wildtype tumours (p = 0.48, Supplementary Fig. S6), indicating that differences in tumour cellularity are unlikely to account for the immune-pathway enrichment observed in TP53-mutant STAS− tumours.
Fig. 3: Gene expression pathways associated with STAS.
a Volcano plot showing DEG between STAS+ and STAS − LUAD, with 15210 genes in total. Genes with logFC >0.5 and adjusted p-value < 0.05 are highlighted in the red dots. b GSEA of top 5 significantly up- and down-regulated pathways between STAS+ and STAS − LUAD using the Hallmark and Gene Ontology Biological Process gene sets. c Heatmap showing ssGSEA scores of the leading-edge genes in the 4 DNA replication-related pathways, along with GD status and TP53 mutation status. WGD, whole genome doubling; DEG, differentially expressed genes; STAS, spread through air spaces; logFC; log fold change, GSEA, gene set enrichment analysis; GOBP, gene ontology biological process; replica, replication; Reg, regulation; ssGSEA: single sample gene set enrichment analysis.
