


Meningiomas and clinical data
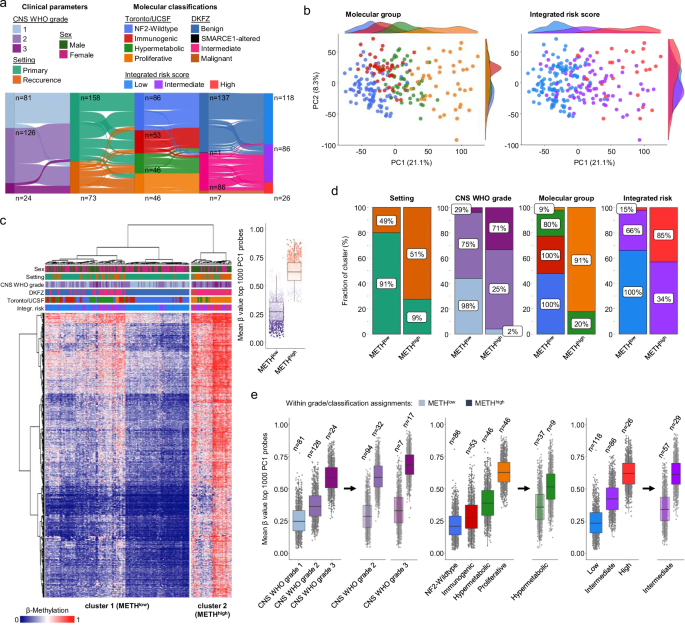
The Independent Review Board of the University Hospital Tübingen and the Medical Faculty of the Eberhard Karls University of Tübingen, Germany, approved the collection and use of tumour material and clinical data for research purposes (application numbers 191/2021BO2, 116/2018BO2 and 456/2009BO2). Patients provided written informed consent to the use of tumour material and clinical data for research purposes. This consent includes publication of the associated data. Meningioma samples from the Discovery cohort were selected from patients treated at the University Hospital Tübingen. This cohort includes a total of 231 primary or recurrent meningioma samples, including 81 CNS WHO grade 1, 126 CNS WHO grade 2, and 24 CNS WHO grade 3 cases. The following clinical parameters were available for all samples: sex, age, clinical setting (primary vs. recurrent), 2021 CNS WHO grade, classification by histology, brain invasion status, extent of resection (EOR), status on prior and adjuvant radiotherapy, and H3K27me3 status. Information on sex was available based on self-report. Analysis of tissue histology, including estimation of tumour content as well as grading based on morphological features, has been performed by an experienced neuropathologist. Clinical follow-up was available for 219 meningiomas with a median follow-up of 35 months. Progression-free survival (PFS) was defined as the period between surgical resection and the time of progression (date of MRI indicating progression). The same definition of PFS was applied to both primary and recurrent tumours. Patients without progression were censored at the last follow-up. Across the Discovery cohort, 111 patients experienced disease progression during follow-up, either restricted to the local surgical bed (94.6%), both local and intracranially distant (3.6%), or only intracranially distant (1.8%). The Longitudinal cohort comprised a total of 42 meningioma samples from 18 patients. Each patient contributed a meningioma sample from first presentation (primary), and from first recurrence. For a total of six patients, a sample from the second recurrence was available. For all meningiomas included in our study, progression was verified by MRI imaging. A total of 129 samples included in the Discovery cohort were available as tissue microarrays used for immunohistochemistry. Furthermore, an additional 529 meningioma samples on tissue microarrays as part of the Tübingen meningioma cohort with clinical follow-up data were used for immunohistochemistry.
Analyses of progression-free survival
Clinical follow-up was available for 219 out of 231 meningiomas from the Discovery cohort. Univariate and multivariate survival analyses were performed using the survival R package (v3.8-3) using Cox proportional hazards regression modelling. We performed survival analysis for each coefficient individually, and all variables scoring as significant in univariate analysis were included in a multivariate Cox proportional model. Cox proportional hazards assumption was tested using the ggcoxzph function implemented in the survminer R package (v0.5.0). The following covariates were included for modelling: age, sex, tumour setting, CNS WHO grade, extent of resection (EOR), brain invasion, adjuvant radiotherapy (RT), H3K27me3, and methylation cluster. Sex violated the assumption, and Cox models were accordingly stratified by sex to account for this violation. Sex was evaluated as a clinical covariate in survival analyses. However, the study was not designed or powered to assess sex-specific effects of the methylation signature, and no formal interaction analyses were performed. Adjuvant RT administered after baseline was modelled as a time-dependent covariate using counting-process methods (tstart-tstop methods) to properly account for the timing of treatment during follow-up. Furthermore, we stratified by tumour setting (primary vs. recurrent) in multivariate Cox regression models, assuming different baseline hazards for each group while estimating the effects of all other covariates across the full cohort. Nonlinear associations between the continuous DNA methylation cluster signature and risk of progression were modelled using restricted cubic splines with three knots, allowing flexible modelling of potential nonlinear relationships while avoiding overfitting. To assess the prediction performance of individual models, we employed both the concordance index (c-index) and the Brier score as implemented in the survival package. Additionally, we assessed the integrated discrimination improvement (IDI) and net reclassification improvement (NRI) using the survIDINRI R package (v1.1-2)58.
DNA methylation profiling and analysis
For both the Discovery and the Longitudinal cohort, genomic DNA was extracted from FFPE material using the blackPREP FFPE DNA Kit (Innuscreen), and DNA was processed on the MethylationEPIC v2.0 BeadChip (Illumina) according to the manufacturer’s instructions at the Microarray Core Facility of the DKFZ in Heidelberg. Downstream analyses were performed in R (v4.4.2) with the SeSAMe package (v1.24.0). Samples with inferior quality, as assessed by abnormal median methylation intensities, unusual β value distribution and mean detection P value < 0.05, were excluded. Probes were filtered using the standard SeSAMe preprocessing pipeline consisting of normal-exponential out-of-band background normalisation, nonlinear dye bias correction, detection P value assessment using pOOBAH, and standard β methylation value calculation. All probes with missing data in any sample after probes masking were excluded from further analysis, generating a complete case dataset. Methylation probes targeting sex chromosomes were disregarded. After preprocessing and filtering, a total of 527,352 probes were retained for further analysis in the Discovery cohort.
We considered time of genomic DNA isolation, EPICv2 array runs, tumour content on tissue sections, and age of the paraffin block as potentially confounding technical artifacts. These potential technical confounders were evaluated using PERMANOVA on multivariate methylation distances, with PERMDISP used to assess homogeneity of dispersion. All factors identified to represent a real confounding factor were corrected using the removeBatchEffect function from the limma package in R.
Principal component analysis (PCA) was performed using the prcomp function in R with parameters centre = TRUE, and scale. = TRUE. We found that the total number of most meaningful components was not majorly affected by the number of top variable DNA methylation probes. In order to select for probes most associated with adverse clinical outcome, we investigated which principal component was best able to discriminate meningioma samples based on previous classification schemes predictive of clinical outcome, including CNS WHO grading6, molecular groups as defined by colleagues from Toronto19, and integrated risk score25. As a measure of discrimination alongside a given principal component, we calculated the weighted pairwise mean overlap of distributions of distinct grades, groups, and risk scores. This was done for the top 10,000, 50,000, and 200,000 most variable probes. The best separation of clinically relevant subgroups was seen alongside PC1 in the 10,000 probes dataset, which was used for all downstream analyses.
Probes contributing to PC1 were extracted and used for unsupervised hierarchical clustering. For several top-scoring probe subsets, the optimal number of clusters k was evaluated using both the Elbow method, based on within-cluster sum of squares, and the Silhouette method, based on average silhouette width across samples. Following cluster number selection, consensus clustering was applied to each probe subset using a resampling-based framework to evaluate clustering stability. ConsensusClusterPlus59 was used to generate consensus matrices and final cluster assignments, from which consensus cluster prediction (CCP) scores were calculated to quantify within-cluster stability. In addition, concordance of tumour cluster assignments across different probe subsets was assessed using the adjusted rand index. Findings on methylation clusters from the Discovery cohort were validated in a larger meningioma cohort (n = 565) from UCSF20, comprising 456 primary and 109 recurrent tumours, with 388, 142, and 35 cases being CNS WHO grade 1, 2, or 3, respectively.
Global DNA methylation profiles were used for the prediction of molecular-based classification of meningiomas as defined by previous groups. DKFZ groups18 were assigned using the Heidelberg CNS Tumour Methylation classifier (v12.8) previously available at www.MolecularNeuropathology.org. DKFZ groups and other classification schemes derived from DNA methylation data alone or from an integration of various data levels are referred to as molecular classifications within our manuscript11. When referring to molecular groups derived from DNA methylation patterns within our manuscript, we stick to the proposed nomenclature employed by colleagues from Toronto19 unless otherwise stated. We used a machine learning approach to assign meningiomas from our cohorts to Immunogenic, NF2-Wildtype, Hypermetabolic, and Proliferative molecular groups based on a previous cohort19. As a default, we selected the top 10,000 methylation probes to set up a classifier with the following algorithms available within the caret R package (v7.0-1): random forest, support vector machine, k-nearest neighbours, nearest shrunken centroids and stochastic gradient boosting. The final model was selected based on the highest accuracy. The selected classifier was then applied to our human meningiomas. Methylation cluster assignment for meningioma samples outside of our Discovery cohort was assigned accordingly. Models were trained and evaluated using 10-fold cross-validation implemented in the caret package, with accuracy used as the primary tuning metric and Cohen’s kappa reported as a complementary measure of agreement. For binary outcomes, discriminative performance was further assessed using standard receiver operating characteristic (ROC) analysis. For multiclass outcomes, ROC analysis was performed using a one-vs-rest strategy with micro-averaging, based on cross-validated hold-out predictions. Integrated risk scores were calculated as previously described25.
For integrated analyses of normal meninges and meningiomas, data from meningeal tissue of both dura and leptomeninges covering five different intracranial locations from two healthy donors was retrieved30. Only probes present on the EPIC (meninges) and EPIC v2.0 array (meningiomas) were used. Prior to PCA analyses, we defined probes that significantly contribute to the variance between normal meninges and meningioma settings (Primary w/o recurrence, Primary w/ recurrence, and recurrence) (n = 113,047), or only in between meningioma settings (n = 19,142), using F-test global statistics. K-means clustering of samples was performed using the fviz_nbclust function of the factoextra R package (v1.0.7). Differential DNA methylation in meningioma methylation clusters, or in between meningiomas, as compared to normal meninges, was assessed using the DML function implemented in the SeSAMe package. These analyses were conducted at the single-CpG level using previously calculated β-values. Statistical significance was assessed with P values adjusted for multiple testing using the Benjamini-Hochberg false discovery rate. CpG sites with an absolute estimated β-value difference of 0.2 for a given contrast and adjusted P value of <0.05 were considered differentially methylated. Trajectory analysis in PCA plots defined by DNA methylation probes varying between meningioma settings and corresponding pseudotime analyses were performed using the slingshot package (v2.14.0)31,60. As an additional sensitivity analysis, we computed patient-level centroids of samples in PCA space and used those for trajectory inference to account for non-independence of samples from the same patient.
Copy number variant analysis
CNV profiles from DNA methylation data were generated using the conumee2 (v2.1.2)26 package in R. CNVs were estimated by comparing samples from the Discovery or the Longitudinal cohort to a series of 121 normal CNS tissue samples24 and calculation of log2 ratios of signal intensities. We considered all absolute ratios >0.3 a potential CNV. For broad chromosomal aberrations, we considered CNVs covering at least 5% of the corresponding chromosome arm61. Unfavourable broad CNVs were defined as previously described11. CNVs in large cohorts were summarised using the CNV.summarplot and CNV.heatmap functions from conumee2. To correlate CNV profiles with clinical behaviour, we considered overall genome instability or the presence of several unfavourable CNVs previously described11. We used the CNV.focal function to reveal genes affected by CNVs in each meningioma sample. Due to the high number of genes affected in most malignant meningioma samples, we focused the analysis of gene-specific CNVs on genes from the Cancer Gene Census29. For correlation analyses, genomes were binned by 300,000 bp segments, and log2 signal intensity ratios were calculated for each bin of each sample as compared to normal CNS tissue samples. Pairwise pearson correlation coefficients were calculated based on intensity ratios.
TERT promoter sequencing
To analyse TERT promoter hotspots (c.−124C>T (C228T), c.−146C>T (C250T)), targeted multigene mutation screening was performed by Next Generation Sequencing (Ion GeneStudio S5, Thermo Fisher Scientific, Waltham, MA, USA) using an AmpliSeq Custom panel (hotspot regions in BRAF, CTNNB1, GNA11, GNAQ, KIT, KRAS, MAP2K1, NRAS, PDGFRA, and TERT (promoter region)). To analyse TERT hotspots solitarily, only pool 1 of the panel was used. Amplicon library preparation and semiconductor sequencing were done according to the manufacturers’ manuals using the Ion AmpliSeq Library Kit v2.0, the Ion Library TaqMan Quantitation Kit on the QuantStudio 5 (Thermo Fisher Scientific), the Ion 540 Kit – Chef on the Ion Chef, and the Ion 540 Chip Kit (Thermo Fisher Scientific). Output files were generated with Torrent Suite 5.18. Variants were visualised using the Integrative Genomics Viewer (IGV; Broad Institute, Cambridge, MA; Version 2.19.7) to detect TERT mutations.
Gene expression profiling
Gene expression profiling was performed for a total of 10 meningioma samples, five METHlow and five METHhigh cases. Total RNA was isolated from FFPE meningioma tumour material using the RNeasy FFPE Kit (Qiagen). For RNA sequencing, mRNA fraction was enriched using polyA capture from 200 ng of total RNA using the NEBNext Poly(A) mRNA Magnetic Isolation Module (NEB). Next, mRNA libraries were prepared using the NEB Next Ultra II Directional RNA Library Prep Kit for Illumina (NEB) according to the manufacturer’s instructions. The libraries were sequenced as paired-end 50 bp reads on an Illumina NovaSeq6000 (Illumina) with a sequencing depth of approximately 25 million clusters per sample. RNA raw data QC and processing were performed using megSAP (version 0.2-135-gd002274) combined with ngs-bits package (version 2019_11-42-gflb98e63). Reads were aligned using STAR v2.7.3a to the GRCh37, and alignment quality was analysed using ngs-bits. Normalized read counts for all genes were obtained using Subread (v2.0.0) and edgeR (v3.26.6). Further details can be found under https://nf-core.re/rnaseq. Raw count data was analysed using the DESeq2 (v1.46.0)62 pipeline using standard protocols. For validation of gene expression findings, meningioma samples from the UCSF cohort20 with available gene expression data and methylation data to predict methylation cluster assignment (n = 185) were used and analysed using DESeq2.
Immunohistochemistry of tissue microarrays (TMAs)
Immunohistochemical staining for beta catenin (clone 14, BD Transduction Laboratories #610153, 1:500) on TMA FFPE samples was carried out on a Ventana BenchMark immunostainer (Ventana Medical Systems, Tucson, Arizona, USA) using the OptiView immunohistochemical staining methodology. Heat Induced Epitope Retrieval consisted of cell conditioner CC1 pretreatment for 32 min. The primary antibody was incubated at 37 °C for 32 min. Antigen-antibody reaction was visualised using the Ventana OptiView Universal DAB Detection kit (OptiView Linker 8 min, HRP Multimer 8 min, H202/DAB 8 min, Copper 4 min). All slides were then counterstained with haematoxylin for 2 min. Histology and immunohistochemistry slides were scanned with a Philips Pathology SG60 scanner and exported as stitched TIFF files for further processing. Scans were further analysed in QuPath (v0.5.1). TMAs were de-arrayed using a grid and annotated. DAB signal was further quantified using default settings of QuPath’s positive cell detection mode. This includes nucleus detection using hematoxylin counterstain, cell expansion from the nucleus to estimate whole cell area, and compartment measurement to quantify nuclear and cytoplasmic intensities.
Cell culture studies
Stable cell lines generated from benign (HBL-52, BEN-MEN-1) and malignant meningiomas (NCH93, IOMM-Lee, KT21-MG1) were used in the study. All cell lines were authenticated by STR profiling. All cell lines were regularly tested negative for mycoplasma. IOMM-Lee cells were purchased from ATCC, BEN-MEN-1 cells were purchased from DSMZ, HBL-52 cells were purchased from Cytion. NCH93 and KT21-MG1 cells were provided by Christel Herold-Mende (University of Heidelberg, Germany) and Christian Mawrin (University of Magdeburg, Germany), respectively. The following media formulation were used: DMEM, 10% FCS, 0.1% gentamycin (NCH93, IOMM-Lee, KT21-MG1), DMEM, 20% FCS, 0.1% gentamycin (BEN-MEN-1), and DMEM/F12, 1x ITS, 10% FCS, 0.1% gentamycin. For overexpression studies, we generated lentiviral particles in HEK293FT cells coding for GFP alone (Addgene #2211811) or in combination with the PCDHG@ member PCDHGC3 (HorizonDiscovery #OHS5897-202619779) and transduced IOMM-Lee and BEN-MEN-1 cells. GFP-positive cells were selected for using fluorescence-associated cell sorting using a BD FACS Diva 9.0.1 machine. For all in vitro cell culture studies, genetic alteration experiments were performed in n = 3 experimental replicates based on different cell stocks and experiments repeated at different time points.
Flow cytometry
The cells were harvested using trypsin and washed in cold PBS by centrifuging at 4 °C at 1200 rpm for 5 min. In order to preserve the cellular structure, the cells were fixed with 4% paraformaldehyde (PFA) in PBS for 15 min at RT, followed by two washing steps in PBS. Next, the cells were divided into two equal proportions for cytoplasmic or whole cell staining. For cytoplasmic staining, we used a mild detergent, 0.1% saponin, that permeabilizes the plasma membrane, for 15 min at RT. For whole cell staining, we resuspended the cells in 0.5% Triton X-100 in 1x FOXP3 permeabilization buffer (Invitrogen, Thermo Fisher Scientific) for 10 min at RT. The cells were then washed and incubated with β-catenin antibody (15B3, PE-conjugated, Invitrogen, 1:50) for 30 min at RT. Finally, the cells were washed and resuspended in 200 µL of FACS buffer (PBS containing 2% FCS and 0.5 M EDTA) and analysed using a MACSQuant Analyser 10 (Miltenyi Biotec). All flow cytometry data were analysed using FlowJo version 10.10.0. FMOs (fluorescence minus one) were used as negative controls for proper gating. Exclusive nuclear-only staining as mean fluorescent intensity (MFI) or percentage of positive cells was calculated on the basis of average values from each replicate by subtracting cytoplasmic from whole cell values.
Confocal microscopy
IOMM-Lee and BEN-MEN-1 cells expressing either GFP or PCDHGC3-GFP were seeded in Lab-Tek 4 chamber slide systems. After 24 h, cells were fixed with PFA for 30 min, permeabilized with 0.1% Triton X-100 in PBS, and blocked in 2% BSA in PBS for 1 h. Primary antibodies against GFP (ab13970, Abcam, 1:500, chicken) and β-catenin (D10A8, Cell Signaling, 1:100, rabbit) were incubated overnight. Cells were incubated with coupled secondary antibodies (donkey anti-rabbit IgG (H + L) Alexa Fluor 555, Invitrogen, 1:500; goat anti-chicken IgY (H + L) Alexa Fluor 647, Jackson ImmunoResearch, 1:500) for 1 h, washed, stained with DAPI, and mounted. Images of fluorescently-labelled cells were acquired using a spinning disk confocal microscope (Cytation C10, BioTek) and quantified with the cellular analysis mode of Gen5 software (version 3.16, BioTek). To analyse region-specific fluorescence signal intensities, a primary mask was generated based on DAPI staining to define cell nuclei, and a secondary mask was applied to encompass the surrounding cytoplasmic region. Mean fluorescence intensity was measured separately within the nuclear (primary) and cytoplasmic (secondary) masks to assess spatial differences in signal distribution. Fluorescence intensity values were exported and further analysed using R for statistical evaluation.
Western blot analysis
Whole cell lysates were prepared using either RIPA (25 mM Tris-HCl pH 7.6, 150 mM NaCl, 1% NP-40, 1% sodium deoxycholate, 0.1% SDS). Protein gels were run using 4-12% NuPAGE Bis-Tris polyacrylamide precast gels. Proteins were blotted onto PVDF or nitrocellulose membranes and detected using the indicated antibodies as per standard methods. Visualisation was done using HRP-coupled, species-specific secondary antibodies. Primary antibodies used in this study for western blotting were the following: anti-PCDHG-pan-gamma (S159-5, Thermo Fisher, 1:500), anti-PCDHGC3 (MAB8364, R&D, 1:250), and anti-GAPDH (D4C6R, Cell Signaling, 1:1000).
Statistics and reproducibility
No statistical methods were used to predetermine sample sizes, but our Discovery and Longitudinal cohort sizes are similar to or larger than those reported in previous publications19,22. Data distributions were tested for normality using the Shapiro-Wilk normality test, and parametric or non-parametric tests were used accordingly. Results were compared using Student’s t test, χ2 test, Mann-Whitney test, Wilcoxon signed-rank test for paired data, or Wald test. For comparisons involving repeated measures, differences between conditions were tested using a linear mixed-effects model for continuous data types, with condition as a fixed effect and subject as a random effect, using a Type III F-test to assess the statistical significance of the condition effect. Pairwise comparisons between conditions were performed using estimated marginal means with Tukey adjustment for multiple testing. For categorical data such as WHO grades involving repeated measures, we used an ordinal mixed-effects model and used a likelihood ratio test to test significance. Investigators for functional studies on β-catenin were blinded to conditions during analysis. All box plots show distributions and underlying data points. Boxes are defined as follows: centre line, median; box limits, upper and lower quartiles; whiskers, extremes within 1.5× interquartile range.
Reporting summary
Further information on research design is available in the Nature Portfolio Reporting Summary linked to this article.
