


Patient recruitment
This study was carried out as part of the PDTO tissue acquisition protocols of the PANORG project and SYNCOPE clinical trial at the Helsinki University Hospital. Patients enrolled in the PANORG protocol also participated in the iCAN Flagship Project through the collection of biobank samples and biobank transfer of PANORG samples.
Patients were enrolled in the study protocols at their first outpatient visit to tertiary cancer care at the Meilahti Hospital (Helsinki, Finland) or Jorvi Hospital (Espoo, Finland). Both hospitals are part of the HUS Comprehensive Cancer Center. Upon written informed consent, CRC tumor tissues and germline DNA references were collected, with the primary function of molecularly characterizing primary tumors and establishing PDTO cultures.
Tissue collection
Primary tumor tissue samples were obtained by a study surgeon either via endoscopic biopsy forceps or a conchotome before any treatment, or via biopsy from surgical specimens potentially exposed to neoadjuvant therapy. The samples were transported to the laboratory site in a transfer medium containing DMEM supplemented with 1% penicillin-streptomycin solution to establish the PDTOs. Tissue specimens were processed within 24 h of collection to minimize the risk of autolysis and tissue degradation.
Primary CRC samples for exome and transcriptome sequencing were collected to Helsinki Biobank from surgically resected specimens at the Department of Pathology. Peripheral blood mononuclear cell reference DNA samples were collected through a biobank as part of the routine laboratory workup for the participants.
PDTO culture
Tumor tissue samples were dissociated mechanically using a P1000 pipette, followed by a 10-min enzymatic digestion with Organoid Digestion Medium. Only mechanical dissociation was used for endoscopic biopsies. Dissociated samples were centrifuged and washed three times with Organoid Wash Medium. After the final centrifugation step, the cell pellets were resuspended in Matrigel (Corning, NY, USA) and plated on a 24-well plate. The plate was incubated at 37 °C for 30 min, and 500 µL of Organoid Culture Medium supplemented with 1 µL/mL Rho-associated coiled-coil containing the protein kinase (ROCK) inhibitor Y-27632 was added. Our success rate in establishing PDTOs from surgical specimens was in agreement with earlier reports of similar sample sizes [7, 9, 10].
PDTOs were incubated at 37 °C with 21% O2 and 5% CO2 and subcultured every 7–10 days for expansion. The Wnt-activating niche factors Wnt-3a and R-spondin were not added to the Organoid Culture medium to select and support the growth of Wnt-independent tumor cells. The critical biomass for a stable organoid line for molecular and phenotypic characterization was achieved early in most cases; however, the expansion phase was continued for 4–6 passages to ensure independence from Wnt-activating supplements. In vitro drug testing was not performed before passage 5 (P5) to minimize the risk of assaying noncancerous PDTOs.
Single-cell RNA sequencing (scRNA-seq) of PDTOs
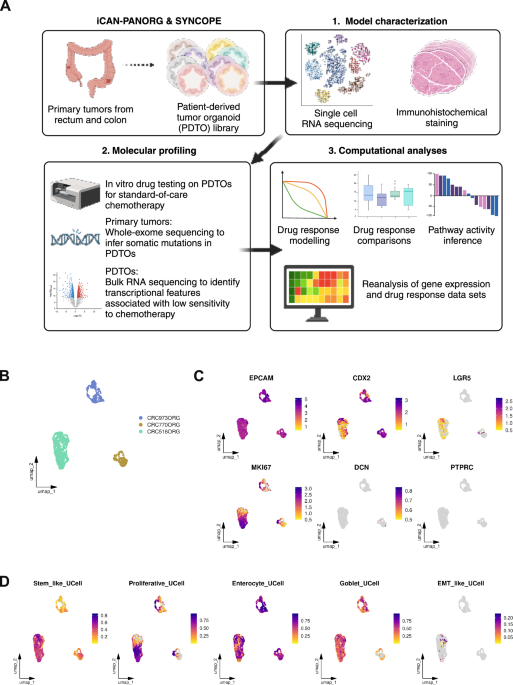
Chromium Fixed RNA Profiling for Multiplexed Samples (10x Genomics) was used to perform single-cell RNA sequencing (scRNA-seq) on PDTOs. Briefly, PDTOs were dissociated into single cells using TrypLE Express (12605036, Gibco) and filtered through a strainer. The Chromium Next GEM Single Cell Fixed RNA Sample Preparation Kit (PN-1000414, 10x Genomics) was used to fix cells at 4 °C for 24 h. Sequencing libraries were prepared using the multiplexed workflow of the Chromium Fixed RNA Kit, Human Transcriptome (PN-1000476, 10x Genomics), and sequenced on a NovaSeq 6000 instrument (Illumina) in paired-end mode.
The cellranger multi pipeline (v.9.0.0) (10x Genomics) was used for demultiplexing, alignment, and counting. Seurat (v.5.0) R package [11] was used to create Seurat objects from the output files. In the first quality-control step, the miQC framework [12] was used to filter low-quality cells in a data-driven manner. In the second quality-control step, cells expressing fewer than 50,000 UMIs were further filtered out.
Downstream analyses were performed without integration, as the PDTO samples were processed and sequenced simultaneously. Data normalization and variance stabilization were performed with Seurat’s SCTransform function, retaining the 3000 most variable features. Dimensionality reduction was carried out by principal component analysis (PCA) using 50 components, and the first 25 principal components were used to construct a k-nearest neighbor graph. Clustering was performed using a graph-based approach across multiple resolutions (0–0.5, step size 0.1). Uniform manifold approximation and projection (UMAP) embedding was generated using the first 25 principal components with 30 neighbors and a minimum distance of 0.2.
In vitro drug testing
5-fluorouracil (S1209, Selleckchem), oxaliplatin (S1224, Selleckchem) and irinotecan (S2217, Selleckchem) were resuspended and stored according to the manufacturer’s instructions. PDTOs were dissociated into single cells, resuspended in an Organoid Culture Medium:Matrigel (9:1) mixture, and plated in 384-well plates. Cells were allowed to recover for 48 h, and organoid formation was assessed visually. Drugs were applied using a digital liquid dispenser (Tecan D300e, Tecan, Zurich, Switzerland) across a logarithmically designed dose range spanning ten concentrations. Dimethyl sulfoxide (DMSO; max. 1%) was used as a negative control for 5-FU and irinotecan, whereas water + 0.3% Tween-20 was used as a negative control for oxaliplatin. Blasticidin (ant-bl-005, Invivogen) was used as the positive control at a final concentration of 10 µg/ml. Four technical replicates were used to correct intraplate variability. PDTOs were treated with drugs for 5 days, and the CellTiter-Glo assay (Promega, Madison, WI, US) was used to assess cell viability on day seven. The luminescence signals were measured using a multimode plate reader (FLUOstar Omega, BMG Labtech).
Whole exome sequencing (WES)
Genomic DNA was isolated from snap-frozen PDTOs using QIAamp DNA Mini kit (#51304, QIAGEN). Library preparation was performed using Twist Library Preparation Enzymatic Fragmentation (EF) kit 2.0 with UDI indexing, utilizing 100 ng of DNA input. Target capture was performed using IDT xGEN reagents and IDT xGen™ Exome Hyb Panel v2. Libraries were sequenced on a Novaseq X instrument (25B flow cell, 2 × 150 bp). Somatic mutations were identified using a validated pipeline A minimum allele fraction of 10% was required for somatic mutation calling and variants that had a GNOMAD frequency higher than 0.5% were filtered out.
Drug response modeling
The average luminescence signal in the blank wells was subtracted from that in each well to calculate the blank-corrected signals. Relative cell viability was calculated using the following formula:
$${Cell}\,{viability}\, \% \,=\,\frac{{Blank}\,{corrected}\,{signal}\,-\,{average}\,{positive}\,{control}\,{signal}}{{Average}\,{negative}\,{control}\,{signal}\,-\,{average}\,{positive}\,{control}\,{signal}}$$
The four-parameter logistic model is arguably the most common statistical method for identifying drug efficacy in vitro [13, 14]. It is often used regardless of the data satisfying the assumptions underlying the model, producing potentially inaccurate point estimates (IC50 or AUC) that are used for downstream analyses. Moreover, IC50 values can only be calculated if the relative cell viability is less than 50% at the highest drug concentration tested [15], a requirement that was not met by many PDTOs in our study. Therefore, we chose to use the nonparametric monotone model of the ENDS tool [13] by fitting the model to the mean responses at each dose. The AUC values were used as point estimates of in vitro drug responses.
Quality control and drug response classification
The dose-response curves were visually evaluated. An assay was considered to have failed if the normalized cell viability was less than 50% at the lowest drug concentration or if the nonparametric model failed (e.g., a flat line was observed). Twelve PDTOs failed assays for all three drugs and were excluded from the downstream analyses. Kernel density estimation (KDE) was used on the AUC values to find two valley points to be used as thresholds for drug response classification. This approach revealed two valley points for fluorouracil, but not for irinotecan and oxaliplatin. As a secondary approach, we used the following classification for irinotecan and oxaliplatin:
if AUC > Q3 ~ “low sensitivity”
elif AUC ≤ Q1 ~ “high sensitivity”
else~“intermediate sensitivity”
PDTOs with missing values were classified as “Unknown”.
Bulk RNA sequencing of PDTOs
The NucleoSpin RNA Plus (MN) kit was used to isolate total RNA from the snap-frozen cell pellets. RNA samples were eluted in nuclease-free water and stored at −80 °C. Total RNA (100 ng) was ribo-depleted using Illumina’s Stranded Total RNA Prep with Ribo-Zero Plus (20040529) and library preparation was completed using standard Illumina protocols. Indexed libraries were pooled and sequenced on an Illumina NovaSeq6000 system (Illumina, San Diego, CA, USA) with one lane of the NovaSeq S4 flow cell (2 × 150 bp).
Preprocessing PDTO bulk RNA-sequencing data
Kallisto (v.0.50.1) was used to extract transcript-level counts from the fastq files. The human transcriptome index constructed from the Ensembl reference transcriptome version 108 was used for quantification (https://github.com/pachterlab/kallisto-transcriptome-indices/releases). The tximport R package (v.1.32.0) was used to summarize transcript-level counts to gene-level and create a count matrix.
Differential expression analysis (DEA) for PDTO bulk RNA sequencing data
The DESeq2 R package (v1.40.2) [16] was used for DEA. Prefiltering was performed to exclude features with fewer than five normalized counts across n samples, where n equaled the lowest number of samples in the groups compared. Sequencing batch was included as a covariate in the design formula. The biomaRt R package (v.2.60.0) [17] was used to convert Ensembl gene IDs to Entrez gene IDs and symbols. The EnhancedVolcano R package (v.1.22.0) [18] was used to create volcano plots to visualize the DEA results.
Pathway activity inference from PDTO bulk RNA-seq data
R implementation of the decoupleR framework (v.1.5.0) [19] was used to infer pathway activities from PDTO bulk RNA-seq data. The PROGENy [20] weights of the top 500 features were retrieved, and the stat values from the DEA results (DESeq2 output) were used as inputs for the multivariate linear model.
Gene set enrichment analysis
For each DEA comparison, gene set enrichment analysis (GSEA) was performed with the fgsea [21] method implemented in the clusterProfiler R package (v.4.12.0) [22], using the curated (C2) and hallmark (H) gene sets available in the Human Molecular Signatures database (MSigDb) [23]. Pathways with Benjamini-Hochberg adjusted p values < 0.05 were considered significantly enriched.
Molecular subtypes of PDTOs
The raw count matrix was filtered to exclude features with zero counts across all samples and variance stabilizing transformation was applied with DESeq2::vst() function with “blind = FALSE” setting. IMF classification was implemented using the CMScaller package [24], using the transformed count matrix as input and the gene sets published by Joanito et al. [25] as the template. The gene sets “iCMS2_Up” and “iCMS3_Down” were combined to form the iCMS2 class, whereas “iCMS2_Down” and “iCMS3_Up” were combined to form the iCMS3 class. PDTO samples were classified as iCMS2 or iCMS3 if the distance between a PDTO sample and the corresponding template was lower than 1000 random permutations of the gene labels (FDR < 0.05). Samples with FDR values higher than the cut-off were defined as “Undefined”.
Reanalysis of the CNP0004138 scRNA-seq dataset
Preprocessed scRNA-seq data from the CNP0004138 project were downloaded from the China National GeneBank Database [26]. The celltypist [27] Python package (v.0.1.9) was used to annotate cell types using the “Immune_All_Low” model. Cells annotated as “Epithelial cells” were retained for downstream analyses. For each treatment stage (pre- and post-treatment), Seurat’s FindMarkers function was used to identify differentially expressed genes between the clinical response groups. Differentially expressed genes overlapping with ISGs were visualized on a lollipop plot.
EPSTI1+ epithelial cells were defined as cells with non-zero normalized EPSTI1 expression. Then, for each sample, the percentage of EPSTI1+ cells relative to all epithelial cells was calculated and stacked bar plots were used to compare EPSTI1+ cell abundances across clinical response groups. To infer pathway activities in epithelial cells, R implementation of the decoupleR framework (v.1.5.0) [19] was used. The PROGENy [20] weights of the top 500 features were retrieved, and normalized gene expression matrix was used as input for the multivariate linear model. Inferred pathway activities were scaled and subsequently used for visualization.
Bulk RNA-seq deconvolution
We applied InstaPrism [28] to infer cell type-specific transcriptome profiles from the GSE209746 and GSE50760 datasets. As a single-cell reference, we used the precompiled CRC_refPhi derived from Pelka et al. [29], which comprises 15 cell types and 98 cell states.
Raw read counts were used as input for deconvolution and epithelial tumor (EpiT)-specific read counts were extracted from the deconvolution output. Variance-stabilizing transformation (vst) was performed with DESeq2. In the GSE50760 dataset, normalized EPSTI1 expression was compared between patient-matched normal colon tissue vs primary tumor and primary tumor vs metastatic tumor pairs. In the GSE209746 dataset, normalized EPSTI1 expression was
compared between the clinical response groups (pCR vs pPR).
EPSTI1 knockdown and overexpression experiments
Caco-2, HCT116, and SW-48 KRAS G12V/+ cells were gifted by Ari Ristimäki’s research group (University of Helsinki). HCT116 and SW48 KRAS G12V/+ cells were grown in RPMI 1640 medium supplemented with 10% fetal bovine serum, 1% GlutaMAX, and 1% penicillin-streptomycin solution. Caco-2 cells were grown in DMEM supplemented with 10% fetal bovine serum, 1% GlutaMAX, and 1% penicillin-streptomycin solution. The Genomics Unit of Technology Center, Institute for Molecular Medicine Finland (FIMM) authenticated these cell lines using the GenePrint24 system (Promega).
RNA interference and plasmid overexpression were used to modulate EPSTI1 expression. Briefly, 3 × 10⁵ cells were plated in a 6-well plate, and on the next day, the cells were transfected with Negative Control siRNA, EPSTI1 siRNA (#4392420, s41293, Ambion), or EPSTI1 ORF (#RG217229, OriGene). Lipofectamine RNAiMAX reagent (#13778030, Invitrogen) was used for siRNA transfections, whereas polyethylenimine (PEI) was used for plasmid transfection.
To assess how EPSTI1 knockdown and overexpression modulates drug response, cells were dissociated with TrypLE reagent (#12605028, Gibco) 72 h after transfection, and 3 × 10³ cells were replated in a 96-well plate in four technical replicates. On the next day, cells were treated with fluorouracil or irinotecan. Three days after drug treatment, alamarBlue cell viability reagent (A50100, Invitrogen) was used to measure cell viability. Cell viability data from were analyzed using a two-way linear model with EPSTI1 knockdown (control siRNA vs EPSTI1 siRNA) and drug treatment (DMSO, fluorouracil, irinotecan) as fixed factors, including their interaction term (viability ~ group × treatment). Interaction p-values were used to assess whether EPSTI1 knockdown altered drug sensitivity. Linear modeling was performed using the lm() function in R.
Reverse-transcription quantitative PCR (RT-qPCR)
RT-qPCR was performed to validate EPSTI1 knockdown and overexpression, as well as ISG expression profiling after drug treatments. In each experiment, total RNA was isolated using NucleoSpin RNA Plus kit (MN) and eluted in nuclease-free water. Equal amounts of total RNA (1000 ng) were reverse-transcribed using High-Capacity cDNA Reverse Transcription Kit (#4368814, Applied Biosystems) following manufacturer’s protocol. Reverse-transcription reactions were performed on a T100 Thermal Cycler (Bio-Rad) or Veriti Thermal Cycler (Applied Biosystems). Quantitative PCRs were performed using PowerTrack SYBR Green Master Mix (A46109, Applied Biosystems), using 20 ng cDNA input per reaction and three technical replicates. RPS13 was used to normalize gene expressions. Delta Ct values were calculated by subtracting the Ct value of target genes from that of RPS13, which are directly proportional to gene expression. Primer sequences are shown in Supplementary Table 3.
Validating chemotherapy-induced ISG expression at protein level
Flow cytometry was used to analyze chemotherapy-induced changes in EPSTI1 protein expression. HCT116 cells were treated with DMSO (solvent control), fluorouracil (1 µM) or irinotecan (1 µM) for 72 h. IFN-gamma (10 ng/ml) was used as a positive control to induce EPSTI1 expression. Cells were fixed with 2% PFA solution for 1 h at RT, blocked with 1X PBS + 2% BSA solution for 15 min at RT, stained with the EPSTI1 antibody (Proteintech, 11627-I-AP, lot: 10619, dilution 1:500) for 30 min at RT, and stained with the Alexa Fluor 488-conjugated goat anti-rabbit IgG secondary antibody (Invitrogen, A-11008, dilution 1:500) for 30 min at RT. Flow cytometry was performed on a CytoFlex instrument and 10,000 events were recorded for each sample. Unstained cells and cells stained with the secondary antibody were used to check background staining. Median fluorescence intensity (MFI) was used to quantify and compare EPSTI1 expression.
For the WB experiment, HCT116 cells were treated with DMSO (0.1% solution, negative control), IFN-gamma (10 ng/ml, positive control), fluorouracil (1 µM), and irinotecan (1 µM). At indicated time points (1, 24, 48, and 72 h), cells were lysed in RIPA buffer supplemented with protease-phosphatase inhibitors (Thermo Scientific, 78440) and incubated on ice for 30 min. Cell lysates were clarified by centrifugation, and supernatant protein concentrations were measured by BCA assay (Thermo Scientific, A65453). Before SDS-PAGE, sample protein concentrations were normalized using RIPA buffer. Sample proteins were resolved on 8–16% SDS-PAGE gels (BioRad, #4568106) with total protein loading of 15 µg per sample. Proteins were transferred to nitrocellulose membranes using semi-dry transfer method (BioRad TransBlot Turbo). Following transfer, membranes were rinsed with TBS and blocked using EveryBlot reagent (BioRad, #12010020). Membranes were incubated with primary antibodies for pSTAT1 (Invitrogen, #33-3400, dilution 1:1000), STAT1 (Cell Signaling Technology #9172, dilution 1:1000) and β-actin (R&D Systems, #MAB8929, 1:2000). For detection, a mixture of goat anti-mouse DyLight800 (Invitrogen, #35521, dilution 1:5000) and goat anti-mouse DyLight680 (Invitrogen, WF328091, dilution 1:5000) was utilized. Between antibody incubations, membranes were washed 3 × 10 min using TBST. Blots were imaged using Odyssey CLx (LI-COR) fluorescence scanner and image densitometry was performed using Image Studio Lite software (LI-COR). Gel and blot total protein loading (BioRad StainFree) were imaged on a Chemidoc MP imaging system (Bio-Rad).
Effect of EPSTI1 knockdown on apoptosis
To determine whether EPSTI1 knockdown induced apoptotic cell death, HCT116 cells were transfected overnight with a negative control siRNA or EPSTI1 siRNA (see section “EPSTI1 knockdown and overexpression experiments”). On the next day, transfection mixture was replaced with normal growth medium or growth medium supplemented with 50 µM pan-caspase inhibitor Z-VAD-FMK (Selleckchem, S7023). Seventy-two hours after transfection, cells and supernatants were collected and stained with Pacific Blue™ Annexin V (BioLegend, 5640918) and propidium iodide according to the manufacturer’s instructions and immediately analyzed on a CytoFlex flow cytometer.
Caspase activity was assessed using Caspase-3/7, Caspase-8 and Caspase-9 Multiplex Activity Assay Kit (abcam, ab219915), which measures the cleavage of target‑specific substrates for caspase‑3/7, caspase‑8, and caspase‑9. Briefly, 3 × 10³ HCT116 cells were plated in a 96-well plate in four replicates and cells were transfected overnight with a negative control siRNA or EPSTI1 siRNA (see section “EPSTI1 knockdown and overexpression experiments”). On the next day, transfection mixture was replaced with normal growth medium or growth medium supplemented with 50 µM pan-caspase inhibitor Z-VAD-FMK (Selleckchem, S7023). Seventy-two hours after transfection, cells were incubated with the corresponding caspase substrate reagent, and fluorescence intensity for each caspase was measured from the same wells on a Tecan Spark multimode microplate reader. For each caspase target, blank wells containing assay reagent without cells were included. The mean blank signal was calculated separately for each caspase, and sample fluorescence values were blank‑corrected by subtracting the target‑specific mean blank intensity.
Immunohistochemistry
Paired biopsy and resection FFPE tissue samples from 15 patients were retrieved from pathology archives and reviewed by a pathologist. Biopsy and resection tissues for each patient were cut onto the same SuperFrost Plus slide at 4 µm thickness at Helsinki University Hospital. Chromogenic immunohistochemistry was performed with 3,3’-Diaminobenzidine (DAB) using Autostainer 480S automated IHC stainer (Epredia, Part No: A80500485) at Tampere University. Candidate antibodies and suitable dilutions were optimized using test tissues consisting of normal human appendix, tonsil and rectum tissues. Appropriate staining patterns were visually confirmed by a pathologist (JV). Single-plex immunohistochemical staining was done in several batches using EPST1 polyclonal antibody (Proteintech, 11627-I-AP, lot: 10619, dilution 1:400), CK20 (clone SP33, abcam, ab64090, lot: 1038252-5, dilution 1:200), CD3 (clone PS1, Neomarkers, MS-401-S1, lot: 401S801L, dilution 1:200), CD8 (clone C8/144B, Dako, M7103, lot: 20066516, dilution 1:200) and CD45 (clone D9M8I, CellTechnologies, 13917, lot: 10, dilution 1:200). Slides were baked for 30 min in 62 °C and dewaxed using Autostainer XL (Leica), followed by heat-induced antigen retrieval with Tris-EDTA-based buffer, pH 9.0 (10 mM (0.01 M) Tris-Base, 1 mM (0.001 M) EDTA Solution, 0.05% Tween 20) at 102 °C for 3 min (Retriever 2100, Aptum Biologics Ltd). Primary and secondary antibodies were incubated for 30 min at room temperature.
The slides were digitized with a 20× objective magnification using NanoZoomer S60 slide scanner (Hamamatsu Photonics, Hamamatsu City, Japan, resolution 0.4417 µm/pixel).
Image analysis for immunohistochemistry
The digitized images of immunohistochemistry slides were processed using QuPath (v.6.0) [30]. Only representative tissue areas with successful staining were included for further analyses, while regions with tissue folds, inadequate staining or out of focus areas were excluded. Tissue compartments were manually annotated and classified into epithelial, stromal, tumor center (CT) and invasive margin (IM) areas. A multi-polygon ROI approach was used, where a single composite annotation per compartment was created for each slide by combining multiple representative sub-regions into one annotation object. Detection accuracy was visually validated by a pathologist (JV).
Regions of interest for EPSTI1 and CK20-stained biopsy and resection samples encompassed epithelial and stromal compartments. CK20 was restricted to epithelial regions since the marker is not expressed in stroma. Both the percentage of tumor cells stained for EPSTI1, and the staining intensity were used in analyses, while CK20 expression was quantified using staining intensity only.
For CD3, CD8 and CD45-stained samples, representative areas from the tumor center and the invasive margin from biopsy and resection tissues were selected for analysis. The invasive margin was defined as a region extending approximately 500 µm into the tumor and 500 µm into the normal tissue from the visible tissue frontier. In cases where insufficient tumor was present to accommodate this width, invasive margin was defined using equal proportional distances (50%/50%) on each side of the tumor-normal boundary.
The built-in cell detection function was used to detect cell staining intensities for EPSTI1 and CK20, and built-in positive cell count function was used to detect immune cells within compartments of interest. Immune cells were recognized by CD3, CD8 or CD45 expression and tumor cells were identified through morphology and CK20 staining.
Statistical testing and data visualization
Statistical analyses and data visualization were performed using R version 4.4.1. The Wilcoxon rank-sum test was used to compare drug response estimates (AUC values) and gene expression between the two independent groups and Wilcoxon signed-rank test was used to compare gene expression between paired samples. The threshold for statistical significance was set to 0.05. Where appropriate, p values were adjusted with Benjamini-Hochberg or Bonferroni procedures.
Heatmaps were created using the ComplexHeatmap (v.2.24.1) package [31, 32] (RRID:SCR_017270). Seurat (v.5.0.0) (RRID:SCR_007322) and scCustomize (v.3.2.4) (RRID:SCR_024675) packages were used to visualize scRNA-seq data. Other plots were created using the ggpubr (v.0.6.2) package (RRID:SCR_021139).
Drug testing on PDTOs was performed once as an exploratory analysis due to the resources required for parallel drug testing and bulk RNA-seq, and to mitigate altered drug sensitivity profiles over prolonged culture time. Flow cytometry experiments to detect EPSTI1 protein expression and apoptosis were performed three times using independent biological replicates. For cell-based assays, biological replicates represent independent cell cultures initiated on different days.
The associations of EPSTI1 expression between patient-paired biopsy and resection specimens within epithelial and stromal compartments were evaluated with Wilcoxon signed-rank test. All reported p values for correlation analyses are BH-adjusted unless otherwise stated.
