


Methods and materials
Every used reagent is of the analytical grade. The following substances were acquired from Aldrich: benzaldehyde (99%), ethylcyanoacetate (98%), hydrazine hydrate (100%), salicylaldehyde (99%), and glacial acetic acid (99%). All of these substances were used without any further purification. The cell lines were acquired from the American Type Culture Collection. The cell lines that were evaluated were colorectal carcinoma colon cancer abbreviated to HCT-116 and hepatocellular carcinoma abbreviated to HePG2. The anticancer medications Doxorubicin and Sorafenib were employed as the benchmark drugs for the purpose of comparison. RPMI-1640 medium, MTT and DMSO (Sigma Company, St. Louis, United States), and fetal bovine serum (GIBCO, United Kingdom) are the reagents that are being used. A CHN analyzer, which is a version 2400 of the Perkin-Elmer manufacturer, was used in order to determine the levels of hydrogen and carbon. The metal content was determined by the use of well-established conventional techniques, namely complexmetric titration, which made use of metallochromic markers such as xylenol orange, EBT, and murexide18. IR spectra were produced using potassium bromide plates on a Thermo Nicolet IS10 spectrometer. The verification of the frequency measurement was accomplished using polystyrene film. The electronic spectra of the ligands and associated complexes were acquired in DMSO using the Unicam UV-Vis spectrometer UV2 employing 1 cm stoppered silica cells. Magnetic susceptibility tests were done using a Sherwood Scientific magnetic balance. The thermal analyses (TG) of the compound and the various metal complexes were done using a Schimadzu Model 50 equipment. Samples were subjected to a heating acceleration of 10 °C/min from the ambient temperature to 800 °C under a 20 cm3/min nitrogen stream. ESR spectrum of Cu2+ complex was recorded using a Bruker E 500 spectrometer operating in the X-band (9.808 GHz) utilizing 100 kHz. The mass spectra of the compounds and the metal complexes were acquired at 70 electron volts using a Varian MAT 311 analyzer. The1 H and13 C NMR spectra of the compounds and their metal complexes in d6-DMSO were collected on a Bruker Ascend 400 MHz spectrometer.
Synthesis of 2-cyano-N’-(2-hydroxybenzylidene)-3-phenylacrylohydrazide (H2L) and its coordination compounds
After dissolving 2-cyano-3-phenylacrylohydrazide (0.02 mol; 3.74 g) in 20 mL of 100% C2H5OH and adding salicylaldehyde (0.021 mol; 2.25 mL) in an ice bath, two drops of glacial acetic acid were added. After five hours of refluxing, the reaction was allowed to cool. After being separated as yellow crystals, the product was cleaned using C2H5OH and diethyl ether before being allowed to dry in the open (Scheme 1).
After dissolving the calculated amount (0.01 mol) of the acetates of Ni2+, Zn2+, Co2+ and Cu2+ in 30 mL absolute ethanol. H2L (0.01 mol), was added to the metal salt solutions. The mixtures were refluxed for four to six hours. The isolated precipitates were then washed with absolute EtOH and diethyl ether. The precipitates were dried for two hours at 100 °C in an oven. (Scheme 1) shows a hypothesized route of ligand chelation with each metal ion.
Molecular modeling
Gaussian 03 W. programs and GaussView19 were used to optimize the geometry and simulate the spectra using computational calculations for the suggested compounds. Using the 6-311 + + G (d, p) basis set, the B3LYP (Becke3–Lee–Yang–Parr) method20 incorporates IEF-PCM (polarizable continuum model). Gauss-Sum 2.2 software21 was used to calculate the groups’ participation to the molecules’ orbitals.
Molecular docking method
Molecular docking was carried out by MOE 2019.102 platform. The expected interactions between H2L and its coordination compounds with the corresponding receptors of liver cancer protein; PDB code = 4fm9, and colon cancer protein; PDB code = 3ig71,22, were investigated. The Protein Data Bank (https://www.rcsb.org) supplied the three-dimensional protein structures as PDB data files. The structures and charges had been corrected, and the solvent molecules had been eliminated. The Triangle Matcher was used to get the docking results on a stiff protein. The docking score S was computed using the London dG technique to get 30 postures, from which the top 5 positions were selected.
Cytotoxicity analysis
The MTT test was used to evaluate the inhibitory effect of chemicals on cellular growth using the previously indicated cell lines. The spectrophotometric method relies on the mitochondrial succinate dehydrating enzyme in live cells converting yellow tetrazolium bromide (MTT) into the formazan derivative with the purple color. RPMI-1640 medium complemented with fetal bovine serum (10%) was utilized to grow the tested cell lines. Penicillin (100 units/mL) and Streptomycin (100 µg/mL) were incubated at 37 °C with CO2 (5%). The cell lines were planted (1.0 × 10⁴ cells per well in a 96-well plate). They were incubated for two days at 37 °C at the same previous conditions. After that, the cells were subjected to various chemical concentrations and left for a whole day. MTT solution (20 µL; 5 mg/mL) was added and incubated for four hours after a day of medication administration. To dissolve the resulting purple formazan, 100 µL of DMSO were added to each well. To quantify and record the absorbance at 570 nm, a plate reader (EXL 800, USA) is used. According to Denizot and Lang (1986) and Mitra et al. (2016)23,24, the relative vitality of the cells according to the equation:
$${\rm Treated \:sample/Untreated \:sample\: x \:100}$$
The stability of the metal complexes under biological conditions
To elucidate the stability of the investigated metal complexes under physiological conditions, the have been studied for 24 h at pH 2 and 8 using HCl and NaOH. The other conditions as the presence of foreign metal ions as Ca2+, Mg2+, Na+ and K+. All the tests were carried out at 37 °C. The studied complexes did not suffer from any change under the physiological conditions, except Ni2+ and Co2+ complexes that suffered from change in color at pH 2 after 24 h it may be due to protonation of the amide nitrogen.
IR spectra
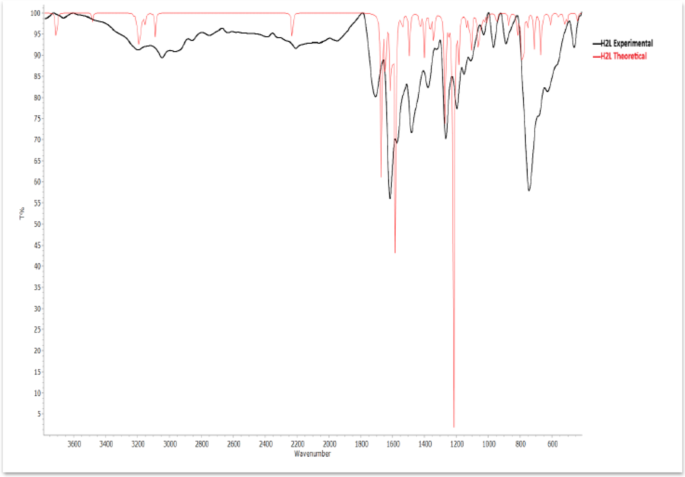
The ligand 2-cyano-N’-(2-hydroxybenzylidene)-3-phenylacrylohydrazide (H2L) can occur in either keto or enol forms (Scheme S1). A comparison of the observed and theoretically computed IR spectra via DFT was performed (Fig. 1). The correlation coefficient between selected bands in the experimental and theoretical infrared spectra is computed. The R2 = 0.99976, as shown at (Fig. S1).
The stretching vibrations of the phenolic v(OH) and δ(NH) are represented as bands at 3343 and 3202 cm− 1 in the infrared spectra of H2L (in KBr)25. The theoretically predicted spectra show these bands at 3713 and 3481 cm− 1, respectively. About 2000 cm− 1, a number of faint bands are observed, suggesting the potential of hydrogen bonding. The band of v(C ≡ N) emerges at 2211 cm− 1 (theoretically calculated at 2229 cm− 1). Furthermore, the band of v(C = N) occurs at 1616 cm− 1 (theoretically calculated at 1613 cm− 1). the δ(NH) band appears at 1573 cm− 1 (theoretically calculated at 1580 cm− 1), the stretching band of ν(C–N) emerges at 1281 cm− 1 (theoretically calculated at 1273 cm− 1). The bands located at 1707 and 1693 cm− 1 are associated with ν(CONH) and v(C = O), respectively25,26, the theoretically calculated spectra show these bands at 1671 and 1647 cm− 1. The presence of the bands of ν(NH), ν(CONH), ν(C = O) and δ(C–N) indicates the presence of H2L in the keto form1. Apart from ν(C–C) ring stretches at 1527 and 1481 cm− 1, in-plane δ(OH) bends at 1377 cm− 1, ν(N–N) stretches at 1195 cm− 1, ν(C–O) stretches at 1157 cm− 1, in-plane δ(C–H) bends at 1110 and 1030 cm− 1, out-of-plane δ(C–H) bends at 967 and 889 cm− 1, and broad hydrogen bonded out-of-plane δ(OH) bends at 685 cm[− 1 27,28.
Fig. 1
A comparison between experimental and theoretical IR spectra of H2L.
The coordination compounds’ spectra show that the bands for v(C = O), δ(NH), and δ(C-N) have vanished, indicating the presence of the H2L in metal complexes in the enol state. The absence of enolic (OH)enol in metal complex spectra indicates that this group was deprotonated following metal ion chelation. A new shoulder band of ν(C = N)* stretching vibrations of the Schiff base derivatives was observed in the region 1688–1708 cm⁻¹, these values were reported earlier in the region 1500–1700 cm[− 1 29. The highly conjugated system of the H2L in the enol in addition to the existence of the newly formed azomethine group in between (C = N) and (C ≡ N) groups may be responsible for the presence of the newly formed ν(C = N)* at relatively high wavenumber. It is noticed the disappearing of the phenolic OH bands in the free ligand from the spectra of Ni2+, Cu2+ and Zn2+ complexes suggesting the participation of this group in the complexation to the M2+ with the liberation of hydrogen ion. On the other hand, the phenolic OH remains in its position in Co2+ complex suggesting the inertness of this group towards coordination. At the same time, the stretching vibrations of ν(C ≡ N) in metal complexes haven’t been shifted, showing the unchanging electron density in this active site; thus, it is not a coordination site. Several additional weak bands are seen in the ranges 583–596 and 443–497 cm− 1 owed to ν(M-O) and ν(M-N), respectively25,30. From this discussion it can be suggested that, H2L chelates Ni2+, Cu2+ and Zn2+ ions in a binegative tridentate manner coordinating via deprotonated enolic oxygen (ONO). In case of Co2+ complex, H2L coordinates in a mononegative bidentate manner through azomethine nitrogen (C = N) and deprotonated enolic oxygen.
A comparison between H2L and its metal complexes is illustrated in (Figs S2 –S3). The existence of δ(OH) as a shoulder at 964 cm− 1 in the Co2+ complex suggests the existence of a phenolic (OH) group, as it is included in a hydrogen bond. The important bands are presented in (Table S2). The overlapping bands in the 1800–1300 cm− 1 region were resolved through deconvolution analysis. H2L, Co2+, Ni2+, Cu2+and Zn2+complexes are displayed at (Figs S4 –S8) respectively25.
Nuclear magnetic resonance
Five different multiplet signals, corresponding to 9 H of substituted benzene rings δ = 6.96, 7.39, 7.46, 7.69, and 7.78 ppm, are shown in the1 H-NMR spectra of H2L in DMSO-d6 (Fig. S9A). These signals are ascribed to (H3 and H5 of the phenol ring), (H4 of the phenol ring), (H3, H4 and H5 in the benzene ring), (H6 of the phenol ring), and (H2 and H6 in the benzene ring), in that order31. The presence of two protons from (CH = C)vinyl and (CH = N) is shown by the two singlet signals δ = 8.69 and 8.91 ppm, respectively. Individual protons exhibit two singlet signals δ = 9.0 and 11.12 ppm, are associated to (NH) and phenolic (OH) functional groups, respectively. D2O has been used in place of the last two signals. The protons of DMSO and H2O exhibit singlet signals at 3.3 and 2.4 ppm, respectively32. The suggested ketonic structure of H2L is supported by the existence of the (NH) proton. [Zn(L).H2O]2H2O1 H-NMR spectra in DMSO-d6 (Fig. S9B). The deprotonation that occurs after association with the metal ion has suppressed the phenolic (OH) and (NH) signals in the Zn2+ complex’s spectra. The absence of the (NH) signal indicates the presence of a Zn2+ complex in the enol form. 13C-NMR (Fig. S10) offers important information about the organic ligand’s carbon structure. The DMSO-d6 chemical shift can be seen δ = 39.52 ppm1 in the H2L spectra. Additionally, it displays four signals δ = 163.4, 159.1, 148.5, and 117 ppm, which correspond to carbonyl carbon (C = O), (= C-OH) carbon, azomethine carbon (C = N), and cyano carbon (C ≡ N). The range of the remaining phenyl ring carbons is 134.6-116.1 ppm31.
Mass spectra
Mass spectra were performed to figure out the molecular weights and probable fragmentation paths of the compounds. The mass spectrum and the fragmentation pathway of H2L are shown in (Fig. S11) and (Scheme S2), respectively. H2L has a molecular ion peak at m/z = 290.89 (20.83%), consistent with the suggested formula (M.wt = 291.31).
The mass spectrum of [Cu(L)H2O]2H2O (Fig. S12) reveals a molecular ion peak at m/z = 407.19 (6.89%), consistent with the proposed formula (M.wt = 406.88), and the anticipated fragmentation of the Cu2+ complex is illustrated in the accompanying (Scheme S3).
MS spectrum of [Ni(L).(H2O)3]3H2O (Fig. S13) reveals the molecular ion at m/z = 456.96 (12.22%), consistent with the calculated molecular weight 456.07. The anticipated fragmentation of the Ni2+ complex is illustrated in (Scheme S4). The mass spectrum of [Zn(L).H2O]2H2O (Fig. S14) discloses a molecular ion peak at m/z = 444.70 (35.04%), consistent with the calculated molecular weight 444.74, and the anticipated fragmentation of the Zn2+ complex is illustrated in (Scheme S5). MS of [Co(HL)2.(H2O)2]\(\:\:\frac{3}{2}\) H2O (Fig. S15) discloses the molecular ion at m/z = 704.08 (19.62%), consistent with the proposed formula (Molecular Weight 702.59), suggesting the existence of Co2+ complex in form 1:2 (metal: ligand). The anticipated fragmentation of the Co2+ complex is illustrated in the accompanying (Scheme S6).
Electronic spectra and the effective magnetic moments (µeff.)
n→π* transition appears as a wide band at 21,682 cm− 1 in H2L spectrum in DMSO (Table S3). An octahedral arrangement around Ni2+ is indicated by the magnetic moment value of [Ni(L).(H2O)3]3H2O (µeff. = 3.31 B.M.). L→MCT band appears at 28,272 cm− 1 while; the transitions3 A2g → 3T1g (P) (υ3) and3 A2g → 3T1g (F) (υ2) appear at 24,096 and 15,576 cm− 1, respectively (Fig. S16). These observations in addition to the ligand field parameter (B = 550, β = 0.51, 10Dq = 10450 cm− 1, which equals (υ1)) support the octahedral stereochemistry of this complex26.
[Cu(L).H2O]2H2O has µeff. = 1.88 B.M., of an unpaired electron of d9 electronic configuration33. The electronic spectra in DMSO shows LMCT band at 27,048 cm⁻¹. The square planar d-d transitions, 2B1g→2Eg and2 B1g→2A1g, appear at 18,908 and14931 cm− 1, respectively34.
An octahedral structure is implied by the magnetic moment of [Co(HL)2.(H2O)2] 3/2 H2O (µeff. = 5.2 B.M.), corresponds to a high spin d7 electronic configuration. Electronic spectra that show bands at 28,321, 20,602, and 18,512 cm− 1 owing to LMCT, 4T1g(F) →4T1g(P) (υ3), and4 T1g(F) →4A2g (υ2) transitions, respectively, further support this stereochemistry (Fig. S17)34. The range described for octahedral Co2+ complexes includes the ligand field parameter (B = 883, β = 0.91, 10Dq = 9718, and υ1 = 8534 cm− 1).
ESR of the [Cu(L).H2O]2H2O complex
The stereochemistry of Cu2+ complex is identified from the ESR spectrum (Fig. S18) and the ground term of [Cu(L).H2O]2H2O. Cu2+ complex has a square-planar stereochemistry when g|| (2.20298) > g┴ (2.06918) > 2.0023, since the unpaired electron occupies the orbital, resulting in a 2B1g ground state1. The exchange interactions are indicated by the axial symmetrical parameter (G), G parameter is determined by Eq. G = (g||-2)/(g┴-2) 35 and it’s significant when G is lower than 4 and insignificant when G is higher than 4.0.
Cu2+ complex’s calculated G value is 2.93, which shows a strong interactions between the ligand and the copper ion caused electrons delocalization from Cu2+ to the molecular orbital25.
The covalency degree was determined by measuring K using the formula36,
$$\:\text{K}\left|\right|2=\frac{\left(\text{g}\right||-2.0023)}{8\:\times\:\lambda\:o}\times\:\text{d}-\text{d}\:$$
$$\:\text{K}┴2=\frac{(\text{g}┴-2.0023)}{2\:\times\:\lambda\:o}\times\:\text{d}-\text{d}\:$$
$${\rm K^2 = \frac{(K_\parallel ^2 + K_\perp ^2)}{2}}$$
K is the orbital reduction factor, d-d refers to the quantum leaps, λ0 (the spin-orbit coupling constant) is taken to be 828 cm-1. It was found that Cu2+ complex exhibits in-plane π-bonding and a strong covalent nature as\({\rm K =0.81, K_\parallel = 0.67 \: and\: K_\perp =0.87}\) .
The effective magnetic moment (µeff) of Cu2+ complex was determined from g|| and g┴by using formula37.
$$\:{\upmu\:}\text{e}\text{f}\text{f}=\frac{1}{2}\sqrt{{\text{g}\left|\right|}^{2}+2{\text{g}┴}^{2}}$$
The experimental value of 1.88 B.M. and the computed µeff of 1.83 B.M. are in excellent agreement.
Thermal gravimetrical analyses (TGA)
TGA may help in the identification of the metal chelates and give knowledge of the thermal stability of the metal complexes. TGA analyses were performed from 30 to 800 °C. [Cu(L).H2O]2H2O (Fig. 2) loses 0.5H2O of hydrogen bonded water in the temperature range 30 − 14 0° C (Exp.; 1.93; Calcd.; 2.21%), Then the complex loses 2.5H2O and the species C7H4NO in the temperature range 140–295 °C, (Exp.; 40.37; Calcd.; 40.09%). C5H4N is lost in range (295–373 °C), (Exp.; 21.31; Calcd.; 19.19%). The species C5H3N is lost in range 373–800 °C (Exp.; 19.99; Calcd.; 18.90%), sending CuO off as a residual (Exp.; 20.49; Calcd.; 19.6%) (Table S4).
[Ni(L).(H2O)3]3H2O decomposes thermally in five stages (Fig. S19). In the initial stage (45–120 °C), it is proposed that water of hydration is lost (1.5H2O) (Exp.; 5.95; Calcd.; 5.92%). The second step is an endothermic process that starts at 120 to 307 °C, all coordinated water and water of crystallization molecules (4.5H2O) are lost in this step (Exp.; 18.15; Calcd.; 17.78%). The third step starts at 307 to 334 °C, the molecular species C6H4NO is lost (Exp.; 22.92; Calcd.; 23.24%). The fourth step from 334 to 338 °C, the molecular species C6H4N is lost (Exp.; 21.36; Calcd.; 21.93%). The final step is the elimination of C5H3N (Exp.; 16.08; Calcd.; 16.89%), sending off NiO as a residue (Exp.; 15.7; Calcd.; 16.38%).
[Co(HL)2.(H2O)2]\(\:\:\frac{3}{2}\) H2O complex decomposes in multiple steps (Fig. S20), the first decomposition begins from 36 to 90 °C, in which 1.5 molecule of hydrogen bonded water are (Exp.; 4.84; Calcd.; 3.85%). In the second decomposition, two coordinated water molecules are liberated from 90 to 190 °C; (Exp.; 5.16; Calcd.; 5.13%), followed by losing C4H3N species from 190 to 266 °C; (Exp.; 10.04; Calcd.; 9.26%), C7H5NO species from 266 to 342 °C; (Exp.; 17.01; Calcd.; 16.95%) and C8H6N2O (Exp.; 24.04; Calcd.; 24.07%) in the temperature range 342–359 °C. The C7H5NO species is lost from 359 to 367 °C (Exp.; 17.23; Calcd.; 16.95%), then the C4H3N species is lost from 367 to 379 °C (Exp.; 9.64; Calcd.; 9.26%), at the end, C4H2 is eliminated in the temperature range 379–800 °C (Exp.; 4.94; Calcd.; 7.12%), leaving CoO as a residue (Exp.; 11.7; Calcd.; 10.68%).
[Zn(L).H2O]4H2O decomposes in several steps (Fig. S21), the first decomposition, from 30 to 120 °C, represents the loss of water of hydration (Exp.; 4.05; Calcd.; 4.34%), then all coordinated water and water of crystallization molecules are lost (4H2O) (Exp.; 16.22; Calcd.; 16.22%). thirdly C3H2N is lost from 273 to 355 °C (Exp.; 12.72; Calcd.; 11.7%), followed by loss of the species C3H5 (Exp.; 11.54; Calcd.; 9.23%), in the temperature range 355–401 °C. In the 5th stage (401–418 °C), C5H2N is lost (Exp.; 16.51; Calcd.; 17.12%). The final step is the elimination of C5H2N (Exp.; 17.56; Calcd.; 17.12%), leaving ZnO (Exp.; 18.21; Calcd.; 18.21%).
Fig. 2
TGA curve of the [Cu(L).H2O]2H2O complex.
Optical band gap
The distance between the molecular orbitals that are (HOMO) and (LUMO) is called the “optical band gap” (Eg). It is calculated from Tauc’s relation: (αhv)n against hv.
Where n = 2 when the electronic transition is direct and 1/2 for the indirect transitions. Eg is computed experimentally from the UV-visible spectra of H2L and its metal chelates 38. In this relation, the photon energy is represented by (hν) and the absorption coefficient is represented by (α). The results indicate that, Eg of the coordination compounds are 3.26 to 3.28 eV, which is lower than that of the unbound ligand at 3.30 eV. Thus, all transitions are direct electronic transitions, as evidenced by the results (Fig. 3). The development of larger orbitals between the metal ions and the ligand is the cause of the decrease in the band gap value that occurs after the formation of a metal complex. The Eg values point to semiconducting materials39,40.
Fig. 3
Eg of H2L and M2+ complexes.
Geometry optimization
Optimization of the structures of the compounds was carried out by DFT. The optimized structure of H2L exhibits a planar arrangement where the bond angle H(28)-C(7)-C(8) = 112.65° derivate from the ideal 120° of the SP2 hybridization that permits the hydrogen bonding between H(28)-C(7) and C(9)-O(12), as depicted in Fig. 4. The results (Table S5) reveal that, the (C = O) is coplanar with H(28)-C(7) as indicated from the dihedral angle H(28)-C(7)-C(8)-CO = -0.004° that facilitates the possibility the molecular bonding (the bond length is 2.28 Å). A comparison between the obtained data with X-ray single crystals of similar analogues26,41,42 was carried out. The metal complexes’ optimized structures show that Co2+ and Ni2+ complexes have octahedral arrangement, whereas the Zn2+ and Cu2+ complexes have square planar arrangement. There are slight distortion in bond lengths and angles of the calculated geometries with the normal values. On the other hand, the geometrical characteristics show distortion in bond lengths approximately 0.067 Å, this slight distortion was observed also in dihedral and bond angles when comparing with the known X-ray single crystals of the analogous compounds26,41,42. The DFT-optimized structures for Ni2+, Co2+, Cu2+ and Zn2+ complexes are displayed at (Fig. 4). The results (Table S6) reveal that: All metal complexes show bond length distortion; specifically, the bond lengths C(16)-O(21), C(9)-O(12) and C(14) = N(13) have been changed in comparison with their lengths in the H2L as a result of coordination of these active sites. In case of Ni2+, Cu2+ and Zn2+ complexes, M-O(Sal), M-N, M-OH2 and M-O(enol) range from 1.89 to 1.996, 1.83–2.032, 1.719–2.133, and 1.933–2.065 Å, respectively. These values are in good agreement with the experimentally found analogues26,41,42. Additionally, bond angle measurements revealed another kind of distortion. For instance, in Zn2+ complex, O(H2O)-M-O(Sal) varied from the conventional value of 90.0°in square planar arrangement to be 79.256° (Table S7), on the other hand, this angle is 83.97° in case of Cu2+ complex. O(enol)-M-O(Sal) angles were 177.96° and 170.41° which are more or less distorted for Cu2+ and Zn2+, respectively in comparison with the standard 180° value for this arrangement. As well, Co2+ and Ni2+ complexes have octahedral configurations, the results display distorted bond angles, e.g., N-M-O (enol) and O(H2O)-M-O (enol) with values 81.57, 79.69° and 89.283, 79.49° for Co2+ and Ni2+ complexes, respectively. In addition to that, the dihedral angles of the Zn2+and Cu2+ complexes exhibit coplanar configuration with slight distortions in the bond lengths and angles. The higher distortion in the dihedral angles in Co2+ and Ni2+ octahedral complexes resulted from the intramolecular forces, for instance, in Co2+ complex, the dihedral angle N-N-Co-O(enol) equals 18.057° where the complex is twisted to facilitate π-π interaction with the phenyl rings and the Van der Waals forces in the complex.
Fig. 4
H2L and M2+ complexes’ optimized structures.
Frontier molecular orbitals
The molecule with a tight LUMO-HOMO energy gap is characterized by reduced stability, increased softness, increased reactivity, and a tendency for participating in charge transfer interactions42,43. The three-dimensional depiction of the ligand’s HOMO and LUMO orbitals indicates that the HOMO predominantly comprises π-orbitals alongside the nonbonding orbitals (n) of the heteroatoms, whereas the LUMO is characterized by a π*-orbital. Consequently, the charge transfer from HOMO to LUMO is attributed to π→π* and n→π* transitions (Fig. 5). The FMO plots of Co2+ complex indicate that its HOMOs predominantly comprise the salisoyl and phenyl π-orbitals in addition to the N and O lone pairs through the complex. In addition to that, a contribution from water oxygen’s lone pair is observed in this complex. The LUMO consists of π*-orbital of H2L molecules in addition to a high participation of Co2+ ion’s vacant orbitals are observed. In the Ni2+ complex, the HOMO is composed of the π-orbital of the salisoyl and azomethine moieties and the lone pairs of electrons of oxygen atoms within the ligand and water molecules, with significant contribution from the Ni2+ orbitals, while the LUMO is composed of the π*-orbitals across H2L moiety. In the Cu2+ and Zn2+ complexes, HOMO is derived from the N and O lone pairs orbitals, and the π-orbitals across H2L moiety significantly influenced by the M2+ orbitals, whereas LUMO is formed from the antibonding orbitals (π*) of the double bonds in conjunction with the M2+ orbitals (Fig. 5).
HOMO-LUMO energies indicate that the H2L possesses the lowest HOMO energy, EH = -6.326 eV, signifying its affinity for donating electrons, and also exhibits the lowest LUMO energy, EL = -2.835 eV, thereby facilitating electron acceptance. The computed ΔEH−L, was juxtaposed with the experimental Eg, revealing that H2L displayed the maximum Eg of 3.3 eV, whereas the Ni2+ and Cu2+ complexes exhibited the minimum Eg at 3.26 eV (Table S8). Besides that, additional chemical reactivity descriptors (electronegativity (χ), global hardness (η), global softness (δ), and electrophilicity (ω)) were assessed using EHOMO & ELUMO. These characteristics show the electron acceptance capacity, charge transfer resistance, molecular Lewis acid-base character, and energy reduction related to HOMO-LUMO electron transfer, respectively, and are computed using the following relations44:
χ = \(\:-\frac{1}{2}\:\)(EHOMO+ELUMO) η =\(\:-\frac{1}{2}\:\)(EHOMO-ELUMO) δ = \(\:\frac{1}{{\upeta\:}}\)ω = \(\:\frac{{{\upchi\:}}^{2}}{2{\upeta\:}}\).
Table S8 demonstrates that Zn2+ complex possesses the lowest global hardness at 1.676 eV, whilst the H2L the highest value at 1.7455 eV. Zn2+ complex possesses the highest softness at 0.5967 eV, whilst the H2L the lowest value at 0.5729 eV.
Fig. 5
The HOMO-LUMO orbitals of H2L and M2+ complexes.
The molecular electrostatic potential map (MEP)
The estimated electron density surface is represented by the MEP, which is color-coded. MEP surface representations in three dimensions, commonly known as the MEP map45. The molecule charge dispersion is shown on the MEP map. Understanding charge distribution, red designating the negative side and blue designating the positive side, is used to determine load-dependent properties and molecular interactions. (Fig. 6) shows the MEP of the H2L and its M2+ complexes. Based on the electron density, the MEP diagram shows the nucleophilic and electrophilic sites. A color gradient ranging from red to blue represents the electrostatic potential’s increasing progression46. The area where the value is 0 is associated with the color green. MEP maps show that regions containing oxygen or nitrogen atoms appear orange to yellow. These are the places in the ligand where there is a lot of electrophilic reactivity. However, the blue areas correspond to hydrogen atoms bound to nitrogen or oxygen atoms, resulting in a positive electron density that permits nucleophilic reactivity. The metal complexes’ MEP diagrams resemble the ligand’s MEP, in addition to the existence of water molecules where hydrogen atoms act as electron positive sites and appear as blue regions in the MEP maps.
Fig. 6
MEP of the H2L and its M2+ complexes.
ELF and LOL analysis
To demonstrate the electron localization across the molecule, the Electron Localization Function (ELF) and Localization Orbital Locator (LOL) researches had been conducted. These functions provide information on bonding configurations, lone pairs, and core electron areas by depicting an electron pair and localization diagram47,48. Both functions had been calculated using the electron density resulting from the optimized shapes, that had been computed at the DFT/B3LYP level alongside the basis set 6-311G (d, p). Using Multiwfn 3.4.1. 48, ELF and LOL had been calculated and associated 2D contour maps were created. To explain the compound’s electronic structure and bonding characteristics, ELF and LOL studies were conducted49,50. Lone pairs, covalent bonds, and core electron zones may all be clearly distinguished thanks to these functions, which give a quantitative assessment of where the electrons are paired. Important information on chemical bonds present, the configuration of free electrons, and the general stability and reactivity of the molecule may be obtained by chemical imaging of these localization domains51. The ELF and LOL isosurfaces of H2L and its Zn2+ complex are shown in Fig. 7 as a 2-D representation translated onto the XY plane (Z = 0) using a color scale ranging from blue to red. It illustrates how electrons are localized and delocalized in each compound section. The strong covalent nature of the H2L and its M2+ complexes is shown by the detection of high ELF/LOL areas (red/yellow regions in Fig. 7) in C–H, C–C, and N–H bonds. The significant negative-potential regions found in the MEP are definitely correlated with lone pairs of electrons on N and O atoms, according to the ELF study. The core electron of the metals inside the complexes is also visible in the ELF/LOL patterns, which aid in the HOMO analysis of complexes. This congruence between the localization and electrostatic studies provides a thorough understanding of the electronic environment: electron-rich regions influence the hydrogen bonding patterns shown in experiments in addition to driving local reactivity. Crucially, delocalization within the H2L conjugation system is shown by the ELF/LOL patterns, indicating the stability of the H2L and its coordination compounds via conjugation. The orbital distribution seen in FMO plots and EH−L is explained by this delocalization as well as the unique localization close to donor atoms. Combining MEP, ELF, and LOL data gives an explanation for how electronic characteristics impact molecular stability and potential reactivity, going beyond a visual representation of computational figures. Fig. S22 shows the ELF/LOL patterns of the Cu2+, Co2+, and Ni2+ complexes.
Fig. 7
ELF and LOL iso-surfaces of the H2L and its Zn2+ complex.
Natural bond orbital (NBO) calculations
The main uses of NPA and NBO are to assess the strength and properties of charge delocalization as well as to estimate the molecule natural charge and interactions between the metal atoms and the ligand. Variations in basis sets have little effect on the NPA-NBO technique, which is the best strategy for atomic charge computations44,52. The inclusion of oxygen and nitrogen as ligand coordinating atoms offers a chance to improve the study of electron donation affinity. Table S9 displays the metal ions and the natural charges of the atoms in the coordinated ligands. In H2L, the net natural charge of the oxygen atoms O12 and O21 equals − 0.58117 and − 0.6882 e, respectively. In addition, Three nitrogen atoms, N11, N13, and N22, each have a net natural charge of -0.4337, -0.21823, and − 0.31097 e, respectively. These oxygen atoms have a higher net natural charge than these nitrogen atoms. This means that oxygen atoms are more likely to pair up with metal cations. In metal complexes, the metal cations have net charges of 1.31787, 0.81279, 1.05528, and 0.6726 e for Ni2+, Cu2+, Co2+, and Zn2+, respectively. The metal cations have net charges lower than (+ 2) because of the electrons transferred from ligand donating atoms to the metal ion, showing that the charges of the metal cation are greatly reduced through the negative electron density that is transmitted from the ligand units. Because the transferred charges from ligand to metal are larger than the back donation, the investigated complexes may be categorized as LMCT complexes.
The interaction involving “filled” (the donor) Lewis-type NBOs and “unfilled” (the acceptor) non-Lewis NBOs is documented in (Table S10). In the ligand, the most significant interactions happen between O12 lone pair (1) as a donor orbital and (σ*) C20 – H34 as an acceptor orbital, O12 lone pair (1) as a donor orbital and (σ*) N13 – C14 as an acceptor orbital and N11 lone pair (1) as a donor orbital and (π*) N13 – C14 as an acceptor orbital with stabilization energies of 386.94, 281.09, and 148.31 kcal/mol, respectively. These interactions contribute to stabilizing the ligand molecule. In addition to that, the charge transfer happens at O12…. C7-H28 with energy 6.49 kcal/mol, causing the deviation of the bond angle from the standard 120° in the optimized DFT structure of H2L. There is no bond (a centered electron pair between two atoms) between O/N atoms that are interacting with M²⁺ cations in the NBO study of the metal complexes system. Noting that the delocalization of electrons between the unoccupied anti-bonding orbitals of the metal cations LP* and the donating atoms’ lone pair-filled orbitals LP(O/N) is the source of the M–O/N interactions. In metal complexes, multiple charge transfers occur for the ligand donating atoms (N13, O12, O21) and the water oxygen atom with vacant anti-bonding orbitals of the metal cations LP* with significant stabilization energies. For instance, the net stabilization energies of charge transfer of LP donor orbitals of N13, O12, O21, O35, O38, and O40 to LP* acceptor orbitals of Ni29 equal 135.4, 100.76, 104.44, 40.08, 64.97, and 128.01 kcal/mol, respectively. These interactions cause the stabilization of Ni2+ complexes along with strong hyperconjugative interactions LP(1) O12 → σ* C7–H28, LP(2) O12 → σ* C7–H28, and LP(2) O12 → σ* O40–H43 (hydrogen bonding O12….H43–O40) with net stabilization energy 411.77, 160.28, and 80.24 kcal/mol, respectively, as shown in Table S4. In the Cu2+ complex, the NBO analysis shows charge transfer LP donor orbitals of N13, O12, O21, and O35 to LP* acceptor orbitals of Cu29 equal 37.30, 75.58, 51, and 67.3 kcal/mol, respectively, besides the strong hyperconjugative interactions LP(2) O12 → σ* C16–O21 and LP(1) O35 → σ* C19–H33 with net stabilization energy of 187.21 and 166.74 kcal/mol, respectively. The Co2+ complex shows significant hyperconjugative interactions with high stabilization energies, where LP(1) O21 → σ* O38–H39, LP(2) O38 → σ* O38–H39, LP(2) O21 → σ* O38–H39, LP(1) O21 → σ* C14–H30, and LP(2) O35 → σ* C14–H30 have very significant stabilization energies of 974.03, 518.14, 295.34, 190.49, and 160.82 kcal/mol, respectively. In addition, the charge transfer from LP donor orbitals of O12, O21, O35, O38, and O60 to LP* acceptor orbitals of Co29 equals 7.45, 75.58, 118.25, 30.85, and 7.86 kcal/mol, respectively. Finally, the NBO analysis of Zn2+ complex shows charge transfer of LP donor orbitals of N13, N22, O12, O21, and O35 to LP* acceptor orbitals of Zn29 equals 55.59, 20.29, 63.7, 72.51, and 53.37 kcal/mol, respectively, besides the strong hyperconjugative interactions LP(1) O35 → σ* C19–H30 and LP(2) O35 → σ* C10–N22 with stabilization energies of 166.74 and 101.13 kcal/mol, respectively.
NLO properties
Due to their exceptional structural and electrical characteristics, Schiff bases have garnered a lot of interest in NLO investigations of materials, making them a good fit for applications in optoelectronics. One important feature that describes a molecule’s or crystalline structure’s first order nonlinear optical activity is hyperpolarizability (β). This property determines how extent a material can transmit an input optical field to a newly frequency. Numerous internal and extrinsic factors, like the structure of the molecule, charge distribution, and external factors such as applied electric fields, can affect the hyperpolarizability of the H2L and its M2+ complexes. An induced dipole moment, polarizability (α), and hyperpolarizability (β) of the system are typical indicators of a molecule’s polarization in reaction to an electric field53. The following is a description of the key parameters54:
Dipole moment,
$$\:{\upmu\:}=\sqrt{{{\upmu\:}\text{x}}^{2}+{{\upmu\:}\text{y}}^{2}+{{\upmu\:}\text{z}}^{2}}$$
Polarizability,
$$\:\:=\frac{1}{3\:}(\text{x}\text{x}\hspace{0.17em}+\hspace{0.17em}\text{y}\text{y}\hspace{0.17em}+\hspace{0.17em}\text{z}\text{z})2$$
Anisotropy of the polarizability,
$$\:{\Delta\:}{\upalpha\:}\:=\sqrt{\frac{{({\upalpha\:}\text{x}\text{x}-{\upalpha\:}\text{y}\text{y})}^{2}+{({\upalpha\:}\text{y}\text{y}-{\upalpha\:}\text{z}\text{z})}^{2}+{({\upalpha\:}\text{z}\text{z}-{\upalpha\:}\text{x}\text{x})}^{2}+6{{\upalpha\:}\text{x}\text{y}}^{2}+6{{\upalpha\:}\text{z}\text{y}}^{2}+{6{\upalpha\:}\text{x}\text{z}}^{2}}{2}}$$
First hyperpolarizability,
$$\:{\upbeta\:}=\sqrt{{{\upbeta\:}\text{x}}^{2}+{{\upbeta\:}\text{y}}^{2}+{{\upbeta\:}\text{z}}^{2}}$$
Where,
$$\:{{\upbeta\:}\text{x}}^{2}=\:({\upbeta\:}\text{x}\text{x}\text{x}\hspace{0.17em}+\hspace{0.17em}{\upbeta\:}\text{x}\text{y}\text{y}\hspace{0.17em}+\hspace{0.17em}{\upbeta\:}\text{x}\text{z}\text{z})2$$
$$\:{{\upbeta\:}\text{y}}^{2}=\:({\upbeta\:}\text{y}\text{x}\text{x}\hspace{0.17em}+\hspace{0.17em}{\upbeta\:}\text{y}\text{y}\text{y}\hspace{0.17em}+\hspace{0.17em}{\upbeta\:}\text{y}\text{z}\text{z})2$$
$$\:{{\upbeta\:}\text{z}}^{2\:}=\:({\upbeta\:}\text{z}\text{x}\text{x}\hspace{0.17em}+\hspace{0.17em}{\upbeta\:}\text{z}\text{y}\text{y}\hspace{0.17em}+\hspace{0.17em}{\upbeta\:}\text{z}\text{z}\text{z})2$$
After converting the calculated (α) and (β) from atomic units (a.u.) to electrostatic units (esu), urea was used as a reference nonlinear optical material (dipole moment = 1.3732 Debye and first order hyperpolarizability = 3.7389 × 10− 31 esu)55. Effective intermolecular interactions will be present in a molecule with a high (µ). The results (Table S11) show that Ni2+ complex has the greatest value at 9.06 Debye, followed by Zn2+, Cu2+, and H2L, respectively, while the Co2+ complex has a lesser dipole moment than the other compounds, measuring 1.29 Debye. The Cu2+ complex had the lowest calculated first-order hyperpolarizability (βtotal) of 7.971 × 10− 30 esu, while Ni2+ complex has the highest value of 6.305 × 10− 29 esu. These values were followed by H2L, Co2+, and Zn2+. Every chemical under investigation had values greater than urea. An increase in the charge transfer (CT) interactions inside the molecule is linked to this rise in hyperpolarizability. NLO characteristics are significantly impacted by the delocalization of π-electrons across the conjugated system and the presence of functional groups with electron-donating and electron-withdrawing actions55. The basis for next studies concentrating on chemical changes to optimize NLO responses is established by these results. The molecular symmetry of the compounds is another crucial factor controlling their hyperpolarizability. The compounds’ non-centrosymmetric crystal stacking permits significant SHG activity, but centrosymmetric structures often decrease NLO property due to symmetry constraints. The lattice’s nonlinear optical response is further enhanced by charge delocalization made possible by EH−L, hydrogen bonding, and dipole-dipole interactions.
Molecular docking
It is a useful method for predicting the likely orientation of ligands and receptors. The affinity of the H2L and its M2+ complexes for binding to the receptors determines their effectiveness. A fundamental cyclin-dependent kinase (Cdk5) has been thoroughly described for its function in the neurological system of the body51. H2L (keto and enol forms) and its complexes’ interactions with the two targeted proteins had been simulated in two and three dimensions. The molecular interactions and binding energy of each chemical were examined after docking. Before doing molecular docking, the docking technique and methodology must be adhered to. The binding energies of the H2L and its complexes, the Docking Score (S), and the Root Mean Square Deviation (RMSD) were used to examine the final data (Table 1). According to the docking data, the Zn2+ complex is the most successfully docked molecule with the colon cancer protein (3ig7), displaying docking scores of -6.63, whereas H2L keto is the most successfully docked molecule with the liver cancer protein (4fm9), displaying docking scores of -6.85. The molecular docking of (2-cyano-N’-2-hydroxybenzylidene)-3-phenylacrylohydrazide in the keto form with the 4fm9 protein is described in (Fig. 8). H-donor, H-acceptor, and pi-H interactions are how the ligand interacts with GLU 682, LEU 592, and LEU 705 in 4fm9 protein (receptor). Due to its interaction as an H-donor at a bond length of 3.15 Å and − 0.9 kcal/mol, the free hydroxyl group indicates the highest S of the ligand with the 4fm9 protein. H2L interacts with 3ig7 protein through two hydrogen bonds with GLU 8 and LEU 83 at bond lengths 2.97 and 3.19 Å and binging energies − 1.6 and − 2.6 kcal/mol, respectively. (Fig. 9) shows Zn2+ complex’s molecular docking with 3ig7. In comparison to H2L and its other M2+ complexes, the Zn2+ complex got the greatest docking score. The Zn2+ complex interacts with LYS 89 and LEU 298 of the 3ig7 cancer protein (receptor) via hydrogen bonds at 3.13 and 3.22 Å, with binding energies equal − 6.9 and − 1.1 kcal/mol, respectively. Zn2+ complex interacts with 4fm9 through hydrogen bond with LYS 701 at 3.29 Å bond length and − 0.5 kcal/mol binding energy. It also forms pi-H and pi-cation (bond lengths = 4.00, 4.16 Å, binding energies= -0.5, -0.8 kcal/mol, respectively) with LEU 592 and ARG 675, respectively.
The results (Table S12) show the binding modes of H2L and its coordination compounds towards 3ig7 and 4fm9 proteins. Ni2+ complex binds to 4fm9 protein through hydrogen bond (bond length = 3.17 Å, binding energy = -1.8 kcal/mol) and pi-H (bond length = 4.04 Å, binding energy = -0.5 kcal/mol) interactions with LEU 685 and TYR 684, respectively. Its interaction with 3ig7 is through a hydrogen bond with GLN 131 (bond length = 2.62 Å, binding energy = -1.5 kcal/mol). Cu2+ complex binds to 4fm9 protein through hydrogen bonds (bond lengths = 2.78, 3.25 Å, binding energy = -2.6, -3.0 kcal/mol) with ASP 683 and GLU 682, respectively and pi-H (bond lengths = 4.39 Å, binding energy = -0.5 kcal/mol) interaction with LYS 701. Its interaction with 3ig7 is through a hydrogen bond with LYS 89 (bond lengths = 2.87 Å, binding energy = -0.5 kcal/mol). Co2+ complex binds to 4fm9 protein through three hydrogen bonds (bond lengths = 3.29, 2.51, 2.81 Å, binding energy = -1.3, -1.4, -2.5 kcal/mol) with ASP 683, ASP 683 and LYS 701, respectively (ASP 683 forms two hydrogen bonds with C7 and O35 of the complex). It also forms pi-H (bond length = 3.64 Å, binding energy = -1.8 kcal/mol) interaction with LEU 685. Its interactions with 3ig7 are four hydrogen bonds (bond lengths = 2.67, 2.57, 3.32, 3.00 Å, binding energies = -1.1, -0.5, -0.9, -2.1 kcal/mol) with GLU 12, GLN 131, ASN 132 and LYS 89, respectively.
Table 1 Molecular docking of the compounds with (PDB code = 4fm9) of liver cancer protein and (PDB code = 3ig7) of colon cancer protein.Fig. 8
2D and 3D Docking interaction between H2L keto with (PDB code = 4fm9).
Fig. 9
2D and 3D Docking interaction between Zn2+ complex with (PDB code = 3ig7).
Cytotoxicity activity
The in vitro cytotoxic effects of the compounds against HePG2 and HCT-116 cell lines are presented (Fig. 10). H2L shows a strong activity with an IC50 of 19.42 ± 1.4 µg/ml against the HePG2 cell line and a moderate effect with an IC50 of 35.14 ± 2.2 µg/ml against the HCT-116 cell line. The free hydroxyl and nitrile groups allowed H2L to interact with the receptor via H-bonding, as the docking data showed. This could be the reason why the free ligand is more active. The Zn2+ complex has moderate action against the HePG2 cell line (IC50 50.26 ± 2.9 µg/ml), but strong activity against the HCT-116 cell line (IC50 18.16 ± 1.4 µg/ml). Additionally, Ni2+ complex showed modest action against both cells. Cu2+ complexes had no cytotoxic impact on the HCT-116 cell line and a bit weak action against the HePG2 cell line. H2L had the lowest viability against the HePG2 cell line (Fig. S23). Conversely, the Zn2+ complex had the lowest vitality against the HCT-116 cell line.
Fig. 10
IC50 of the H2L and M2+ complexes against HePG2 and HCT-116 incorporating DOX and SOR as standards.
The results are compared with the previously reported synthesized compounds’ anticancer activity against the same cell lines1. H2L and its coordination compounds showed lower anticancer activity than the previously reported synthesized compounds. The ligand previously reported by Hosny (2023)1 showed a higher activity against HePG2 cell line (IC50 8.53 ± 0.6 µg/ml) than H2L and a higher activity against HCT-116 cell line (IC50 7.87 ± 0.5 µg/ml) than the Zn2+ complex. From the molecular docking, the lower activity of H2L and its coordination compounds may be a result of the lower activity of the nitrile group (C ≡ N) as compared to the free thiocarbonyl group (C = S) of the previously reported synthesized compounds.
