


Biological material
Patient selection
Tumor and TIL material was obtained from 23 individuals across three clinical trials conducted at the National Center for Cancer Immune Therapy (CCIT-DK), Department of Oncology, Copenhagen University Hospital, Herlev, Denmark. Additionally, healthy donor PBMCs were used for NCP-TCR-T production for activation and effector analysis of noncanonical peptide (NCP) reactivity. Written informed consent was provided by all patients before obtaining any samples. All procedures were conducted in accordance with the Declaration of Helsinki and Good Clinical Practice and approved by the Institutional Review Board (Ethics Committee) of the Capital Region of Denmark (EudraCT no. 2008-008141-20, EudraCT no. 2014-001420-29, EudraCT no. 2014-001419-38) and national regulations for biomedical research, including appropriate data protection of human participants.
Production of TILs
TILs for this project were produced from the biobank at CCIT-DK. Minimally cultured TILs which were obtained from clinical trial-derived tumor material previously described in detail42,43 and subsequently underwent rapid expansion (REP). Per in-house protocol, 100,000 minimally cultured TILs were combined in a standing T25 filtered flask (NUNC Thermo Ficher) with 20 million allogenic, irradiated feeder cells in complete medium, consisting of 50% RM (AIM-V (Life Technologies), Fungizone (1.25 μg/ml), Proleukin IL-2 (Iovance) (6000 IU/ml)), 50% KM (RPMI 1640 (Life Technologies), 10% heat-inactivated human AB-serum (Sigma Aldrich), 1% PenStrep (Thermo Fischer), Fungizone (1.25 μg/ml), IL-2 (6000 IU/ml)), and agonistic anti-CD3 monoclonal antibodies (Miltenyi) and cultured at standard conditions. Half the medium was replaced on day 5. REPs continued for 12–14 days, increasing flask size as required. REP TILs were cryopreserved in human AB serum with 10% DMSO (WAK-chemie) and stored at –140 °C.
Cell line cultures
Patient-derived cell lines were produced as previously described.42 All cell lines were cultured in filtered T flasks (NUNC Thermo Fisher) at 37 °C and 5% CO2 in RPMI 1640 supplemented with 10% fetal bovine serum (FBS) (Life Technologies) and 1% penicillin-streptomycin (Life Technologies). HCoSMC (ScienCell) cell lines were cultured similarly in poly-L-lysine (Sigma-Aldrich) coated flasks using Smooth Muscle Cell Growth Medium 2 (Sigma-Aldrich). CCL-210 cell lines were cultured in Advanced DMEM (LifeTechnologies) supplemented with 10% FBS. Cell lines were passaged at 80% confluency.
Transcript and peptide-level characterization
Identification of genomic mapping of noncanonical transcripts
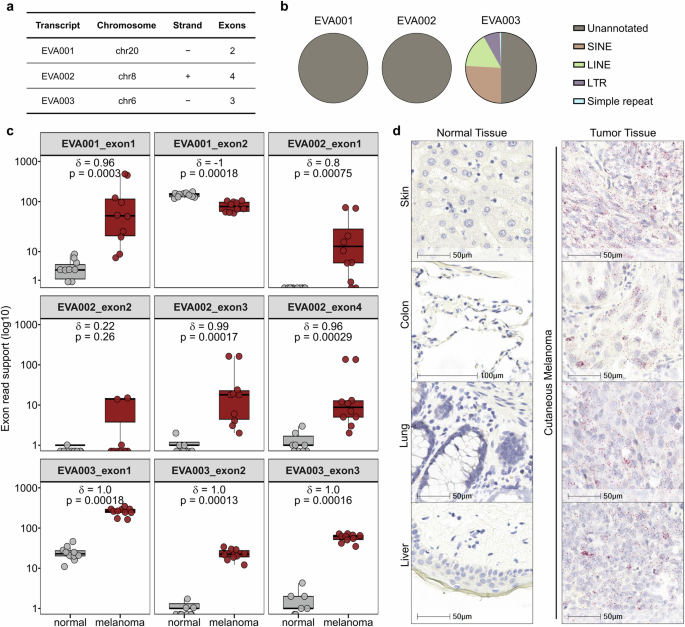
Candidate noncanonical transcripts EVA001, EVA002, EVA003, were provided as predefined sequences for downstream analysis. These transcripts were originally identified using de novo transcript assembly approaches applied to cancer transcriptomes, as previously described.16 Assembled transcript sequences were aligned to the human reference genome (GRCh38/hg38) using spliced alignment (minimap2 v2.24 with parameters optimized for long RNA alignment). Resulting alignments were processed using SAMtools (v1.15) to generate sorted BAM files. Genomic coordinates, exon boundaries, strand orientation, and mapping quality were extracted from alignment files. Only alignments with mapping quality ≥60 were retained for downstream analysis. Exon structures were defined based on splice junctions in the aligned transcripts. Chromosomal location, exon number, and strand orientation were visualized using Integrative Genomics Viewer (IGV, Broad Institute).
Repeat annotation and genomic context analysis
To characterize repeat content, genomic coordinates corresponding to each EVA locus were intersected with RepeatMasker annotations (UCSC Table Browser, RepeatMasker track, GFCh38). Repeat classes were categorized into SINE, LINE, LTR, simple repeats and unannotated regions. For each transcript locus, the proportion of genomic span overlapping each repeat class was calculated using BEDTools (v2.30, intersect function). Genomic neighborhood analysis was performed by identifying annotated genes and long noncoding RNAs within ±50 kb of each EVA locus using GENCODE v38 gene annotations.
Exon-resolved expression quantification in melanoma and normal tissues
To evaluate tissue specificity, exon-level expression was quantified in melanoma and normal tissue samples using publicly available datasets. Transcriptome indices were constructed from custom reference sequences containing exon-specific regions of EVA transcripts using Salmon (v1.9.0)44 in quasi-mapping mode.
RNA sequencing reads were quantified using Salmon with default parameters, generating transcript per million (TPM) estimates. For exon-level analysis, exon-specific reference sequences were used to resolve read support for individual exons. TPM values were log10-transformed for visualization.
RNA in situ hybridization (RNAscope®)
Tissue samples were commercially sourced and stained with custom ORF probes custom designed by Advanced Cell Diagnostics for EVA003 mRNA expression assessment using an RNAscope® probe (Bio-Techne). In the case of melanoma patient-derived cells, cells were fixed for 20 min in 10% PFA at room temperature. After fixing cells were spun onto SuperFrost slides, using single Cytospin funnels. Samples were stained for EVA003 RNAscope probe and PPIB and dapB as positive and negative RNA quality controls, respectively. Standard RNAscope Assay protocol was used, 2.5 LS Red Reagent Kit (Cat. No. 322150). Semi-quantitative visual scoring was performed at EnaraBio to assign a single score to a sample based on the predominant staining pattern throughout the entire sample. Quantification is based on dots per cell, correlating to RNA molecules, not affected by staining intensity. To assess RNA quality and integrity, PPIB (Peptidylprolyl Isomerase B) was used as positive RNAscope control staining probes and dapB (Bacillus subtilis dihydrodipicolinate reductase) was used as negative RNAscope control staining probe. Sores: Negative: 0–0 dots/cell; Positive: 1–1-3 dots/cell; 2–4-9 dots/cell; 3–10-15 dots/cell and/or < 10% dots are clusters; 4–15+ dots/cell and/or > 10% dots are clusters.
Transfection of CaSki cells
The EVA sequences encoding the ORFs including a start codon ATG and stop codon TAA were cloned into the mammalian expression vector pCDNA3.1 (Invitrogen) multiple cloning site. CaSki cells were electroporated using the Biorad Gene pulser Xcell system using 1ug of plasmid DNA per 1 × 10⁷ cells. 24 h following transfection cells were selected for plasmid expression by culturing in 500 μg/ml G418-sulfate (Geneticin, Gibco). Cells were expanded to 100 million cells in for subsequent mass spectrometry analysis.
HLA-peptide purification from cell lines
100 million tumor cells were lysed using lysis buffer (1% IGEPAL 630, 150 mM NaCl, 50 mM Tris, pH 8.0, supplemented with protease inhibitor cocktail (Roche)) then centrifuged at 15,000 × g for 45 min. 0.5 mL W6/32 cross-linked to protein A-Sepharose beads (GE) was added for 4 h, and beads were washed with 50 mM Tris buffer (pH 8.0) containing first 150 mM NaCl, then 450 mM NaCl, and next no salt. HLA-peptide complexes were eluted by using 5 column volume (CV) 10% acetic acid and dried. After drying, the desired fraction was resuspended in 500 μL loading buffer (0.1% formic acid (FA), 1% acetonitrile (ACN) in water). C18 solid phase extraction (Sep-Pak C18 3 cc Vac Cartridge, 200 mg Sorbent) was used to de-salt samples and separate proteins from peptides.
Liquid chromatography mass spectrometry acquisition
Samples were measured by liquid chromatography (LC)-mass spectrometry (MS) on an Ultimate 3000 RSLCnano System coupled with an Orbitrap Fusion Lumos (Thermo Scientific). Peptides were loaded onto an analytical column (PepMap C18 column, 2 µm particle size, 75 µm × 50 cm; Thermo Scientific) and eluted in a 60 min linear gradient from 3% to 25% ACN in 5% DMSO/0.1% formic acid at a flow rate of 250 nl/min. Peptides were introduced to the mass spectrometer using an EasySpray source at 2000 V and 45֯C, and the transfer tube temperature was set to 305 °C. Mass spectrometry (MS) detection was performed with a resolution of 120,000 for full MS (320–1600 m/z scan range) and AGC target of 300,000. A full-MS1 scan (120,000 resolution, 60 ms accumulation time, AGC 3 × 10⁶) was followed by 20 data-dependent MS2 scans (60,000 resolution, 120 ms accumulation time, AGC 5 × 10⁵), with an isolation width of 1.6 m/z and normalized HCD energy of 25%.
LC-MS datasets and analysis
Peaks X (Bioinformatics Solutions) was used to search against a database containing SwissProt-reviewed human proteins in addition to EVA003. For the database search, we used no enzyme specificity (setting: unspecific). The precursor mass error range was set within 10 ppm while the fragment tolerance was set to 0.05 Da. Only oxidation of methionine was selected as variable modification. The identified peptides were filtered for Peptide-Spectral-Match (PSM) FDR < 1%. For each identified peptide an output was created including as most important features: peptide sequence (column named “Peptide”), peptide probability score (column named “-10lgP”) where higher scores have better probability, theoretical mass of the peptide (“Mass”), peptide length (column named “Length”), mass error compared to theoretical (column named “ppm”), mass to charge ratio of the peptide (“m/z”) in the mass spectrometer, charge of the peptide in the mass spectrometer(column named “Z”), chromatography elution time (column named “RT”), mass spectrometry raw intensity of the peptides (column named “Intensity”), file where the identification was made (column named “Source File”) and protein of origin of the peptide (column named “Accession”).
RNA sequencing
RNA from tumor cell lines harvested and bulk sequenced as described in Lauss et al.45 Raw data was processed using fqtools, fastqc, trimgalore. Ribosomal RNA was removed with sortmerna if necessary. Reference genes HNRNPL, PCBP1, and RER1 were used as described by Jo et al. for normalization of EVA expression.46 Pseudoalignment for transcript quantification was done with Kallisto.47
TCR discovery
Enrichment and expansion of LLM-reactive TILs
TILs from MM-01 were stimulated with 10 µM of LLM peptide for 4 h at 37 °C in the presence of anti- IFNγ -PE antibody. Labeled cells were then exposed to anti-PE MicroBeads (Miltenyi) and positively selected using MS Columns (Miltenyi). Materials were used in accordance with manufacturer protocols. Positively selected cells were eluted directly into single wells of a 24-well plate containing expansion components as described in “Production of TILs” section above, scaled down for a total volume of 2 mL. Cells were kept at 37 °C at 5% CO2, undisturbed for 5 days. On day 5, 1 mL of medium was removed and replaced with fresh master mix. On day 7 of the expansion, cells were moved to a standing T25 flask and topped to a final volume of 10 mL of master mix. 5 mL of medium was replaced on day 10, then on day 12, cells were harvested, washed twice with X-VIVO, and resuspended in X-VIVO with 10% human AB serum to rest for 48 h at 4 million cells per well in 24-well plates. After rest, 100,000 enriched TILs were stimulated with 10 µM of LLM peptide for six hours at 37 °C. After incubation, cells were prepared for 10X and single cell sequencing.
Single cell sequencing and data processing
Following expansion and resting, 20,000 LLM-enriched TILs were aliquoted into low-binding Eppendorf tubes (Eppendorf). Single-cell gene expression and immune profiling libraries were prepared using the Chromium Next GEM Single Cell Gene Expression and Single Cell Immune Profiling v2 kits (10x Genomics) according to the manufacturer’s protocols. Libraries were sequenced on an Illumina NextSeq 550 platform. Raw sequencing data were processed using the Cell Ranger pipeline (10x Genomics). Unique molecular identifiers (UMIs) were used to integrate gene expression and V(D)J sequencing data, enabling the identification of dominant TCR clonotypes within IFNG-high cell populations using the R platform (version 4.3.2).
TCR validation
Virus production
The NCP-TCR1 VDJ sequences were cloned into EF1a promoter, EcoRV-BamHI digested lenti-backbone with murinized beta-alpha orientation. Lentivirus was produced via transduction into HEK293T cells with 18 µg each of pRSV.REV, pMDLg/p.RRE, pVSV.G plasmids (Genscript) and 36 µg of TCR construct using CaCl2 transfection kit (Promega). 24- and 48-h viral harvests were combined and concentrated with Lenti-X (Takara Bio).
NCP-TCR-T production and enrichment
Buffy coats from healthy donors were obtained from Rigshospitalet Blood Bank, Copenhagen, Denmark. PBMC isolation was performed using LymphoprepTM density gradient media (Alere Technologies) using Leucosep tubes (Greiner Bio-One). Fresh PBMCs were activated overnight using immobilized anti-CD3 (Miltenyi) and anti-CD28 (Miltenyi) agonistic antibodies in RPMI + 10% heat-inactivated human AB-serum. Cells were transduced with fresh, concentrated virus. On day 5 of transduction, cells were analyzed via flow cytometry (see below).
NCP-TCR-T cells were enriched using the magnetic-activated cell sorting (MACS) (Miltenyi) according to manufacturer’s protocol. In brief, cells were pelleted and stained with anti-CD8 microbeads (Miltenyi), or anti-mouse-TCRb-chain-PE (BioLegend) followed by anti-PE Microbeads (Miltenyi), in MACS buffer (Phosphate buffered saline (PBS, Life Technologies), 0.5% bovine serum albumin (BSA) (Sigma Aldrich), and 2 mM EDTA, (Life Technologies)) for every 107 cells at 4 °C for 15 min. Labeled cells were loaded into MS or LS columns in the presence of a magnet, washed thoroughly, removed from magnet and detached from the column. Enriched TCR-positive cells and NTD controls were directly transferred to expansion vessel as described in “Production of TILs” section above. On day 14 of expansion, purity was confirmed via flow cytometry and enriched NCP-TCR-T cells were cryorpreserved in human serum with 10% DMSO.
ELISpot
Unconjugated anti- IFNγ antibodies (Mabtech) were diluted to a concentration of 7.5 µg/mL in ELISpot buffer (PBS + 0.5% BSA). ELISpot plates (Mabtech) were coated with 70 µL of antibody solution and incubated over night at room temperature. Plates were washed six times with 200 µL PBS, then pre-conditioned with 200 µL of X-VIVO (Life Science) for 2 h at 37 °C. 100,000 effector cells were transferred to each well. 10 µM of peptide in X-VIVO medium was added to relevant wells. Plates were incubated overnight at 37 °C. The next day, contents were discarded from wells which were then washed six times with 200 µL of PBS. 70 µL of 0.75 µg/mL biotin-conjugated anti- IFNγ (Mabtech) was applied to each well and incubated in the dark at room temperature for 2 h. Wells were washed six times with 200 µL of PBS. 70 µL of Streptavadin-ALP (Mabtech) diluted 1:1000 in ELISpot buffer was applied to each well and incubated at room temperature for 1 h, followed by six washes with 200 µL of PBS. 70 µL of 0.22 µM-filtered BCIP/NBT substrate (Mabtech) was applied to each well. Development occurred for 1–5 min until positive control was visible and reaction was stopped by rinsing with distilled water and patting dry. Spots were quantified on the CTL ImmunoSpot S6 Ultimate-V analyzer.
Intracellular cytokine stain
NCP-TCR-T or NTD effector cells were mixed at a 3:1 effector-to-target ratio with either T2-A3 cells pulsed with desired peptide or in house-produced tumor cell lines MM-21 or MM-22. Experiments with patient-derived cell lines were conducted with CD8+-enriched effector cells. Cocultures were treated with GolgiStop (BD), GolgiPlug (BD) and anti-CD107a-BV421 (BD) solution with RPMI 1640 + 10% FBS base media and incubated for 8 h at 37 °C. Samples were then stained with extracellular antibody mix including anti-CD3-BV786 (BD), anti-CD4-BV510 (BD), anti-CD8-Qdot605 (Invitrogen), and Live/Dead Fixable Near-IR (Thermo Fischer) for 20 min at 4 °C. Cell pellets were fixed and permeabilized for 2 h at room temperature with 1X Fixation/Permeabilization solution (eBioscience, Thermo Fischer). Cells were stained with intracellular antibodies anti-TNFα -APC (BioLegend), anti- IFNγ -PE-Cy7 (BD), anti-CD137-PE (BD) then resuspended in 100 µL of PBS and analyzed on Novocyte Quanteon (Agilent).
Boolean gating was applied in FlowJo (BD Biosciences) within the CD8+ and CD4+ populations (where applicable) to define all expression combinations of the activation markers CD137, IFNγ, and TNF. “Percent reactive” was defined by expression of two or more activation markers. Data were formatted using PESTLE (NIAID, NIH) to generate SPICE-compatible input files, with cytokine co-expression analyses performed using SPICE v6.0 (NIAID, NIH).
Chromium-release assays
A 3-fold dilution series of CD8+-selected NCP-TCR-T or donor matched NTD cells was made in RPMI + 10% FBS in a 96-well plate. 10,000 T2 cells transduced with HLA-A3 were pulsed with 4 µL of 10 mM stock peptide of interest and labeled with 40 µL of radioactive chromium-51 (Revvity) for one hour. Target cells were washed twice in RPMI 1640 + 10% FBS, then transferred to co-culture with effector cells. Minimum and maximum samples were established using replicate wells of target cells only and target cells with Triton-x (Sigma Aldrich) 10%. Co-culture was kept at 37 °C for 4 h. 100 µL of supernatant was then carefully removed from each well and analyzed for radioactivity using the Gamma Counter and WIZARD2® software. Percent lysis was calculated for each condition using the following formula:
$$\% \,{Lysis}=\,\frac{({Experimental}\,{measurement}-{Average}\,{of}\,{Minimum})}{({Average}\,{of}\,{Maximum}-{Average}\,{of}\,{Minimum})}\,x\,100$$
xCELLigence assay
Real-time cytotoxicity was assessed using the xCELLigence RTCA SP system (Agilent). Tumor cells were seeded into E-plates at a density of 10,000 cells per well for MM-21 and 20,000 cells per well for MM-23 in RPMI 1640 medium supplemented with 10% human AB serum. Impedance-based cell index was recorded every 30 min. Once the cell index approached 1.0, NCP-TCR-T and matched NTD control T cells were added at an effector-to-target (E:T) ratio of 3:1, with medium added to tumor-alone control wells. The cell index was normalized to the final measurement immediately prior to effector cell addition. The experiment continued for a total of 96 h. Data were analyzed by calculating the area under the cell index curve (AUC) for each condition, enabling quantitative comparison of target cell killing over time.
Statistical analysis and data visualization
Distributional differences between melanoma and normal tissue sample groups were assessed using nonparametric effect size estimation (Cliff’s delta) and Wilcoxon rank-sum test. ELISpot experiments use divergence from randomness (DFR) test as described by Moodie et al.48 SPICE calculates statistical differences using a built-in permutation test. Differences in polyfunctionality distributions between groups were assessed using the built-in permutation test (10,000 iterations). Graph Pad Prism 7 was used to run parametric two-tailed t tests for all other statistics, paired or unpaired as indicated in figure texts. Figures were made using Graph Pad Prism 7, BioRender, SPICE, or R Studio running R version 4.3.2. FlowJo v10.8.1 and NovoExpress version 1.6.2 were used for flow cytometry analysis. Peptide-HLA structural models generated using APE-Gen were visualized and rendered using UCSF ChimeraX v1.11.1.49 Other data analysis and visualization was conducted using Microsoft Office.
