


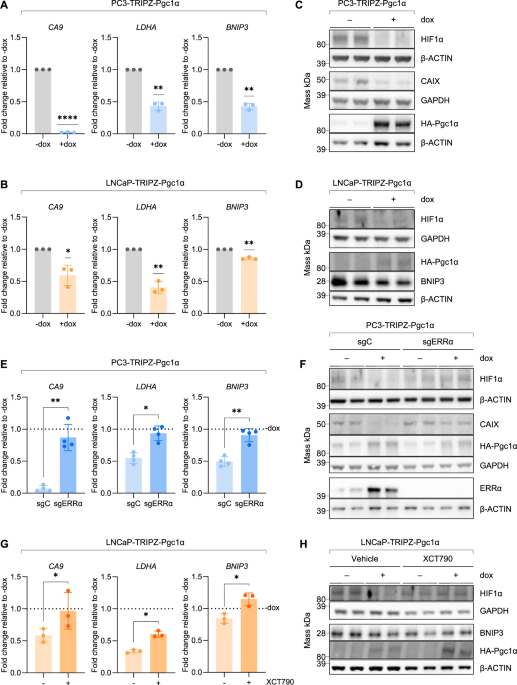
To investigate the relationship between PGC1α and hypoxia signaling in PCa, we took advantage of a Pgc1α-inducible doxycycline-dependent lentiviral system, which we transduced into PC3 prostate cancer cells [8]. Interestingly, upon Pgc1α induction, the expression of well-established HIF target genes (Carbonic anhydrase 9, CA9; Lactate dehydrogenase A, LDHA; and BCL2 interacting protein 3, BNIP3) was markedly suppressed at the mRNA level (Fig. 1A and Supplementary Fig. 1A, B), suggesting that PGC1α modulates hypoxia signaling in PCa cells. Next, to investigate whether this effect was influenced by AR (androgen receptor) status, we analyzed the impact of PGC1α in a similar inducible model established in LNCaP cells. As reported in PC3 cells, ectopic expression of Pgc1α also repressed HIF signaling in this AR-dependent cellular model (Fig. 1B and Supplementary Fig. 1C). This finding prompted us to explore whether PGC1α directly affects the HIF complex, particularly the expression of the oxygen-sensitive HIFα subunits. Remarkably, the expression of Pgc1α resulted in a strong reduction of both HIF1α and HIF2α, as well as the protein expression of HIF targets CAIX and BNIP3 in both PC3 and LNCaP cells (Fig. 1C, D and Supplementary Fig. 1D, E).
Fig. 1: PGC1α induction, acting through ERRα, downregulates HIF target gene expression and HIFα protein levels in PCa cell lines.
A, B RT-qPCR analysis of HIF target gene mRNA levels in PC3 or LNCaP cells, respectively, with or without Pgc1α induction (+/– 0.5 µg/mL doxycycline) for 48 h. C, D Representative Western blot analysis of PC3 or LNCaP cells treated as in (A, B). WCE (Whole-cell extracts) were subjected to SDS-PAGE followed by immunoblotting with HIF1α, CAIX/BNIP3, and HA antibodies (β-ACTIN or GAPDH were used as loading controls). E RT-qPCR analysis of HIF target gene mRNA levels in control (sgC) and ERRα knockout (sgERRα) PC3 cells treated with or without Pgc1α induction (+/– 0.5 µg/mL doxycycline) for 48 h. F Representative Western blot analysis of control (sgC) and ERRα knockout (sgERRα) PC3 cells treated as in (E). WCE were subjected to SDS-PAGE followed by immunoblotting with HIF1α, CAIX, HA, and ERRα antibodies (β-ACTIN or GAPDH were used as loading controls). G RT-qPCR analysis of HIF target gene mRNA levels in LNCaP cells treated with or without doxycycline-induced Pgc1α expression in the presence or the absence of 8 µM XCT790 for 48 h. H Representative Western blot analysis of LNCaP cells treated as in (G). WCE were subjected to SDS-PAGE followed by immunoblotting with HIF1α, BNIP3 and HA antibodies (β-ACTIN or GAPDH were used as loading controls). Abbreviations: C control, Dox doxycycline, kDa kilodalton, sg single-guide RNA. Statistical analysis: A, B One-sample t-test (hypothetical value = 1). E, G Two-tailed, paired Student’s t test. *p < 0.05, **p < 0.01, ****p < 0.0001. Error bars: standard deviation (S.D.).
While PGC1α is a versatile transcriptional co-activator interacting with a broad range of transcription factors, ERRα is the principal mediator through which PGC1α exerts its tumor-suppressive effects in the context of PCa [8, 10]. We therefore sought to elucidate the role of ERRα in PGC1α-driven inhibition of HIF signaling. To address this question, we employed two experimental approaches. First, we used a CRISPR/Cas9-mediated ERRα knockout in the PC3 cell line harboring doxycycline-inducible Pgc1α expression [10]. ERRα deletion abolished the ability of Pgc1α to suppress HIF1α protein levels and the expression of its targets (Fig. 1E, F and Supplementary Fig. 1F). In parallel, we pharmacologically targeted ERRα using XCT790, an inverse agonist with therapeutic potential [30]. After confirming the efficacy and specificity of this treatment (Supplementary Fig. 1G, I), we found that XCT790 partially rescued the repressive effect of Pgc1α on HIFα levels and HIF signaling in both PC3 and LNCaP cell models (Fig. 1G, H and Supplementary Fig. 1H). Notably, this effect was less pronounced than that observed upon genetic ablation of ERRα, indicating a proportional relationship between the extent of ERRα inhibition and the rescue of HIF signaling. Taken together, these findings establish ERRα as a major transcription factor mediating PGC1α-dependent repression of the HIF signaling pathway.
To gain deeper insights into the role of PGC1α in HIF signaling beyond in cellulo models, we assessed its impact in subcutaneous xenografts, which provide a more physiologically relevant context, incorporating key factors such as interactions with the tumor microenvironment (TME) and vascularization. We analyzed RNA and protein levels in xenografts generated by injecting nude mice with doxycycline-inducible Pgc1α-expressing PC3 cells, followed by dietary doxycycline administration (Supplementary Fig. 2A). Of note, mice were euthanized before Pgc1α-driven differences in tumor growth could be observed, in order to avoid potential confounding effects of tumor size. HIF target gene expression was significantly reduced in Pgc1α-expressing tumors (Fig. 2A). Furthermore, protein analysis by immunostaining and further quantification revealed a decrease in HIF1α levels in the presence of Pgc1α, consistent with our in cellulo findings (Fig. 2B and Supplementary Fig. 2B).
Fig. 2: PGC1α induction reduces HIF signaling output and HIFα protein abundance in PCa mouse models.
A RT-qPCR analysis of HIF target gene mRNA levels in PC3 xenografts with or without doxycycline-induced Pgc1α expression. B Representative immunohistochemical staining of HIF1α in PC3 xenografts with or without doxycycline-induced Pgc1α expression. C RT-qPCR analysis of HIF target gene mRNA levels in tumor-derived organoids from Ptenpc-/-; Ppargc1apc+/+ and Ptenpc-/-; Ppargc1apc-/- mouse models. D Representative immunohistochemical staining of HIF1α and HIF2α in prostate tumors from Ptenpc-/-; Ppargc1apc+/+ and Ptenpc-/-; Ppargc1apc-/- mouse models. E Quantification of the HIF1α and HIF2α immunohistochemical staining shown in (D). F RT-qPCR analysis of Ca9 mRNA levels in prostate tumors from Ptenpc-/-; Ppargc1apc+/+ and Ptenpc-/-; Ppargc1apc-/- mouse models. G Scatter plots displaying the correlation between the Hypoxiprobe and HIF1α staining in PC3 xenografts with or without doxycycline-induced Pgc1α expression. The linear regression line is shown with a 95% confidence interval (gray shading). Abbreviations: Dox doxycycline, GEMM genetically engineered mouse models, KO knock-out, WT wild type. Statistical analysis: A, C, E, F Two-tailed, Mann-Whitney U test. G Spearman’s correlation test (ρ), with p-values indicated at the top of each plot. *p < 0.05, **p < 0.01, ****p < 0.0001. Error bars: standard deviation (S.D.).
We next examined genetically engineered mouse models of PCa [8, 27]. First, we analyzed tumor-derived organoids arising from Ptenpc–/–; Ppargc1apc–/– double knockout mice compared with Ptenpc–/–; Ppargc1apc+/+ counterparts (Supplementary Fig. 2C). As anticipated, Pgc1α expression repressed HIF signaling (Fig. 2C). In line with these results, HIF1α and HIF2α levels and Ca9 expression were markedly higher in prostate tumors from 3-month-old Ptenpc–/–; Ppargc1apc–/– double knockout mice (Fig. 2D, E, F).
To further examine the spatial distribution of HIF1α accumulation, we performed double staining in serial tumor sections with Hypoxyprobe, a marker for tissue hypoxia, alongside HIF1α immunostaining (Fig. 2B and Supplementary Fig. 2D) [31]. We found a significant correlation between HIF1α and Hypoxyprobe staining in subcutaneous xenograft tumors derived from Pgc1α-expressing PC3 cells. In contrast, in the absence of Pgc1α the correlation was lost, suggesting that loss of PGC1α enables the expansion of HIF1α expression beyond oxygen-poor regions (Fig. 2G).
We next sought to get a deeper understanding of the mechanism underlying PGC1α-mediated repression of the hypoxia pathway. We first investigated whether ROS accumulation or glutamine metabolism modulates PGC1α-dependent regulation of HIF signaling in PCa cells, as reported in melanoma [26]. Our data revealed that Pgc1α suppressed HIF1α irrespective of the intracellular ROS levels, which were pharmacologically manipulated using the antioxidant N-acetylcysteine (NAC) and the pro-oxidants buthionine sulfoximine (BSO) and hydrogen peroxide (H2O2) (Supplementary Fig. 3A–D). Likewise, Pgc1α-mediated repression of HIF1α accumulation prevailed when we removed glutamine or inhibited glutaminase using BPTES (Supplementary Fig. 3E). These results suggest that glutamine metabolism and ROS levels are not major contributing factors for the PGC1α-mediated regulation of HIFα in PCa.
We assessed the requirement of oxygen for the action of PGC1α on HIF signaling by evaluating this phenotype in the presence of varying levels of oxygen tension. Similar to normoxia, Pgc1α induction upon moderate hypoxia (5% O₂) suppressed both HIF target gene expression and HIF1α protein levels in PC3 cell models (Fig. 3A, B). However, severe hypoxia (1% O₂) abolished the effect of Pgc1α expression on HIF signaling and HIF1α accumulation (Fig. 3C, D). Since PGC1α-mediated regulation of HIFα requires oxygen, we focused on the bona fide oxygen-sensing mechanism controlling HIFα stability [17, 19,20,21,22]. To test whether PGC1α-mediated downregulation of HIF1α relies on PHD activity, cells were treated with dimethyloxalylglycine (DMOG), a competitive inhibitor of 2-oxoglutarate (2-OG) that broadly targets the family of 2-oxoglutarate-dependent dioxygenases (2-OGDDs). Inhibition of PHDs abrogated the ability of Pgc1α to reduce HIF1α levels, indicating that this regulatory effect requires PHD activity (Fig. 3E). Since HIFα hydroxylation targets this subunit for proteasome-dependent degradation, we tested whether the proteasome was required for the action of PGC1α. Induction of the coregulator failed to reduce HIF1α levels upon proteasome inhibition with MG132 (Fig. 3F). Notably, we validated the oxygen and PHD activity dependency in LNCaP cells, confirming that PGC1α-mediated HIFα regulation operates through the canonical PHDs/proteasome-dependent degradation pathway (Supplementary Fig. 3F–H).
Fig. 3: PGC1α-mediated HIF1α regulation is oxygen-dependent and requires the canonical oxygen-sensing pathway.
A, C RT-qPCR analysis of HIF target gene mRNA levels in PC3 cells with or without Pgc1α induction (+/– 0.5 µg/mL doxycycline) upon normoxia (21% O₂) or hypoxia at (A) 5% O₂ and (C) 1% O₂ for 48 h. B, D Representative Western blot analysis of PC3 cells with or without Pgc1α induction (+/– 0.5 µg/mL doxycycline) for 48 h including the last 4 h upon normoxia (21% O₂) or hypoxia at (B) 5% O₂ and (D) 1% O₂. WCE were subjected to SDS-PAGE followed by immunoblotting with HIF1α and HA antibodies (GAPDH was used as a loading control). E, F Representative Western blot analysis of PC3 cells with or without Pgc1α induction (+/– 0.5 µg/mL doxycycline) for 48 h, including the last 5 h of treatment with (E) 1 mM DMOG or (F) 10 μM MG132. WCE were subjected to SDS-PAGE followed by immunoblotting with HIF1α and HA antibodies (GAPDH or β-ACTIN were used as loading controls). Abbreviations: Dox doxycycline, Nx normoxia (21% O₂), Hx hypoxia, DMOG dimethyloxalylglycine, kDa kilodalton. Statistical analysis: A, C One-sample t-test (hypothetical value = 1). *p < 0.05, **p < 0.01, ***p < 0.001, ****p < 0.0001. Error bars: standard deviation (S.D.).
To ascertain the influence of PGC1α on PHD function, we analyzed the mRNA levels of PHD1, 2, and 3 (encoded by EGLN2, 1, and 3, respectively) in the presence or absence of ectopic Pgc1α. Interestingly, Pgc1α selectively induced EGLN1 expression, which translated into PHD2 protein accumulation upon Pgc1α induction in PC3 cells (Fig. 4A, B). Of note, these results were further confirmed in the LNCaP model (Supplementary Fig. 4A, B). Moreover, the increase in PHD2 levels translated, as expected, into enhanced enzymatic activity, evidenced by increased levels of hydroxylated HIF1α upon Pgc1α induction and proteasome inhibition (Fig. 4C and Supplementary Fig. 4C).
Fig. 4: The PGC1α-ERRα-EGLN1/PHD2 axis controls HIF1α accumulation.
A RT-qPCR analysis of EGLN1-3 mRNA levels in PC3 cells with or without Pgc1α induction (+/– 0.5 μg/mL doxycycline) for 48 h. B Representative Western blot analysis of PC3 cells treated as in (A). WCE were subjected to SDS-PAGE followed by immunoblotting with PHD2, HIF1α and HA antibodies (GAPDH or β-ACTIN were used as loading controls). C Representative Western blot analysis of PC3 cells with or without Pgc1α induction (+/– 0.5 μg/mL doxycycline) for 48 h including last 4-hour of treatment with 20 μM lactacystin. WCE were subjected to SDS-PAGE followed by immunoblotting with HIF1α, Hydroxy-HIF1α (Pro564) and HA antibodies (GAPDH or β-ACTIN were used as loading controls). D Representative Western blot analysis in control (sgC) and ERRα knockout (sgERRα) PC3 cells with or without Pgc1α induction (+/– 0.5 µg/mL doxycycline) for 48 h. WCE were subjected to SDS-PAGE followed by immunoblotting with PHD2, HIF1α, HA and ERRα antibodies (GAPDH was used as loading control). E RT-qPCR analysis of EGLN1 mRNA expression in PC3 cells grown in xenograft with or without doxycycline-inducible Pgc1α expression. F, G ChIP-qPCR analysis of (F) Pgc1α and (G) ERRα binding to the EGLN1 promoter in PC3 cells with or without Pgc1α induction (+/– 0.5 μg/mL doxycycline) for 48 h. H Representative Western blot analysis in control (siControl) and EGLN-silenced (siEGLN1, siEGLN2 and siEGLN3) PC3 cells with or without Pgc1α induction (+/– 0.5 µg/mL doxycycline) for 48 h. WCE were subjected to SDS-PAGE followed by immunoblotting with HIF1α, PHD2 and HA antibodies (GAPDH was used as loading control). Abbreviations: Dox doxycycline, sg single-guide RNA, si small-interfering RNA, C control, kDa kilodalton, IP immunoprecipitation. Statistical analysis: A One-sample t-test (hypothetical value = 1). E Two-tailed Mann–Whitney U test. F, G Two-tailed, paired Student’s t test. *p < 0.05, ***p < 0.001. Error bars: standard deviation (S.D.).
To further explore the transcriptional mechanism underlying this regulation, we assessed the role of ERRα. Notably, Pgc1α failed to induce EGLN1 and PHD2 expression in the absence of ERRα or upon ERRα pharmacological inhibition in PC3 and LNCaP cells, respectively, indicating that ERRα is required for PGC1α-dependent upregulation of EGLN1/PHD2 (Fig. 4D and Supplementary Fig. 4D–F). Moreover, RNA analysis from the subcutaneous xenograft model, where doxycycline-inducible Pgc1α-expressing PC3 cells were injected into nude mice, showed that EGLN1 expression was significantly upregulated (Fig. 4E). Finally, Egln1 expression inversely correlated with the expression of the HIF target gene Ca9 in the Ptenpc–/–; Ppargc1apc–/– double knockout mouse prostate tissues (Supplementary Fig. 4G).
To gain further insight into how PGC1α elicits the accumulation of EGLN1, we performed a chromatin immunoprecipitation (ChIP) assay to assess the binding of PGC1α and ERRα to the EGLN1 promoter. Pgc1α was recruited to the EGLN1 promoter upon its induction, consistent with its role as a transcriptional co-activator (Fig. 4F and Supplementary Fig. 4H). The promoter region of GOT1, a known PGC1α target, was used as a positive control [32] (Supplementary Fig. 4I). In addition, ERRα was found to be bound to the EGLN1 promoter, and its occupancy significantly increased upon Pgc1α induction (Fig. 4G). These results indicate that the PGC1α/ERRα complex activates EGLN1 transcription, thereby contributing to elevated PHD2 protein expression.
To unequivocally determine the specific contribution of PHD2 to the regulation of HIF1α by PGC1α, we selectively silenced each of the three PHD isoforms and assessed the effect of Pgc1α induction on HIF1α protein levels. Silencing of EGLN2 or EGLN3 did not impair the ability of Pgc1α to reduce HIF1α levels, indicating that these isoforms are not required for its regulatory effect (Fig. 4H and Supplementary Fig. 4J). In contrast, EGLN1 knockdown impaired Pgc1α-mediated repression of HIF1α, demonstrating that this effect specifically depends on EGLN1/PHD2 (Fig. 4H and Supplementary Fig. 4J).
PGC1α functions as a tumor suppressor in PCa [8]. To investigate the contribution of the EGLN1/PHD2–HIF axis to this process, we stably silenced EGLN1 in Pgc1α-inducible PC3 cells using short hairpin RNAs (shRNAs) (Supplementary Fig. 5A). This experimental system allowed us to assess the impact of PHD2 depletion on PGC1α-dependent phenotypes. EGLN1 silencing did not affect the inhibitory effect of Pgc1α on two-dimensional PCa cell growth (Fig. 5A). However, it partially reversed Pgc1α-elicited inhibition of colony formation (Fig. 5B), suggesting that the PGC1α–EGLN1/PHD2–HIF axis contributes to the regulation of cell growth under stress.
Fig. 5: The PGC1α-PHD2-HIF axis plays a critical role in prostate cancer progression.
A Growth curve (relative to day 0) of shControl and shEGLN1-silenced PC3 cells with or without Pgc1α induction (+/– 0.5 μg/mL doxycycline). B Quantification of colony formation efficiency of shControl and shEGLN1-silenced PC3 cells with or without Pgc1α induction (+/- 0.5 µg/mL doxycycline) for 14 days. C Schematic representation of the tumor initiation study by subcutaneous injection of shControl and shEGLN1-silenced PC3 cells with or without Pgc1α induction by dietary supplementation. D Representation of the day of tumor appearance in mice injected as described in (C). E Schematic representation of the intracardiac xenotransplant assay performed to assess the metastatic capacity of PC3 GFP-Luc cells expressing shControl or shEGLN1-silenced cells with or without Pgc1α dietary induction. F, G Evaluation of metastatic lesions in the head of mice injected as described in (E). Representative images (F) and IVIS total photon flux normalized to time 0 (G). H Scatter plots displaying the correlation between the PGC1α-ERRα activity signature and EGLN1 expression across three independent PCa datasets: Taylor et al. [33] (n = 131 primary tumors; n = 19 metastases), Fraser et al. [34] (n = 73 primary tumors) and Robinson et al. [35] (n = 82 metastases). The linear regression line is shown with a 95% confidence interval (gray shading). Abbreviations: Dox, doxycycline; sh, short hairpin RNA; Scr, scrambled control; kDa, kilodalton. Statistical analysis: A, B Two-tailed, paired Student’s t test. B One-sample t-test (hypothetical value = 1). D, G Two-tailed, Mann-Whitney U test. H Spearman’s correlation test (ρ), with p-values indicated at the top of each plot. *p < 0.05, **p < 0.01, ***p < 0.001, ****p < 0.0001. #p < 0.05 (# indicates significance for the paired Student’s t test in (B)). Error bars: standard deviation (S.D.).
To test the in vivo relevance of these findings, we conducted two complementary studies. We first performed a tumor initiation subcutaneous xenograft assay, a functional in vivo approach used to determine tumor latency, defined as the time to tumor emergence. Thus, we injected nude mice (n = 20 mice per condition) with either shControl or shEGLN1-silenced doxycycline-inducible Pgc1α-expressing PC3 cells, and recorded tumor onset for each of the four experimental groups (Fig. 5C). As reported in prior studies, Pgc1α expression in shControl cells significantly delayed tumor onset and extended disease-free survival in mice. In shEGLN1 cells, gene silencing delayed basal tumor formation, and also reduced Pgc1α-elicited tumor-suppressive effect (Fig. 5D and Supplementary Fig. 5B).
To further validate and expand these findings, we conducted a complementary in vivo study to assess the role of the EGLN1/PHD2–HIF axis in mediating the suppressive effect of PGC1α on metastasis. For this approach, shControl and shEGLN1-silenced doxycycline-inducible Pgc1α-expressing PC3 cells were transduced with a GFP-Luc reporter. Cells were then injected intracardially into the left ventricle of immunodeficient nude mice, and metastatic outgrowth was monitored by luciferase signal for 20 days using IVIS imaging (Fig. 5E). Notably, the suppressive effect of PGC1α on metastatic burden in the head of mice was largely compromised in shEGLN1-silenced cells (Fig. 5F, G). Ex vivo analysis of luciferase signal in distal organs confirmed that EGLN1 knockdown tempered the ability of Pgc1α to reduce metastatic burden (Supplementary Fig. 5C–E). Altogether, these results support a key role for the EGLN1/PHD2-HIF axis in mediating PGC1α-driven suppression of metastatic dissemination in PCa.
Finally, to assess the clinical relevance of the PGC1α/ERRα–PHD2 regulatory axis in human PCa, we examined the correlation between the PGC1α/ERRα transcriptional activity signature, which inversely correlates with PCa aggressiveness, and EGLN1 (PHD2) expression in publicly available PCa patient datasets [8, 33,34,35]. All three datasets consistently showed a statistically significant positive correlation between PGC1α–ERRα activity and EGLN1 levels, indicating that the PGC1α/ERRα–PHD2 regulatory pathway is preserved in human primary and metastatic PCa specimens (Fig. 5H).
