


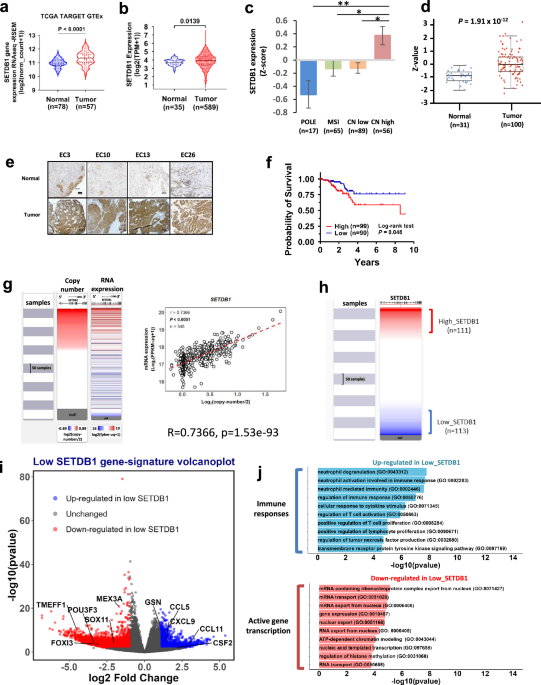
Overexpressed SETDB1 predicts worse survival and an active gene transcription signature
Elevated SETDB1 expression has been reported across many cancer types, including EC [3, 4]. Using the Pan-Cancer TCGA (The Cancer Genome Atlas) and CPTAC (Clinical Proteomic Tumor Analysis Consortium) dataset, elevated SETDB1 was found in most tumor types at both mRNA and protein levels (supplementary Fig. 1a, b). In the CPTAC dataset, SETDB1 exhibited the highest expression in EC among the eight tested tumor types (supplementary Fig. 1c). To verify SETDB1 overexpression in EC, we used two available datasets: EC-TCGA TARGET and GDC TCGA. First, in EC-TCGA GTEX dataset, we confirmed substantially higher SETDB1 expression in tumor samples (n = 57) (mean =11.31) compared to normal tissues (n = 78) (mean = 10.97) (p < 0.0001) (Fig. 1a). In the GDC TCGA dataset, we confirmed significantly higher SETDB1 expression in tumors (n = 589) than normal (n = 35) (p = 0.0139) (Fig. 1b).
The TCGA classifies EC into four molecular subtypes (1) PolE/ultra-mutated (Polymerase Epsilon mutation), (2) MSI/ hypermutated (Microsatellite Instability), (3) CNL/NSMP (Copy Number Low/No Specific Molecular Profile), and (4) CNH/p53abn (Copy Number High and p53 abnormal) [20, 21]. We found that SETDB1 is highest in the CNH group (Fig. 1c), which is the most aggressive and poorly immunogenic subtype of EC. Elevated SETDB1 expression at mRNA levels (Fig. 1a–c) were further confirmed at protein levels in tumors using the CPTAC dataset (Fig. 1d).
To visualize SETDB1 expression using immunohistochemistry (IHC) staining, 76 patient tumors with matched adjacent non-malignant tissues were collected from the University of Iowa Hospital and Clinics, confirming higher SETDB1 protein expression in many tumors (Fig. 1e). Using the EC-TCGA dataset, we verified that patients with high SETDB1 expression had more unfavorable outcomes (p = 0.048) (Fig. 1f and supplementary Fig. 1d). Additionally, we confirmed a strong positive correlation (r = 0.7366, p = 1.53e-93) between copy number and mRNA expression (Fig. 1g) in EC, consistently observed in other cancers [7].
To understand the gene expression landscape of high and low SETDB1 groups, we conducted transcriptomic analysis using the EC-TCGA. We divided EC-TCGA patients into high (n = 111) and low (n = 113) SETDB1 expressing subgroups and conducted differential gene expression analyses (Fig. 1h). Patients with high SETDB1 levels presented greater expression of genes related to active transcription signature, including many mRNA transcription regulators (Fig. 1i, j). In contrast, those with lower SETDB1 levels expressed high levels of immune response genes, such as CCL5, CXCL9, and CCL11 (Fig. 1i, j). These findings highlight the critical functions of SETDB1 in EC and provide insights into the potential downstream genes and pathways influenced by SETDB1 expression levels in EC.
SETDB1 depletion decreases EC cell proliferation in vitro
To uncover the pivotal role of SETDB1 in driving EC cell proliferation, we started our investigation with three established EC cell lines and expanded to our three novel primary patient-derived EC cell lines (PDCs). We designed three sgRNA to knockout SETDB1 using CRISPR-Cas9 in Ishikawa (poorly differentiated), ECC1 (well-differentiated), and Hec50 (serous) cell lines. We successfully generated numerous knockout clones, achieving near-total depletion of the SETDB1 protein (supplementary Fig. 2a, c, e).
Our initial in vitro experiments revealed that knockout cells exhibited a markedly reduced growth rate compared to wild-type (WT, non-target sgRNA) cells, though with some variability (supplementary Fig. 2b, d, f). We selected one knockout clone per sgRNA (totaling three knockout clones) and confirmed SETDB1 depletion (supplementary Fig. 3a, c, e).
To delve deeper, we monitored the proliferation of these EC cells over four days (supplementary Fig. 3b, d, f). Remarkably, SETDB1 depletion consistently inhibited cell proliferation across all tested knockout clones. Specifically, Ishikawa SETDB1–/– clones showed approximately 10-30% reduction compared to WT (supplementary Fig. 3b). Similarly, ECC1 and Hec50 cells with SETDB1 depletion demonstrated a dramatic 30-60% decrease in proliferation across all tested clones (supplementary Fig. 3d, f). Our results repeatedly demonstrated that SETDB1 is crucial in driving EC cell proliferation in three different EC subtypes (supplementary Fig. 1; 2b, d, f).
To extend these findings to patient tumors, we utilized PDCs to investigate SETDB1’s role in EC cell proliferation. We selected PDC4 (Grade 2 EC), PDC8 (serous EC), and PDC10 (recurrent EC) as representative examples. We confirmed successful SETDB1 knockout, which led to a significant reduction in cell proliferation by 30–40% (Supplementary Fig. 3h–j). This finding confirmed the critical function of SETDB1 in promoting EC cell proliferation in patient models.
In summary, our data from SETDB1 depletion in six EC cell models underscore its critical role in driving EC cell proliferation.
Depleting SETDB1 significantly slows down tumor growth and prolongs mice survival in vivo
To investigate whether oncogene SETDB1 promotes tumor growth, we injected SETDB1–/– EC cells (Ishikawa, ECC1, and Hec50) into NSG mice (NOD.Cg-Prkdcscid Il2rgtm1Wjl/SzJ) subcutaneously on their left and right flanks. SETDB1 depletion was confirmed by western blotting (as shown in Fig. 2a, d, g). Our results showed that SETDB1 knockout significantly slowed tumor growth rate across all cell lines (Fig. 2b, e, h). The most significant reduction was observed in the Ishikawa cell line. Remarkably, mice bearing SETDB1–/– tumors exhibited a substantially extended survival, up to 100 days for Ishikawa and ECC1, and 60 days for Hec50 (Fig. 2c, f, i).
To further confirm these findings, we conducted a fixed time point experiment for Ishikawa cells. The SETDB1–/– tumors demonstrated significantly smaller volumes (93.1% reduction) and weights (92.2% decrease) (Fig. 2j, k, l). These experiments were performed multiple times with consistent and reproducible results (Supplementary Fig. 4a, b). Altogether, our data illustrate that knockout of SETDB1significantly inhibits tumor growth and prolongs survival in NSG mice.
SETDB1 enhances oncogenes and represses tumor suppressor genes
To determine downstream genes controlled by SETDB1, we conducted transcriptomic analysis on our three Ishikawa knockout clones and WT control (shown in Fig. 2a, b). We compared differential gene expression and observed 677 shared genes significantly altered in all SETDB1–/– clones (Fig. 3a). Gene set enrichment analysis (GSEA) revealed that genes associated with Mitotic Spindle and G2M Checkpoint were the most significantly downregulated biological processes in SETDB1–/– cells (Fig. 3b). Conversely, some genes belonging to IFNα and IFNγ pathways were among those upregulated in SETDB1–/– (Fig. 3c). RNA-sequencing revealed two groups of representative genes altered in SETDB1–/– cells: Group 1, containing upregulated genes (repressed by SETDB1) mainly functioning as tumor suppressors; and Group 2, containing downregulated genes (promoted by SETDB1) that are mainly oncogenes involved in active gene transcription and cell proliferation (Fig. 3d, e).
Representative Group 1 genes repressed by SETDB1 include PGR (Progesterone Receptor), RERG (RAS-Like Estrogen-Regulated Growth Inhibitor), ZNF582 (Zinc finger protein 582), and DHRS2 (Dehydrogenase/Reductase 2). SETDB1 depletion led to the upregulation of these genes. Among the most upregulated Group 1 genes were PGR and RERG, demonstrating a remarkable 10-14 fold and 3-9 fold upregulation, respectively (Fig. 3f). PGR is reported as an ultimate tumor suppressor gene in EC [22]. RERG is a tumor suppressor in breast [23], prostate [24], nasopharyngeal [25], and glioma [26] cancers. ZNF582, a zinc-finger transcription factor, is one of the few reported tumor suppressors among zinc finger proteins [27]. DHRS2 has also been reported to have a tumor suppressor role in ovarian, lung, nasopharyngeal and esophageal cancers [28,29,30,31]. Next, we used the SETDB1–/– tumors to verify the expression of these target genes and recapitulated SETDB1-mediated RERG and ZNF582 repression (Fig. 3g). To generalize the SETDB1-regulated downstream genes, we used additional SETDB1–/– clones and verified upregulation of RERG and ZNF582 by 40-60 fold and 4-5 fold, respectively (Supplementary Fig. 5a).
Next, we evaluated the clinical relevance of SETDB1 target Group 1 genes in EC. These genes showed higher expression in normal tissues in TCGA (Supplementary Fig. 5b, c) and CPTAC (Supplementary Fig. 5d) datasets. Using the TCGA dataset, Group 1 genes correlated with better patient survival overall (Supplementary Fig. 6a).
In contrast, SETDB1 promoted Group 2 genes, including FLNA (Filamin A), POLR2A (RNA polymerase II), CD47, MSH6 (mutS homolog 6), and MUC5AC. SETDB1 depletion resulted in the downregulation of these genes. FLNA, POLR2A, and MUC5AC were among the most downregulated genes, with fold changes ranging from 0.07–0.29, 0.24–0.5, and 0.05–0.35, respectively (Fig. 3h). FLNA is crucial for maintaining cell shape and movement [32]. POLR2A is an essential transcription gene controlling rapid cell proliferation [33]. CD47, a “do-not-eat me” signal, is often upregulated in cancer to prevent immune clearance [34]. MSH6, a critical mismatch repair gene, is associated with worse survival in many cancers despite its mutation increasing cancer susceptibility [35]. MUC5AC promotes cancer progression and metastasis in various cancers [36]. Consistently, we confirmed the downregulation of FLNA, MSH6, and MUC5AC in SETDB1–/– tumors (Fig. 3i). To generalize the SETDB1-regulated downstream genes, we used additional SETDB1–/– Ishikawa clones and verified POLR2A downregulation by 0.25-0.75 fold in clone sg1-12 and sg3-12 (Supplementary Fig. 5a).
Next, we evaluated the clinical relevance of SETDB1 target Group 2 genes in EC. These genes showed lower expression in normal tissues in TCGA (Supplementary Fig. 5e, f) and CPTAC (Supplementary Fig. 5g) datasets. Using the TCGA dataset, Group 2 genes correlated with unfavorable patient survival overall (Supplementary Fig. 6b).
To further validate our findings, we examined two additional cell lines, ECC1 and Hec50. In SETDB1–/– ECC1 cells, MUC5AC was downregulated, while PGR and ZNF582 were upregulated (Fig. 3j). In SETDB1–/– Hec50 cells, ZNF582 was upregulated, and CD47 was downregulated (Fig. 3l). Furthermore, we recapitulated similar results in SETDB1–/– tumors. With RERG and ZNF582 upregulated in ECC1 tumors (Fig. 3k), while ZNF582 was upregulated, and FLNA and POLR2A were downregulated in SETDB1–/– Hec50 tumors (Fig. 3m). These findings demonstrate that while SETDB1 regulates a range of target genes, ZNF582 regulation is consistently observed across multiple cell types, underscoring its potential as a key downstream effector of SETDB1. Other target genes exhibit cell-type-specific regulation, reflecting the contextual roles of SETDB1.
To validate which genes are directly regulated by SETDB1 and to determine whether their induction or repression requires its catalytic activity, we overexpressed either wild-type SETDB1 (SETDB1WT) or the catalytically inactive H1224K mutant (SETDB1H1224K) in our SETDB1–/– cell line (Fig. 3n). Consistent with this goal, DHRS2 and ZNF528 were markedly upregulated in the absence of SETDB1. Overexpression of SETDB1WT and SETDB1H1224K significantly and partially reversed this upregulation in both genes, indicating that SETDB1-mediated repression does not require its catalytic activity (Fig. 3o). For many SETDB1-dependent downregulated genes, including FLNA, FLNB, and POLR2A, although the changes did not reach statistical significance, there was a modest trend toward increased expression with SETDB1WT, but not with SETDB1H1224K. As for MUC5AC, NUP210, and POM121, neither SETDB1WT nor SETDB1H1224K expression restored significant changes compared to the knockout condition (Fig. 3p). Together, these data suggest that SETDB1 regulates its downstream genes through multiple mechanisms, some of which may be enzymatic and direct, whereas others likely operate through indirect or catalytic-independent pathways.
To find the clinical application of SETDB1 and its target genes, we identified four downstream genes, along with SETDB1, providing a predictive model for EC tumor grades and patient outcomes. We named these genes “SETDB1 activity signature” genes. The three-gene signature “SETDB1 + MSH6-PGR” can distinguish EC grades from one another (Fig. 3q). The three-gene signature, “SETDB1 + CD47-PGR” correlates with worse patient prognosis (p = 3.016e-7) (Fig. 3r). These data emphasize the importance of SETDB1 in EC progression and outcomes.
SETDB1 binds scaffold attachment regions (SARs) at centromeres and represses ZNF genes via H3K9me3 deposition at their promoters
SETDB1 has been reported to regulate gene expression by directly binding to the gene’s promoter region in different systems [2, 37, 38]. To explore SETDB1 binding sites on a whole-genome level, we conducted ChIP-seq for H3K9me3 and SETDB1 on Ishikawa cells. To further characterize the genome‑wide distribution of these enrichment domains, we annotated wild-type SETDB1 and H3K9me3 ChIP‑seq peaks using ChIPseeker. The chromosomal distribution of SETDB1 and H3K9me3 binding is shown in Supplementary Fig. 7a. ChIPseeker analysis revealed that SETDB1, H3K9me3, and their overlapping peaks are predominantly localized to distal intergenic regions, with substantial overlap between the two datasets (Supplementary Fig. 7b-e).
ChIP-seq data surprisingly revealed that SETDB1 binds dominantly to the SARs of pericentromeres on chromosome (chr) 3 (Fig. 4a) and chr 4 (Fig. 4b) with a strikingly high signal intensity of ~ 90,000 (chr 3) and ~2000 (chr 4). Knockout of SETDB1 abolishes its binding, which we termed “Type I: irreplaceable constant binding.” A 2022 Science paper identifies SAR, termed “Hsat1A,” on chr 3, 4, 8, 13, 14, 21 and 22 [39]. In addition to chr 3 and 4, we confirmed the prominent binding peak of H3K9Me3 and SETDB1 on chr 8, 14, and 22, with less significant peaks on chr 13 and 21 (Fig. 4c–e). While H3K9me3 has been reported to bind centromeres [40], our findings demonstrate SETDB1 binding at centromeres in human cancer cells, highlighting a novel and unexpected role for SETDB1.
Fig. 4: SETDB1 directly binds SARs on the centromeres and deposits H3K9me3 on ZNF gene promoters.
a–e ChIP-seq H3K9me3 and SETDB1 peaks related to enrichment for genomic DNA sequences corresponding to different peri-centromeric regions within chromosomes 3, 4, 8, 14, and 22, respectively, for both wild-type and SETDB1 knock cells. The Y-axis is labeled only on the first sample, but the scale is consistent across all samples. f ChIP-seq H3K9me3 and RNA-seq peaks on an enriched ZNF gene cluster region within chromosome 19 for both wild-type and SETDB1 knockout cancer cells.
Besides SETDB1 binding to the pericentromere, our ChIP-seq illustrated that SETDB1-mediated H3K9Me3 directly binds to many ZNFs to repress their expression; SETDB1 depletion leads to ZNF upregulation (Fig. 4f). Interestingly, SETDB1 deposits the H3K9Me3 mark on ZNFs but then dissociates from the site (Supplementary Fig. 7f). To verify H3K9Me3 binding to ZNF, ChIP-PCR was conducted. We found that H3K9Me3 binds directly to ZNF266, ZNF841, ZNF582, while this binding was lost in the SETDB1–/– cells (Supplementary Fig. 7g). To validate this result, we repeated this experiment with one additional clone and achieved similar results (Supplementary Fig. 7h). We termed this binding pattern as “Type II: irreplaceable transient binding,” highlighting SETDB1’s role in depositing repressive marks and then leaving, ensuring gene repression is maintained.
Knockout of SETDB1 causes abnormal chromosome division during mitosis
While we know SETDB1 binds to the SAR of the pericentromere, we lack alternative verification methods. We were inspired by two papers on Setdb1 depletion in mouse germlines that reported that loss of Setdb1 impairs meiosis and mitosis [41]. In mouse oocytes and early embryos, it was reported that loss of Setdb1 significantly impaired kinetochore-spindle interactions, bipolar spindle organization, and chromosome segregation. Thus, we applied immunofluorescent (IF) labeling using β-tubulin for the tubulin spindle, γ-tubulin for the centrosome, and DAPI for the chromosome. In contrast to the Ishikawa wild-type cells (Fig. 5a, a1–3, and Supplementary Fig. 8a, a1-4), we were excited to find that SETDB1–/– cells showed multiple γ-tubulin poles during mitosis, generating three, four, and even six poles of γ-tubulin (Fig. 5b, b1–6 and Supplementary Fig. 8b, b1-6). These multiple poles led to either micronuclei (Supplementary Fig. 8b, b7) or three poles of dividing cells (Fig. 5b, b2 and Supplementary Fig. 8b, b8-9). Overall, SETDB1–/– generated 12% of abnormal mitotic cells, while the wild type had only 2.5% of abnormal mitotic cells (Fig. 5c).
Fig. 5: Knockout SETDB1 leads to defect in chromosome segregation.
a, b Representative Immunofluorescence staining images of bipolar and multipolar mitotic cells in wildtype and SETDB1 knockout Ishikawa cells respectively. Red: γ-tubulin, green: β-tubulin, blue: genomic DNA. Red arrowhead points to the abnormal mitotic cells. c Percent multipolar mitotic cells quantification in wildtype and SETDB1 knockout cells (n = 3 biological replicates). More than 80 mitotic cells in different fields were analyzed for abnormalities in each biological replicates within wildtype and Knockout groups and the percent of multipolar cells were quantified. d, e Representative Immunofluorescence staining images of bipolar (normal) and multipolar mitotic cells in wildtype and SETDB1 knockout PDC4 and 10 cell lines. Red: γ-tubulin, green: β-tubulin, blue: genomic DNA. Red arrowhead points to the abnormal mitotic cells. f Percent multipolar mitotic cells in wildtype and SETDB1 knockout cells in PDC4, 10 cell lines. (n = 3 biological replicates) More than 25 mitotic cells in different fields were analyzed for abnormalities in each biological replicates within wildtype and knockout groups and the percent of multipolar cells were quantified. g Graphical scheme illustrating loss of SETDB1 results in loss of H3K9me3 and SETDB1 at peri-centromeric regions within different chromosomes. Knocking out SETDB1 can further promote abnormal cell division in the form of multipolar spindle formation during mitosis. c, f, Data shown as mean ± SD. P values were calculated using Unpaired t-test with Welsh’s correction.
Building on our findings in Ishikawa cell lines, we extended our experiments to two novel PDC cell lines (PDC4 and PDC10). Strikingly, imaging revealed the presence of multipolar cells in both cell lines (Fig. 5d, e and Supplementary Fig. 8c, d). Specifically, in PDC10, a recurrent primary EC cell line, there was about 38% abnormal cell division in the knockout cells versus about 18% of abnormal mitotic cells in wildtype (Fig. 5f). These findings highlighted the potential significance of SETDB1 governing proper cell division, shown in a graphical schema (Fig. 5g), and prompted us to explore potential mechanisms underlying this defect. Transcriptomic analysis revealed that SETDB1 loss reduces the expression of multiple sentinel mitotic-fidelity genes, including KNL1 and BUB1 (spindle checkpoint signaling), TUBGCP4 and DYNC1H1 (spindle pole organization), SMC1A (chromatid cohesion), and MACF1 (cytoskeletal crosslinking), as shown in the accompanying heatmap (Supplementary 8e), providing plausible molecular pathways through which SETDB1 deficiency may lead to pericentriolar material (PCM) fragmentation and subsequent multipolar spindle formation.
SETDB1 promotes immune evasion through blocking macrophage infiltration as well as promoting tumor proliferation
SETDB1–/– tumors appear to grow at a significantly slower pace in mice compared to in cell culture. This led us to conclude that other external factors may contribute to tumor regression. Considering the importance of the immune system’s role in tumor growth, we conducted an analysis of the immune microenvironment within Ishikawa wildtype and SETDB1–/– tumors. Since NSG mice are immune-compromised and lack key components of the adaptive immune system (ex. B-cells and T-cells) as well as NK cells, the innate immune system, primarily macrophages and granulocytes, constitutes the main cellular components present. Focusing on the CD11b + F4/80+ macrophage compartment in tumors, we observed a significantly higher presence of macrophages in SETDB1–/– tumor than the wildtype by flow cytometry (Fig. 6a, b). Moreover, IHC staining of mouse tumor tissues with macrophage specific F4/80 antibody also showed greater infiltration of macrophages in SETDB1–/– tumors (Fig. 6c). Further, mitotic figures assessment showed greater than 2-fold reduction in SETDB1–/– tumors (Fig. 6d). Staining tumors with proliferation markers Ki67 and pHH3-ser10 confirmed reduced proliferation in SETDB1–/– tumors (Fig. 6e–g). Overall, we demonstrated that SETDB1 promotes EC tumor progression through dual mechanisms: an extrinsic mechanism that represses immune cell infiltration into tumors and an intrinsic mechanism that promotes tumor growth.
Fig. 6: Knockout of SETDB1 promoted increased infiltration, recruitment of macrophages and decreased proliferation in the tumor.
a Representative gating strategy on CD11b + F4/80+ macrophages in wildtype and SETDB1–/– Ishikawa tumors. The numbers on the plot represent the percent of macrophages from the total viable CD45+ cells. b Percent CD11b + F4/80+ macrophages quantification (out of the total CD45+ population) in wildtype and SETDB1–/– Ishikawa tumors (n = 10 per group). c Immunohistochemistry (IHC) staining for F4/80 on wildtype and SETDB1–/– Ishikawa tumors. Red pointers represent brown-stained F4/80+ macrophages and black pointers represent mitotic cells. Top and bottom scale bars represent 160 and 80μm respectively. d Quantification of mitotic figures per area (mm2) in wildtype and SETDB1–/– Ishikawa tumors as an indicator of tumor proliferation (n = 4 biological replicates). e Representative images of IHC stained wildtype and SETDB1–/– Ishikawa tumors for SETDB1, Ki67, and phospho-H3S10 on histone (pHH3-ser10). f Percent measurement of Ki67 positive cells in wildtype and SETDB1–/– Ishikawa tumors (n = 4 per group). g Percent measurement of pHH3 positive cells in wildtype and SETDB1–/– Ishikawa tumors (n = 4 per group). Statistical tests: Student’s t-test (b) Mann-Whitney U test (d) Unpaired Student’s t-test (f, g). ns, not significant.
Mechanisms of SETDB1-mediated immune escape: repression of repeat elements and interferon pathway
It has been reported that repeat elements and interferon pathways are crucial in activating innate immune responses. To investigate whether these elements and pathways are involved in macrophage recruitment, we analyzed the RNA expression of these genes in SETDB1–/– tumors. We observed upregulation of multiple endogenous retroviruses (ERVs), including ERV class I and II (Supplementary Fig. 9a). Members of the interferon α and γ pathways such as TRIM21, PARP12, HLA-C, and CD40, showed increased expression in SETDB1–/– cells and were among the most significantly altered genes (Supplementary Fig. 9b). Overexpression of SETDB1WT or the catalytic-inactive mutant failed to rescue the increased gene expression of HLA-C, IRF5 and TRIM21 (Supplementary Fig. 9e). Additionally, members of LINE (Long Interspersed Nuclear Elements) and SINE (Short Interspersed Nuclear Elements) exhibited significant elevation in SETDB1–/– cells (Supplementary Fig. 9c, d). Collectively, these findings suggest that SETDB1 mediates immune escape through the repression of repeat elements and interferon pathways.
SETDB1–/– EC cells upregulate CCL5 expression in tumor and macrophage
The role of SETDB1 in the regulation of immune related pathways in cancer has previously been well established. Given that we observed infiltration of macrophages in SETDB1–/– tumors, we aimed to uncover a possible mechanism by which SETDB1 depletion leads to greater macrophage recruitment. We screened 17 mouse chemokines and found several, such as Cxcl10, Ccl3, Ccl4, and Ccl5, showing significant upregulation in SETDB1–/– tumors (Supplementary Fig. 10a, b). Notably, neutrophil-related chemokines, such as Cxcl1 and Cxcl2, did not show significant alterations (Supplementary Fig. 10c), which aligns with our observation that SETDB1 knockout does not affect neutrophil infiltration in tumors. (Supplementary Fig. 10d, e).
It was reported that type I and II interferons show upregulation in SETDB1–/– cancer cells, such as in AML and in particular types of immune cells, such as helper T cells [42, 43]. To identify human-specific cytokines that may impact macrophage recruitment by cancer cells, we performed qPCR. Among the cytokines tested, only CCL5 showed the most upregulation in SETDB1–/– tumors (Fig. 7a). Considering CCL5’s crucial function in promoting recruitment of immune cells (macrophages and T cells) [44], we focused on CCL5 expression across different cells and tumors. We confirmed the upregulation of CCL5, as well as CXCL9, another important chemokine involved in immune cell recruitment, in our fixed timepoint mice SETDB1–/– tumors (Fig. 7b).
Fig. 7: SETDB1–/– EC cells upregulate CCL5 expression in tumor and macrophage.
For all experiments performed in Ishikawa cells/tumors, a Quantification of human-specific cytokines and interferons mRNA expression in SETDB1–/– and wildtype tumors (n = 4/group). b mRNA expression of CXCL9 and CCL5 in SETDB1–/– and wildtype tumors from fixed timepoint tumor harvest (n = 4/group). c Quantification of CCL5 mRNA expression in SETDB1–/– and wildtype cell lines (n = 3 technical replicates). d Representative gating strategy for CCL5 + CD45-EpCAM+ wildtype, 1-7 and 3-3 SETDB1–/– tumors. e Percent quantification of CCL5+ cancer cells in wildtype, 1-7 and 3-3 SETDB1–/– tumors (n = 6/group). f Representative gating strategy for percent CCL5+ macrophages in SETDB1–/– and wildtype tumors. g Percent CCL5+ macrophages in SETDB1–/– and wildtype tumors (n = 6/group). h Representative fields of migrated RAW264.7 macrophages co-cultured with wildtype (WT), and two SETDB1–/– clones (1-12 and 3-12) Ishikawa cells in the Transwell migration assay. i Quantification of RAW264.7 macrophages migrated per captured field for WT, and SETDB1–/– (1-12 and 3-12) co-cultured conditions in Transwell migration assay (n = 9/group). j Representative fields of migrated RAW264.7 macrophages co-cultured with wildtype (WT), SETDB1–/– (KO), SETDB1–/– + Maraviroc (KO + MVC), and SETDB1–/– + TAK-779 (KO + TAK) ISHIKAWA cells in Transwell migration assay. k Quantification of the number of RAW264.7 macrophages migrated per captured field for wildtype (WT), SETDB1–/– (KO), SETDB1–/– + Maraviroc (KO + MVC), and SETDB1–/– + TAK-779 (KO + TAK) ISHIKAWA cells co-cultured in Transwell migration assay (n = 9/group). l CCL5 mRNA expression across normal and tumor tissues in the CPTAC dataset (Normal: n = 45, and Tumor: n = 459). m CCL5 mRNA expression across different EC subtypes. n Kaplan Meier curve illustrating patient prognosis for CCL5 high (n = 407) and low (n = 134) groups. o Heatmap and scatter plot displaying correlation for SETDB1 and CCL5 mRNA expressions utilizing EC-GDC TCGA dataset (n = 583). Heatmaps (p) and scatter plots (q) illustrating correlations for SETDB1 mRNA expression with T cell markers, and macrophage recruiting cytokines in EC-GDC TCGA dataset (n = 583), respectively. Pearson correlation (r) and p values (P) are being displayed on the plot (n = 583). r, s Images depicting IHC staining for SETDB1, CCL5, and CD8A on SETDB1 high and low expressing EC tumors respectively. Scale bar represents 100μm. For c, Data shown as mean ± SD. For a, b, e, g, i, Data shown as mean ± SEM. In h, boxplots display the full data range. The low and high ends of the box represent 25th and 75th percentiles, respectively. The middle horizontal line represents the median, with all data points displayed. Statistical tests: Two-way ANOVA (a, b), Welsh’s ANOVA (c, g), One-way ANOVA (e, m) with post hoc Sidak (a, b), Dunnett’s T3 (c, g), Dunnett’s (e, k), Bonferroni (m) tests. Welch’s t-test (l), Log-Rank test (n), Pearson’s correlation coefficient (q, o). ns, not significant.
Like SETDB1–/– tumors, CCL5 upregulation was confirmed in two SETDB1–/– clones (Fig. 7c). This upregulation was also evident (up to 40% more) at the protein level when analyzing human EpCAM+CD45- cancer cells in SETDB1–/– tumors through flow cytometry (Fig. 7d, e). Besides elevated CCL5 in SETDB1–/– cancer cells, significant CCL5 upregulation was also observed in tumor-associated CD11b + F4/80+ macrophages (Fig. 7f, g). These findings indicate that SETDB1 regulates CCL5 in EC. Using the Transwell migration assay, we co-cultured the mouse macrophage cell line RAW264.7 with either WT cells or two different SETDB1–/– clones (1-12 and 3-12). Macrophages exhibited an approximately 8- to 14-fold increase in migration when co-cultured with SETDB1–/– cells compared to WT (3-12 = 138.8, 1-12 = 79, WT = 9.4) (Fig. 7h, i). In a separate experiment, SETDB1 deletion similarly enhanced macrophage migration by approximately twofold relative to WT (KO = 59.8 vs. WT = 29.2). Targeting the CCL5 receptor CCR5 with two CCR5 inhibitors, Maraviroc (MVC) and TAK-779 (TAK), effectively reduced macrophage migration to WT levels or lower (KO + MVC = 34.11, KO + TAK = 15.89) (Fig. 7j, k). Together, these findings demonstrate that SETDB1 regulates CCL5 expression in EC and that CCL5 serves as a key driver of macrophage migration upon SETDB1 loss.
To verify the clinical relevance, the CPTAC dataset was analyzed. CCL5 shows a significant decrease in RNA expression in tumor tissues (n = 459) compared to normal tissues (n = 45) (Fig. 7l). Intriguingly, among different molecular subtypes of EC, the CNH group of patients shows lower expression of CCL5 compared to POLE or MSI patients (Fig. 7m). This illustrates an inverse correlation with SETDB1 expression across subgroups (Fig. 1c). Consistently, data from the EC-TCGA dataset indicates that higher expression of CCL5 predicts better overall survival (Fig. 7n). CCL5 also has a negative correlation (R = –0.306, p = 4.519e-14) with SETDB1 expression in EC-TCGA (Fig. 7o).
Consistent with findings on mouse cytokines, SETDB1 demonstrated a reverse correlation with all upregulated cytokines, such as CCL5 (r = –0.348, p < 0.0001), CCL3 (r = –0.1, p = 0.015), and CCL4 (r = –0.218, p < 0.0001) in the EC-TCGA dataset (Fig. 7p, q). Moreover, SETDB1 displayed a negative correlation with various T cell inflammatory markers such as CD8A (r = –0.195, p < 0.0001), IFNG (r = –0.165, p < 0.0001), and CXCL9 (r = –0.105, p = 0.011). To validate the reverse correlation between SETDB1 and CCL5/CD8A at the protein level, we selected two sets of EC patient samples. The high SETDB1 expression group exhibited low CCL5 and CD8A levels and vice versa (Fig. 7r, s). These data are consistent with the reverse correlation observed in the TCGA dataset, suggesting that SETDB1 facilitates the immune escape through downregulation of CCL5 and CD8A expression.
In conclusion, our data demonstrated that CCL5 is repressed by SETDB1 and potentially plays a central role in macrophage recruitment in tumors.
SETDB1-depleted cancer cells demonstrate greater sensitivity to M1-like macrophages in vitro
Next, we sought to find out whether infiltrating macrophages in SETDB1–/– tumors directly kill the tumor cells. We isolated bone marrow from the female NSG mice and differentiated them into macrophages as previously described [45, 46]. Bone marrow-derived macrophages were either polarized into M1-like macrophages by IFN-γ and LPS stimulation or kept in a non-activated neutral state (M0). SETDB1–/– or WT Ishikawa cells were cocultured with M1 or M0 macrophages for 24 h. To determine whether M1-like macrophages induced greater killing of SETDB1–/– cancer cells, we stained the cocultured macrophage/cancer cell mixture with CD45 antibody and a viability dye (Zombie), followed by flow cytometric analysis (steps shown in Fig. 8a). No significant changes in cell death were observed in WT cells in M0 and M1 conditions. However, in SETDB1–/– cells, increased cell death was observed in the M1 group (Fig. 8b, c).
Fig. 8: M1-like BM-derived macrophages induce more killing in SETDB1-deficient cancer cells in vitro.
a Experimental timeline for in-vitro BM-derived macrophage differentiation, M1 polarization, co-culture with cancer cells followed by flow cytometry staining and analysis. b Representative gating strategy measuring percent cancer cell deaths and changes in cell numbers induced by M1-like macrophages in co-culture treatment for WT and SETDB1–/– Ishikawa cancer cells. c Quantification of macrophage-induced cell death for wildtype and SETDB1–/– Ishikawa cancer cells co-culture in M0 and M1 conditions (n = 4 biological replicates). d Quantification of cancer cell numbers for wildtype and SETDB1–/– cancer cells co-cultured with M0 or M1 induced macrophages (n = 4 biological replicates). e Cancer cell death in wildtype and SETDB1–/– cancer cells in M0 and M1 conditioned media (No macrophage present) (n = 2 biological replicates). f qPCR mRNA quantification for M1 related markers Nos2, Il1β, Tnfα, and Ccl5 after macrophage M1 polarization with LPS and IFNγ for 24 h and 48 hr (n = 3 technical replicates). g Representative fields of pHrodo+ RAW264.7 cells (phagocytic RAW264.7 cells) co-cultured with WT, SETDB1–/– (KO), and KO with CD47 re-expressing (KO + CD47) Ishikawa cells after 24 hr. h Quantification of the percentage of phagocytic pHrodo+ RAW264.7 macrophages co-cultured with WT, KO, and KO + CD47 Ishikawa cells over a 24 h period (n = 6/group). The data are shown as mean ± SD. Statistical tests: One-way ANOVA with post hoc Tukey’s multiple comparison test (c, d, e, h), Unpaired t-test with Welch correction (f). ns, not significant.
When measuring the total cell number, both WT and SETDB1–/– cells showed a reduction when co-cultured with M1-like macrophages. However, the reduction was significantly higher for SETDB1–/– cancer cells (Fig. 8d). These data suggest that SETDB1–/– cells are more susceptible to macrophage-induced killing due to reduced “don’t eat me” signaling. Additionally, M1-like macrophages conditioned media alone did not promote any cell killing in either WT or SETDB1–/– cancer cells, indicating that cell death requires direct macrophage interaction (Fig. 8e). When macrophages were polarized to M1, the M1 related genes including Nos2, Il1β, Tnfα, and Ccl5 were all upregulated, further confirming that NSG macrophages are functional (Fig. 8f). Since loss of SETDB1 led to reduced CD47 expression, we asked whether the enhanced killing of SETDB1–/– cells by macrophages was due to increased phagocytosis. Indeed, labeling WT and SETDB1–/– cancer cells with pHrodo Red and co-culturing them with RAW264.7 macrophages resulted in a substantially higher proportion of phagocytic (pHrodo + ) macrophages in the SETDB1–/– condition compared to WT (KO = 10.79 vs. WT = 3.64) (Fig. 8g, h). Furthermore, overexpression of CD47 in the SETDB1–/– cells significantly reduced macrophage phagocytosis (KO + CD47 = 5.09). Together, these findings indicate that SETDB1–/– cells are more susceptible to macrophage-mediated killing due to diminished CD47-dependent “don’t eat me” signaling.
Knocking out Setdb1 in the mouse-derived EC cell line, MSH2-369, significantly reduces tumor growth and promotes macrophage infiltration in immunocompetent C57BL/6 mice
As NSG mice lack an important adaptive immune system, to overcome this limitation, we extend our study to immunocompetent C57BL/6 mice. Mouse EC cell line MSH-369 cells (MSH2–/– clone) were chosen, and Setdb1 was successfully knocked out using LentiCRISPR-mediated knockout (Fig. 9a). Setdb1–/– clones sg1-1, sg2-5, and sg4-3 had significantly slower proliferation in vitro (Fig. 9b).
Fig. 9: Knockout SETDB1 decreases tumor growth in immunocompetent mice (C57BL/6 tumor + immune cells).
a Setdb1 Immunoblot for mice MSH2-369 Setdb1 knockout single clones from sg1 and sg4 Setdb1 lentiviruses. b Cell proliferation measurements for Setdb1 knockout clones and wildtype MSH2-369 cell lines (n = 4 biological replicates). c Tumor growth trend for wildtype, 1-1, and 4-3 single clones of Setdb1 knockout subcutaneously injected in C57BL/6 mice (n = 10/group). d Pictures of wildtype and Setdb1–/– MSH2-369 tumors. e MSH2-369 tumor weights measurements for wildtype, 1-1, and 4-3 knockout clones (n = 10/group for wildtype, n = 8/group for 1-1, n = 3/group for 4-3). f Gating strategy for measuring F4/80 + CD11b+ macrophages in CD19-NK1.1-CD8-CD4- population subset for wildtype and Setdb1–/– MSH2-369 tumors. g Percent of macrophages in total viable CD45+ cells in wildtype and Setdb1–/– MSH2-369 tumors (paired t-test statistical analysis). For b, g, h, i, Data shown as mean ± SD. For c, Data shown as mean ± SEM. In e, boxplots have been spanned throughout the whole data. The low and high end of the box represent 25th and 75th percentiles respectively. Middle horizontal line represents the median. All the data points are visually displayed on the boxplot. j Graphical scheme shows dual functions of SETDB1: inside of nucleus, knock out SETDB1 promotes ZNFs, ERVs, CCL5, and inhibits POLR2A, CD47. in the cross talk between tumor cells and macrophages, knockout SETDB1 decreases CD47, advances CCL5 expression, which in turn attracts macrophages. Statistical tests: Unpaired Student’s t-tests (b, c, g, h, i) Kruskal-Wallis ANOVA test with post hoc Dunn’s multiple comparison test (e). ns, not significant.
Next, sg1-1 and sg4-3 knockout and wild-type cells were injected subcutaneously into C57BL/6 mice. Setdb1–/– tumors exhibited a significantly decreased tumor growth rate. Strikingly, sg1-1 had 1/5 mice, and sg4-3 had 3/5 mice with no tumor growth (Fig. 9c, d). Both knockouts had smaller tumor weights; however, only sg4-3 achieved statistical significance (Fig. 9e). Next, we explored how the immune system plays a role in tumor regression.
Using various immune cell markers (i.e., CD45, CD3, CD19, CD11b, F4/80, NK1.1, CD4 + , CD8 + , etc.), we sought to quantify different immune cells (i.e., T and B-lymphocytes, NK cells, and macrophages) and their proportions in the wildtype and Setdb1–/– tumors. Intriguingly, we observed significantly more macrophages in Setdb1–/– tumors ( ~ 25.6% of the total CD45+ immune cells) compared to wildtype ( ~ 17.1%) (Fig. 9f, g). This finding was consistent with our previous observation on NSG mice growing human-derived EC cells (shown in Fig. 6a, b). Further examination of T cells revealed that the CD4 + T cell population in Setdb1–/– was 6.97% vs. 2.97% in wildtype (Fig. 9h). In contrast, CD8 + T-cells in SETDB1–/– tumors showed a non-significant upregulation (Fig. 9i). Other immune cell subtypes were either not present (ex. B-cells) or did not change significantly between wildtype and Setdb1–/– tumors.
