


Clinical cohorts
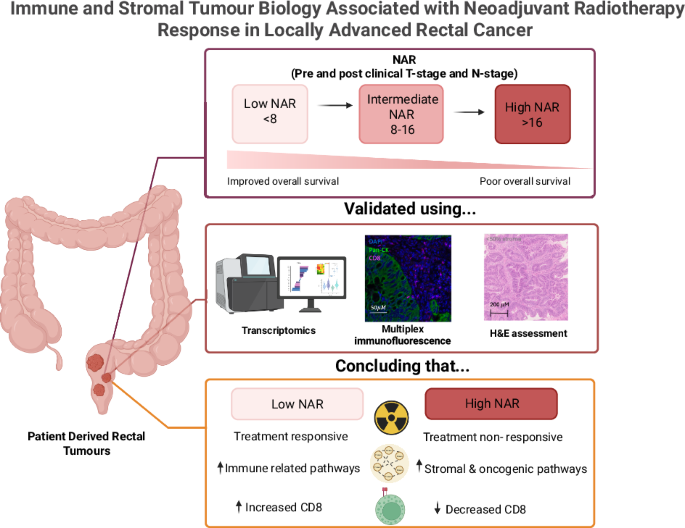
Patients from the Beatson West of Scotland Cancer Centre (BWoSCC), Stratification in Colorectal Cancer (S:CORT) Grampian cohort and GSE87211 cohorts all had rectal adenocarcinomas. Informed consent from patients was obtained. All patients received neoadjuvant radiotherapy, followed by surgical resection. To calculate the NAR score, pre-treatment clinical T-stage determined by MRI, and a post-treatment T-stage and N-stage by pathologic staging were required.
The BWoSCC cohort consisted of n = 57 patients with pre-treatment biopsy tissue treated at the BWoSCC 2008–2016. 50 Gy of radiotherapy was delivered in 25 fractions with concurrent oral capecitabine or intravenous 5-fluorouracil-based chemotherapy. This study received ethical approval from the NHS Greater Glasgow and Clyde Research Ethics Committee (ref; 20/ES/0012). With informed consent.
The S:CORT consortium Grampian cohort comprised n = 193 rectal cancer patients who received neoadjuvant radiotherapy and has been described previously [9]. Patients received of 50 Gy of radiotherapy in 25 fractions or 25 Gy in 5 fractions. Additionally, some patients received capecitabine concurrently or 5-FU/oxaliplatin-based chemotherapy after radiotherapy.
GSE87211 comprised n = 200 rectal cancer patients enrolled in the CAO/ARO/AIO-944 or CAO/ARO/AIO-04 trial with transcriptomic microarray data available. Patients received 50.4 Gy of radiation in 28 fractions with concurrent 5-FU alone or in combination with oxaliplatin-based consolidation chemotherapy.
Multiplex immunofluorescence
Multiplex immunofluorescence in the BWoSCC tissue was performed with Leica BOND RX (Leica Microsystems, Cambridge, UK) using Epredia’s (Runcorn, UK) UltraVision Quanto (UVQ) Detection System horse radish peroxidase (HRP) kit. In brief, slides we deparaffinised, then Bond™ Epitope Retrieval 2 (ER2; 97 °C for 30 min), Hydrogen Peroxide Block (10 min), Protein Block (5 min), primary antibody (10 min), Primary Antibody Amplifier Quanto (10 min), HRP Polymer Quanto (10 min) and Akoya (Marlborough, MA) Opal™ Fluorophore (10 min) sequentially. Antibody complexes were stripped with Bond™ ER2. Primary antibody and Opal™ Fluorophore pairs were applied in successive rounds in the order: (1) FOXP3(Abcam; Cambridge, UK; Ab20034) -Opal™480 (,(2) CD3-Opal™520, (3) CD8 (Dako Aligent, Santa Clara CA; M7103)-Opal™650, (4) Ki67-Opal™570, (5) Pan-cytokeratin (Thermofisher; Cheshire, UK; MS-343-P)-Opal™780. Spectral DAPI for 5 min (Akoya). Tissue was mounted in Thermofisher Prolong Diamond Mountant. Slides were scanned on a S60 Hamamatsu Nanozoomer (Hamamatsu, Hertfordshire,UK). Stained tissue was annotated and scored on QuPath [10]. Three representative areas totalling 1,080,000\(\mu\)M2 per biopsy were selected. Areas were manually annotated as tumour epithelium (pan-cytokeratin, positive DAPI positive), microenvironment (pan-cytokeratin negative, DAPI positive) or ignore (negative, abnormal morphology or artefact). CD8-positive cells were counted where staining surrounded a nucleus. Microsoft Excel was used to calculate cell densities by normalising CD8+ cells by total area of each compartment.
Tumour stromal percentage (TSP)
TSP accessed using by scoring H&Es according to whether > 50%/ \(\le\)50% of the tumour area was stroma.
Tumour purity
Tumour purity was estimated using the ESTIMATE algorithm (Estimation of STromal and Immune cells in MAlignant Tumor tissues using Expression data), where stromal and immune scores were calculated from gene expression data and combined to generate the ESTIMATE score.
Microarray
The S:CORT consortium retrieved archival formalin-fixed paraffin-embedded (FFPE) pre-treatment diagnostic biopsies which were processed for the Almac Diagnostics XCEL microarray as described previously [11]. Microarray data was checked by S:CORT consortium researchers then pre-processed where raw CEL files underwent robust multiarray average normalisation for Almac Diagnostic XCEL array with the affy package (v1.56.0). 193 samples had microarray data and sufficient clinical data for analysis.
Clinical and gene expression data for GSE87211 was downloaded from the gene expression omnibus. FFPE pre-treatment diagnostic biopsies were processed for Human 4344 K v2 array platform as described previously [12]. A total of 200 samples had microarray data and sufficient clinical data for analysis.
Transcriptomic analyses
Differential gene expression between two groups were accessed using limma (v1.44.0). To compare expression of pre-defined pathway signatures between two groups, pairwise geneset enrichment analysis (GSEA) was performed. The mSigDB Hallmark signature set was accessed via the msigdbr (v7.5.1; [13]). A ranked gene list was prepared by ranking genes in the Limma output by t-statistic. The GSEA was performed on the ranked genelist using the fgsea() function from the package fgsea (v1.30.0; [14]). The package R MCPcounter (v1.2.0) was used to access the MCP (Microenvironment Cell Population) algorithm and calculate scores, which were visualised using the geom_boxplot() argument in the ggplot2 R package (v3.5.1)
Statistical analysis
Analysis of data was performed by generating Kaplan Meier curves using Survival version 3.7-0 in R Studio with R version 3.6.0 (RStudio, Boston, MA, USA). Univariate cox regression were performed and generated in SPSS version 29 (IBM SPSS, Chicago, IL, USA).
